UK Resilience Programme
Evaluation
Interim Report
Research Report DCSF-RR094
Amy Challen, Philip Noden and Anne West
(London School of Economics and Political Science)
and
Stephen Machin
UK Resilience Programme Evaluation
Interim Report
Amy Challen, Philip Noden and Anne West
(London School of Economics and Political Science)
and
Stephen Machin
(London School of Economics and Political Science /
University College London)
The views expressed in this report are the authors’ and do not necessarily reflect those of the Department for Children, Schools and Families.
© London School of Economics 2009
ISBN 978 1 84775 415 8
April 2009
1
Evaluation of the UK Resilience Programme
There are increasing concerns about children’s well-being1 in the UK, their behaviour, and
the low academic attainment of a large fraction of the population.2 More recently, the
potential and duty of schools to promote well-being has been stressed as part of the Every Child Matters agenda. In order to promote positive behaviour and well-being in schools, three local authorities (South Tyneside, Manchester and Hertfordshire) have piloted a programme which aims to build resilience with Year 7 pupils across 22 of their schools from September 2007 (the “UK Resilience Programme”), with more schools and other non-school settings joining from September 2008.
The evaluation aims to investigate whether the programme (previously trialled in small samples) can be delivered at scale; whether it has an impact on children’s well-being; and if so, whether this will have an impact on behaviour, attendance and academic attainment (when and if data on the latter outcome become available).
The first interim report gives an overview of the programme and its implementation; to provide an account of the progress of the evaluation; and to offer some preliminary findings about its short-run impact. Further work is needed on the quantitative analysis, and longer-run impacts can only be evaluated with data collected in the summer of 2009 and 2010. The qualitative work was carried out by Dr. Philip Noden and Prof. Anne West.3
Th
e quantitative work is by Amy Challen
4and Prof. Stephen Machin
5.
1 There is no agreed definition of ‘well-being’, and the UNICEF report mentioned below includes dimensions such
as material deprivation and educational attainment as well as subjective well-being, interpersonal relationships and health and safety. In this interim report the focus is primarily on subjective well-being and psychological health, although outcomes examined in future reports will include behaviour and academic attainment.
2 See, for example, the recent UNICEF report “An overview of child well-being in rich countries” which puts the UK
at the bottom of a list of 21 advanced countries:
http://www.unicef-irc.org//presscentre/presskit/reportcard7/rc7_eng.pdf
3 Education Research Group, Department of Social Policy, London School of Economics and Political Science. 4 Centre for the Economics of Education and Centre for Economic Performance, London School of Economics
and Political Science.
5 Centre for the Economics of Education and Centre for Economic Performance, London School of Economics
2
CONTENTS
1.
Executive
Summary
3
2.
The
UK
Resilience
Programme
4
3.
The
Evaluation
Design
8
4.
Management
of
the
Evaluation
14
5.
Pupil
Satisfaction
18
6. Facilitator Experiences of the Workshops
27
7. Descriptive Statistics and Quantitative
Analysis
39
8.
Qualitative
Findings
61
9.
Summary
of
Interim
Findings
96
Annex A: Pupil Satisfaction Survey
98
Annex B: Description of the Penn Resiliency Program
100
(Reivich et al.)
Annex C: Description of PRP for Children and Adolescents
118
(Reivich et al.)
3
1. Executive
Summary
The UK Resilience Programme (UKRP) aims to improve children’s psychological well-being by building resilience and promoting positive thinking. It was launched in three local
authorities in the academic year 2007-08, with workshops delivered to Year 7 pupils in secondary schools. This report presents the interim findings for the evaluation of the UKRP, commissioned by the Department for Children, Schools and Families.
Methodology
Information on pupils’ well-being was collected through questionnaires administered before and after the programme to pupils who had participated in UKRP workshops and to a control group. Participating pupils and staff were also surveyed about their experiences of the programme. In addition, interviews with pupils, facilitators and school managers were carried out in 10 of the 22 secondary schools involved in the programme.
Key findings
• The initial quantitative work found a significant positive impact on pupils’ depression and anxiety symptom scores for those schools where the treatment and control groups were well matched.
• These effects varied by pupil characteristics, and were larger for pupils who had not attained the national target levels in Key Stage 2 exams, and for pupils with worse initial scores for symptoms of depression or anxiety.
• Pupils were positive about the programme, with the majority reporting they enjoyed the workshops, and that they had learned skills that would help them solve problems, feel happier, and behave well.
• Interviews with pupils suggested that pupils had applied UKRP skills in real life situations, and some interviewees showed a good understanding of elements of the programme.
• The content of the UKRP is quite intellectually demanding and some facilitators believed that some pupils struggled with this.
• Facilitators were extremely positive about the ideas underlying the programme and about the training they had received. Most reported that they used the skills
themselves.
• Most facilitators believed that the skills could make a positive difference to pupils in various domains of their lives, including psychological well-being and peer
relationships.
• There was considerable variation in the way schools and facilitators organised the programme. The programme must be taught by trained facilitators in groups of no more than 15 and schools had to overcome the consequent organisational
challenges.
• Facilitators found the relatively didactic structure of the programme problematic, with a lot of time taken up with ‘teacher talk’.
4
2.
The UK Resilience Programme
The UK Resilience Programme is the UK implementation of the Penn Resiliency Program, a well-being programme that has been trialled more than 13 times in different settings. The UKRP was taught from September 2007 in three participating local authorities, and those workshops that took place in mainstream schools form the subject of this evaluation. This section outlines the PRP curriculum used and its implementation in the UK, with particular reference to how this fits with the evaluation.
The Penn Resiliency Program
The Penn Resiliency Program (PRP) is a curriculum developed by a team of psychologists at the University of Pennsylvania. Its original aim was to prevent adolescent depression, but it now has a broader remit of building resilience and promoting optimistic thinking, adaptive coping skills and social problem-solving in children, with the aim of improving psychological well-being, but potentially also behaviour, attendance and academic outcomes. Thirteen randomised controlled trials have found PRP to be effective in helping buffer children against anxiety and depression, and some studies have found an impact on behaviour. The skills taught in PRP could be applied in many contexts, including relationships with peers and family members, and achievement in academic or other activities.6
PRP is a manualised intervention comprising 18 hours of workshops. (“Manualised” means that no additional materials or resources are required to lead the workshops.) The curriculum teaches cognitive-behavioural and social problem-solving skills. Central to PRP is Ellis'
Activating-Belief-Consequences model that beliefs about events mediate their impact on
emotions and behaviour. PRP participants are encouraged to identify and challenge negative beliefs, to employ evidence to make more accurate appraisals of situations and others’ behaviour, and to use effective coping mechanisms when faced with adversity. Participants also learn techniques for positive social behaviour, assertiveness, negotiation, decision-making, and relaxation.
The manualised nature of the curriculum and the intensive training required before using it allows facilitators to be drawn from a wide range of professions and agencies including teachers, learning mentors, teaching assistants, psychologists and health professionals. The training takes around 8-10 days, with the first half of the course focusing on teaching trainees the adult-level Cognitive Behavioural Therapy (CBT) skills, and the second week on
familiarising them with the students’ curriculum and practising how to communicate it to pupils.
Please see Annex C (Summary of PRP Curriculum) for more detail on the content of each PRP lesson. Additional information on PRP can also be found online at:
6 One PRP study found an effect on behaviour (see Annex B for research summary), and academic attainment
5
Summary of PRP Research
Overall, the 13 randomised controlled trials that have been conducted of PRP suggest that it can prevent symptoms of depression and anxiety in universal, targeted and clinic samples, and one study found a reduction in disruptive behaviour (most studies did not measure behaviour). However, there are some inconsistent findings. Some studies found no effect on depressive symptoms, while others found an effect on some groups but not others. In a meta-analytic review of the PRP studies, the PRP team further find a link between measured impact and the level of training and supervision of the workshop facilitators, implying that despite the manualised curriculum, facilitator quality is important and treatment heterogeneity is likely. In addition, the sample sizes used in prior PRP studies are relatively small, and scaling-up is a common evaluation problem, with the efficacy of an intervention frequently decreasing as the number of subjects involved increases.
For a more detailed summary of previous research on PRP, please see Annex B at the end of this document, an executive summary of the programme and research by Reivich et al.
UK implementation
The UK Resilience Programme is the first larger-scale use of the PRP curriculum,
implemented as 18 hours of workshops for Year 7 children in 22 UK secondary schools. The first cohort of workshops took place in the academic year 2007-8, and involved just under 2000 pupils. These workshops are the subject of the DCSF-funded evaluation.
Curriculum materials
The American curriculum materials required ‘translation’ into British English. LA staff read the materials and suggested changes, then these were looked over again by a British children’s author. As many cultural references as possible were changed, but in some cases this would have involved changing artwork so it was not possible. The result was a set of materials that was largely anglicised but still had an American feel.
Selection
Schools
Three local authorities opted to become involved in the UK Resilience Programme, and in December 2006 they made presentations to potentially interested schools to promote the programme. In some cases this was to a selected group of schools the LA thought would be most interested and most appropriate for the intervention; in others all local secondary
schools were invited to get involved. Not all eligible schools chose to take up the programme.
Facilitators
The first cohort of 90 workshop facilitators was trained in Philadelphia in the United States from 23rd July to 3rd August 2007. The majority were teachers, but other staff included
learning mentors, teaching assistants, local authority staff and one school nurse. About 65 facilitators were school-based, while almost all of the others were employed by the local authorities. Interested schools were allocated a number of places by their local authority, and the selection procedure for facilitators varied by school. In some schools particular
6
facilitators were largely self-selected, although some also had to go through a selection procedure at their school and others were strongly encouraged to participate despite their reluctance to volunteer. Once selected, future facilitators registered and completed an online positive psychology program called Resilience Online.7 This introduced them to the principles
of CBT, and encouraged reflection on their own emotional responses and behaviour. A few people were unable to attend the training in Philadelphia for health or other reasons, and some of these places were filled at the last minute by others from within the local authority.
In practice then, schools and local authorities were selected. Facilitators were also self-selected, although some may also have had some selection imposed by their school. Because of the absence of centralised selection, and of the involvement of the PRP team, one might expect that facilitator quality would be more variable than if an open application system had been used. However, the self-selection might result in facilitators being particularly highly motivated (perhaps increasing the success of the workshops), making it harder to extrapolate results outside of the sample. In addition, schools had to abide by certain restrictions when timetabling workshops. These included ensuring that only trained staff were timetabled to teach the subject, and that classes did not contain more than 15 pupils, resulting in a doubling of staffing and rooms for these classes. These were difficult conditions to meet. Facilitators were asked to give up the first two weeks of their summer holidays in order to train in Philadelphia, and had to prepare a large amount of new material in order to teach the workshops. One would therefore expect that these individuals and schools were highly motivated and enthusiastic, and had a strong belief in the importance of the subject being taught. This could limit the validity of extrapolating our results outside of the sample, as other participants might not be so committed.
Training
As mentioned above, the training of the facilitators took 10 days (five days of training, a weekend off, then another five days’ training). In the first week trainees became familiar with the adult-level CBT skills, and in the second week they studied the PRP curriculum and practised teaching it to others. Although the initial plan was that the PRP team could withhold accreditation from anyone they felt had not reached the required standard, in practice
everyone received a certificate and was assumed to be ready to deliver workshops on their return to the UK. This was probably both because of the necessity of having enough staff to deliver the planned workshops, and because the trainers did not feel they knew the trainees well enough to judge their level (although they were able to provide some confidential and basic assessments of facilitator quality for the purposes of the evaluation only).
Because of cancelled flights, one LA group arrived late and missed the first three days of training. The trainers worked with them to catch up on material missed, but it was felt that they did not receive the same social experience as those who had arrived four days earlier.
Workshops
Most schools had already planned how to deliver the workshops before the end of the summer term 2007, but many revised their plans in September. They were asked to form UKRP groups of not more than 15 pupils, and to schedule the classes during the normal school day. The majority timetabled the programme by splitting an ordinary teaching class in two to get two UKRP groups taught by two facilitators simultaneously, but there were
variations on how this was achieved. Many schools did not include as many pupils in
workshops as they had originally intended, and there were only seven schools that managed to include all Year 7 pupils. This was achieved by having some workshops facilitated by trained LA staff, with the exception of one school with an unusually small Year 7 intake which
7
used only their own staff and yet managed to cover the full year group. Another school used class sizes larger than 15 in order to cover all Year 7 pupils.
Two schools were unable to start workshops until January 2008 due to problems involving timetabling and/or the support of senior management. Almost all of the others started their first workshops in September, with a few starting in October. This varied within school as well as by school. Two schools were obliged to restart their workshops at October half term, because the lessons that the groups were timetabled against were setted (e.g. science set 3), and teachers had decided that the initial settings based on Key Stage 2 results and primary school reports were not appropriate. One school came across this problem but did not change the sets in order to preserve the UKRP groups.
Most schools taught lessons of one hour, and since the UK Resilience Programme was meant to be timetabled for a minimum of 18 hours this would normally take up about half a year of lessons. Some schools taught this fortnightly, meaning that their workshops lasted all year, and some weekly, with the first set of workshops finishing around February or March (see the description of the evaluation for details). Many of the latter schools then went on to do a second set of workshops which lasted until July.
In most cases, UKRP lessons were fitted into an already full Year 7 timetable, and schools chose different lessons to replace. In the large majority of cases this was PSHE / citizenship / Learning to Learn, but some schools replaced other lessons such as English or science (see the evaluation section).
There were some changes of workshop facilitators during the year, due to departure of the facilitator; illness; and maternity leave. These workshop groups were taken over by other facilitators. There were also pupils who changed workshop group, although these were relatively few.
Supervision and support
Facilitators teaching workshops were asked to participate in a series of nine one-hour conference calls with a PRP trainer and approximately 10 other facilitators, to provide continued support and training once they had started the workshops. Calls were weekly or fortnightly at the start of the year, becoming less frequent as time went on. Attendance on these calls was generally good, but after the first few calls most facilitators did not find them to be particularly helpful in offering support.
Some schools chose to use team teaching in the first year of workshops, in order to provide greater support to staff teaching the unfamiliar curriculum for the first time. This was
particularly popular with facilitators who were learning mentors rather than teachers, as they were often inexperienced in teaching classes. In most schools facilitators met regularly (formally or informally) to discuss their workshops, and in some cases facilitators would plan lessons together. Again, this was particularly popular where one facilitator was not a teacher. Each LA also held termly meetings, but these were more for organisation than for support.
Further cohorts
The second cohort of 67 workshop facilitators were trained in Cambridge (UK), from 16th to
25th July 2008. The training period was shortened to eight days, and several new schools
8
3.
The Evaluation Design
As mentioned above, the PRP curriculum has been evaluated a number of times, but in small samples and with a high degree of control from the developers of the curriculum. Since a major problem in policy evaluation can be a decline in programmes’ efficacy after scaling up (i.e. what happens when a small, select programme is rolled out), it is hard to draw any conclusions about whether these programmes would function well if used in schools more widely. The total sample of students involved in previous evaluated interventions was roughly 2000, which is about the same size as the workshop group in this evaluation. This evaluation therefore adds considerably to the evidence on the efficacy of the PRP curriculum.
Design
The evaluation has been designed as a controlled trial, with ‘treatment’ (i.e. workshop) and control pupils in each of the 22 participating schools.8 Pupils could not be randomised into treatment or control because of timetable constraints, but the schools agreed that the method of selecting which pupils received workshops should be arbitrary, e.g. choosing the form group that fitted the timetable slot available, rather than choosing pupils they thought would benefit most. It was hoped that this would result in ‘as-if’ randomisation, with workshop and control pupils being similar on observable and unobservable characteristics. However, this is not true statistical randomisation and we will use statistical testing to determine whether it has in fact worked. When splitting a class in two to make a workshop group, schools also agreed to do this in an arbitrary way e.g. alphabetically.
Control groups
Those schools which wished to include all of their Year 7 pupils in workshops (seven
schools) used the year-ahead group as the control group. In order to obtain baseline (start of Year 7) measures from these pupils they would have had to be surveyed in September 2006, before the project had begun. Because of this, only measures taken when the pupils were at the end of Year 7 are available for this group: we have no baseline for them, only a follow-up measure. Those schools with within-year control groups will have baseline measures for both workshop and control pupils. Six schools have both within-year and year-ahead control groups, and the remaining nine schools have a within-year control group only (see Table 1 for details by local authority, and Table 2 for details by workshop timing).
There is a possibility of externalities or spillovers, where workshop participants within a school influence the outcomes of those not involved in workshops through social interactions or other channels. Positive spillovers would bias downwards the estimate of the effect of the programme. Depending on the mechanism through which externalities operate, it is possible that the two control groups will produce different results if, for instance, the main channel is through pupils’ peer interactions and these are more likely to occur within a year group than between year groups.
There are no control pupils outside of the workshop schools. This is not necessarily a problem, as the most appropriate control group is arguably made up of pupils in the same school. However, if programme schools are different from other schools (e.g. more
concerned about pupil well-being) it is possible that this would understate or overstate the programme effect, as (for instance) they might have a positive effect on pupil well-being in the control group independently of the programme. For future analyses we should be able to
8 We will use the language of ‘treatment’ and ‘control’ throughout, as this is the standard terminology in our field of
9
use matched control groups when outcomes such as attendance are obtained from the National Pupil Database, but this is not possible for the majority of the analyses.
There are roughly 2000 children in the workshop group for the UKRP evaluation and up to 4000 in the pooled controls. Table 3 presents information on attrition and the sample size at each wave.
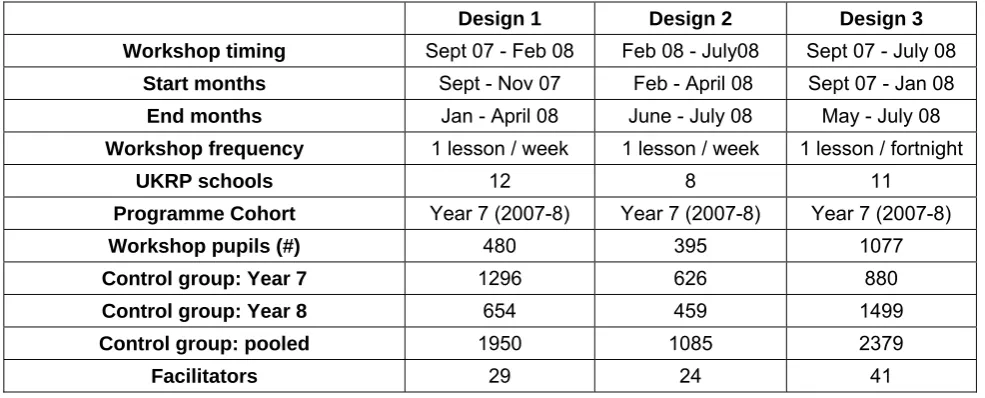
[image:12.595.51.544.401.600.2]Table 1: Control and Treatment group details by Local Authority
Table 2: Control and Treatment group details by workshop timing and design
Design 1 Design 2 Design 3
Workshop timing Sept 07 - Feb 08 Feb 08 - July08 Sept 07 - July 08 Start months Sept - Nov 07 Feb - April 08 Sept 07 - Jan 08
End months Jan - April 08 June - July 08 May - July 08 Workshop frequency 1 lesson / week 1 lesson / week 1 lesson / fortnight
UKRP schools 12 8 11
Programme Cohort Year 7 (2007-8) Year 7 (2007-8) Year 7 (2007-8)
Workshop pupils (#) 480 395 1077
Control group: Year 7 1296 626 880
Control group: Year 8 654 459 1499
Control group: pooled 1950 1085 2379
Facilitators 29 24 41
Note: schools, facilitators and control group pupils will sum to more than the totals reported in Table 1 because schools ran multiple workshops and many of these had different timing. For instance, schools that ran workshops from September - February (design 1) often went on to run another set from February - July (design 2).
LA 1 LA 2 LA 3 Total
UKRP schools 6 9 7 22
Programme Cohort Year 7 (2007-8) Year 7 (2007-8) Year 7 (2007-8) Year 7 (2007-8)
Year 7 Coverage 33-100% 15-70% 11-100% 49%
Workshop pupils (#) 755 516 681 1952
Control group: Year 7 162 1137 714 2013
Control group: Year 8 960 130 1063 2153
Control group: pooled 1122 1267 1777 4166
Facilitators 30 24 32 86
Facilitators who taught workshops covered by the evaluation
10
Table 3: Attrition and sample size at each wave
Number of pupils at each wave for whom there is at least one questionnaire (teacher or pupil questionnaire)
Treatment Control Total Cohort
Wave A 0 2153 2153 year-ahead cohort
Wave B 1886 1898 3784 workshop cohort
Wave C 731 1212 1943 workshop cohort
Wave D 1911 1903 3814 workshop cohort
Pupils with a questionnaire for both B and D 1847 1794 3641 workshop cohort
Pupils with a questionnaire for both B and C 691 1145 1836 workshop cohort
Pupils with a questionnaire for both C and D 713 1158 1871 workshop cohort
Pupils with a questionnaire for B, C and D 675 1097 1772 workshop cohort
Pupils with a questionnaire for at least 2 of B, C and D 1901 1903 3804 workshop cohort
Pupils with a questionnaire for B only 23 56 79 workshop cohort
Pupils with a questionnaire for C only 2 6 8 workshop cohort
Pupils with a questionnaire for D only 26 48 74 workshop cohort
Although data were collected for the year-ahead cohort in July 2008, these are not examined in this report as they will form a control group for the data collected from the workshop cohort in July 2009.
Alternative treatments
Since schools have had to make room for UKRP workshops within an already full curriculum, control group pupils will be receiving some lessons that treated pupils will not. In most cases this will be 18 hours of the Year 7 PSHE curriculum, but some schools have displaced other lessons such as English, science or maths (see Table 4 for details). One school was
[image:13.595.39.553.127.354.2]reorganising its timetable and as part of this created a new UKRP slot, so there is no direct comparison in the control group. Moreover, class sizes for UKRP groups were not meant to be larger than 15 (and in 80% of classes this was the case), whereas in most cases the alternative treatment had class sizes of around 30. It is therefore not possible to disentangle the effects of smaller classes from the impact of the curriculum, though we will present suggestive evidence on this point from the facilitator survey (Section 6).
Table 4: Alternative treatments by Local Authority (# of schools)
LA 1 LA 2 LA 3 Total
UKRP schools 6 9 7 22
alternative treatments
PSHE, citizenship, Learning 2 Learn, thinking skills, pastoral, or Access
lessons 5 7 4 16
Science 0 0 1 1
RE 0 1 1 2
English & modern languages 0 1 0 1
English, science or maths 1 0 0 1
11
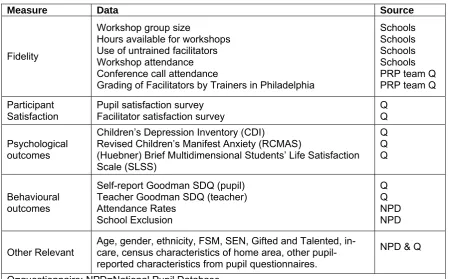
Measurement
Pupil well-being is measured using depression and anxiety inventories and other validated psychological questionnaires. Behaviour is assessed using a behaviour questionnaire filled out by both pupils and teachers (please see Annex D for further information on the
[image:14.595.64.515.217.496.2]psychological and behavioural questionnaires, and the start of Section 7 for more detail on scoring). We also use data from the National Pupil Database / Pupil Level Annual Schools Census (NPD / PLASC) on pupils’ demographic characteristics and their prior attainment. Table 5 shows the data elements used in the evaluation and the source for each.
Table 5: Quantitative data available, and source
Data collection points
The pupil and teacher questionnaires (psychological and outcome measures) were
administered up to four times per school from July 2007 to July 2008. The timing of some of these depended on the configuration of workshops within each school, as Year 7 data
collections were timed to take at the beginning and at the end of workshop sets. A further two data collections are planned to take place in all schools in July 2009 and July 2010. The measures of programme satisfaction were collected as soon as possible after the workshops were completed in each school.
Table 6 below gives an indication of the timing of collections and which data are collected at each point. The ‘workshop cohort’ consists of all pupils who started Year 7 in programme schools in September 2007, whether or not they participated in workshops. The year-ahead cohort refers to all pupils who started Year 7 in September 2006 in those schools which have these pupils as a control group.
Measure Data Source
Fidelity
Workshop group size
Hours available for workshops Use of untrained facilitators Workshop attendance Conference call attendance
Grading of Facilitators by Trainers in Philadelphia
Schools Schools Schools Schools PRP team Q PRP team Q
Participant Satisfaction
Pupil satisfaction survey Facilitator satisfaction survey
Q Q
Psychological outcomes
Children’s Depression Inventory (CDI)
Revised Children’s Manifest Anxiety (RCMAS)
(Huebner) Brief Multidimensional Students’ Life Satisfaction Scale (SLSS) Q Q Q Behavioural outcomes
Self-report Goodman SDQ (pupil) Teacher Goodman SDQ (teacher) Attendance Rates School Exclusion Q Q NPD NPD Other Relevant
Age, gender, ethnicity, FSM, SEN, Gifted and Talented, in-care, census characteristics of home area, other pupil-reported characteristics from pupil questionnaires.
NPD & Q
12
Logistics of Data Collection
Before each data collection we ask schools to send us lists for all pupils in Year 7 (and Year 8, where these pupils are to form a control group), including their names, Unique Pupil Numbers (UPNs), and form or class groups. Names are needed so that school staff could administer questionnaires; form or class groups so that we can bunch questionnaires into the appropriate groups for ease of administration; and UPNs so that we can preserve the
anonymity of the resultant dataset (only UPNs are recorded, not names), and link responses into the National Pupil Database. We also ask for a child protection contact whom we can contact in the event that we are concerned about particular pupils. Questionnaires are labelled with pupils’ names and codes, bunched into class groups, and couriered to schools. The school contact person for the project is responsible for organising the data collection within each school, and school staff administer questionnaires to pupils. School staff, usually form tutors, also complete teacher reports of pupil behaviour. Once completed,
questionnaires are couriered back to LSE where they are checked off before being sent for data capture.
13
Table 6: Timing of data collections, by number of schools and workshop timing (design)
# of schools by timing Date planned Date
completed # of schools Design 1
Design 2
Design 3
Cohort Data collected Year timing for cohort(s)
June-July 2007 Sept 07 12 schools 3 2 9 ahead Year- Psychological & behavioural measures End of Year 7
September 2007 Jan 08 all 22 schools 12 8 11 Workshop Psychological & behavioural measures Start of Year 7
All pupils: Psychological &
behavioural measures February 2008
(month varied by
school) May 08 11 schools 11 7 1 Workshop Workshop participants only: programme
satisfaction
End or start of workshops
All pupils: Psychological &
behavioural measures Workshop: end of Year 7 June-July 2008 Jan 09 all 22 schools 12 8 11 Both Workshop participants
only: programme
satisfaction Year-ahead: end of Year 8
Workshop: end of Year 8
June-July 2009 all 22 schools 12 8 11 Both Psychological & behavioural measures
Year-ahead: end of Year 9
June-July 2010 all 22 schools 12 8 11 Workshop Psychological & behavioural measures End of Year 9
14
4.
Management of the evaluation
This section gives a brief overview of how the practical side of the evaluation has gone, particularly where this has departed from the original plan as laid out in the evaluation tender.
Staff trained
As mentioned above, some staff who were to be trained in Philadelphia had to withdraw, and some of these spare places were offered to others. The substitutes did not sign up online or complete the Resilience Online program, and we therefore do not have ‘baseline’ information
on their characteristics or motivation for signing up for the training. Some of these questions were repeated in the end-of-workshop facilitator survey in order to obtain information on the full sample, but there are still gaps in the information we have about some facilitators. We do not regard this as a serious problem. However, ideally we would have a clearer idea of how facilitators were chosen within each school, in order to take account of selection when considering problems of scaling up and extrapolating out of sample.
Workshop timing, surveying and dosage
There was variation in the ‘treatment’ that each pupil received, only some of which we are able to observe. Much of this we were expecting: it is likely that every teacher has their own way of teaching a curriculum, and different groups of pupils will tend to react differently to the programme. However, there was variation in the organisation of workshops that probably caused further heterogeneity in treatment.
Some of this related to the timing of the workshops. Schools were expected to have decided how they would be timetabling and staffing the workshops by the end of July 2007. However, in September it became clear that some schools had not yet worked out how they were to deliver the workshops, and others had changed their plans. Moreover, some had not planned in accordance with the constraints set out at the beginning of the programme, e.g. that there should not be more than two sets of workshops over the year; that workshop sets should not overlap; and that workshops should start as soon as possible to the beginning of the school year in September. One school that had planned three sets of workshops could not change its timetable, although we did not regard this as a major problem for the evaluation.
Workshops starting in November or later posed more of a problem, because of the delay between the baseline in September and the start of the workshops, and because of the variation in the end point of the workshops between schools. Two schools moved forward the start of the workshops to early October for this reason. However, one school was not able to start workshops until January 2008 and could not survey pupils and teachers until this date; and another started surveying in September but did not start most workshops until January.
15
The main evaluation problem caused by variation in workshop timing was the timing of surveying. This had to be pre- and post-treatment in each school, and thus fell at different times for each school, and sometimes necessitated a compromise within a school when some workshops had finished but not others. The mid-year data collection took place from February to May 2008, and the differences in workshop timing were exacerbated by delays in administering and returning the questionnaires.
We know the dates that questionnaires were completed and can control for this. In the quantitative work, the month in which questionnaires were completed is significantly
associated with the responses given by pupils and teachers, which implies that survey timing is important.
The second problem, partly related to timing, relates to variation in workshop ‘quality’. This could be because of the day of the week the workshop was scheduled for, given the variation in hours of lessons received that this could produce. Alternatively, different groups within a school could receive the same number of hours, but some groups would have covered more of the curriculum because of the speed with which they progressed through it. Some
facilitators returned information about curriculum coverage, but most did not, so it would not be possible to control for variation in this except within a very reduced sample. We do have information on how many hours each group received, however, and this can be used as a measure of programme dose.9
Randomisation
Schools had agreed to arbitrarily assign Year 7 pupils to treatment or control when they were not including the whole of Year 7 in workshops. It was hoped that this would result in ‘as-if’ randomisation, with treatment and control groups looking very similar on observable
characteristics. However, some schools decided to target (some) pupils, or to assign pupils in a way that was not entirely arbitrary.10 This is particularly evident for those pupils included
in the workshops which ran from around February to July 2008, whose baseline
psychological scores are significantly worse than those in the previous treatment group or the control group (see Section 7 for details).
Even when pupils were assigned arbitrarily, or when the year-ahead group was used as a control, because of the small samples involved within each school and the possibility of natural variation between cohorts and classes, this would not necessarily result in an ideal control group being available. This may be particularly evident when a school has to teach UKRP in setted classes, and only the top or bottom sets in a particular subject receive the workshops: they will clearly be different from other pupils in the year, at least in terms of their academic performance, and possibly on other characteristics too.
We present evidence on the effectiveness of the three separate ‘experiments’ in the
quantitative section (Section 7). It appears that at least one has produced a workable control group, and we will focus upon this ‘experiment’ for the purposes of this report. In future work we will also return to the experiments where arbitrary assignment has been less successful to study these in more detail, with particular emphasis on using statistical methods to develop a better understanding of appropriate control groups.
9 This may not be an accurate measure of dosage, however, both because some of this information obtained from
schools is likely to be inaccurate; and because facilitators often compensated (when they could) for groups whose progression was slower by teaching more lessons. This may therefore be a poor measure for programme
completion or learning.
10 We asked each school how it assigned pupils to workshops. Of those cases in which pupils appear to have
16
Problems and delays in obtaining data
The most serious problem we have experienced for the purposes of this report is the length of time it has taken to obtain end-of-workshop data. Questionnaires should have been completed in June-July 2008, with some being followed up in September if necessary, but as late as November 2008 five schools were still missing a significant proportion of their year group for either teacher or pupil questionnaires. We took 80% to be a satisfactory proportion of the year group to form an adequate sample, however, in schools where few pupils were treated and where these pupils did not have questionnaires returned this was still not
enough. Similar problems had been experienced with the previous data collections, but not to the same extent. It was particularly difficult for school contacts to get form tutors or other staff to fill in the teacher questionnaires, especially when they had already surveyed the same pupils and teachers twice in the academic year 2007-8.
Some schools refused to complete the surveys altogether, or agreed to do them but failed to do so despite repeated requests until it was too late. For instance, there are three schools without any baseline teacher questionnaires, and one school initially refused to do any surveys in July 2008 but then agreed to survey pupils only. Where a large proportion of surveys are missing there are also problems, particularly in schools with a small Year 7 cohort. When schools do not chase up absentees for the pupil questionnaire it is likely that some sample selection bias is introduced, as pupils who are long term absent are perhaps more likely to have psychological or other problems and yet are less likely to be in the sample. Nevertheless, with the exceptions noted here, and in comparison to much research carried out with schools, sample sizes have been very good (See Table 3 for details). These are always above 80%, and in the majority of cases above 90%.
As mentioned above, the timing of the questionnaire (introduced into the quantitative work as month dummies) is significant in regressions of the psychological outcomes, and the gap between the end of treatment and the date of surveying could affect the measured outcome (although we can at least control for this). The delays in obtaining data meant that we could not start work on the rest of the sample until very late. Even obtaining information on which pupils were included in workshops was difficult, yet it was important to do this accurately in order to avoid confusing the treatment and control groups. The last questionnaires included in this analysis arrived on 9th January 2009, the full dataset was received from the data
capture company on 12th January, and the last information on pupils assigned to workshops
was received on 15th January. In addition, we received extracts from the National Pupil
Database on 8th January 2009, and although we have integrated and analysed the majority of
the information we requested we have not yet been able to look at behaviour and attendance data. We have therefore not gone into as much detail as we would have liked because of the delays in obtaining data. However, we will continue to work with the data available and will present more detailed findings in the next interim report.
Data matching
17
Other issues
We intended to obtain audio recordings of lessons from schools, in order to have them scored by the Penn team to provide measures of workshop fidelity or quality. However, few schools were willing to do this, and we felt it was better to concentrate on more important data items and avoid asking schools for too much. The Penn team also announced that they would not be able to carry out scoring in the near future, as they will not be employing the appropriate staff. We therefore do not have these measures of workshop quality.
We intend to conduct analyses of pupils’ friend networks, examining whether the programme had an impact on this and whether there were any spillovers from the treatment to the control group due to pupil association. However, the friends dataset is time-consuming to put
18
5.
Pupil Satisfaction
Pupils who participated in the workshops were asked to fill in a short (one side of A4)
questionnaire asking what they thought about the workshops. The first two questions come from the Goodman SDQ impact supplement for post-intervention (follow-up) questionnaires. These were included on the pupil satisfaction form to avoid confusing pupils who had not participated in workshops.
Questions 3-11 asked them how much they agreed with a series of statements, starting with “I liked the UK Resilience Programme lessons a lot”. Then followed some questions about whether they thought they had learned anything that could help them in academic subjects specifically, as this is an outcome of interest for the local authorities piloting the programme. The last few questions asked whether pupils had used the skills; and if so, which they had used and where and when; and gave them an opportunity to express any other comments on the programme. Please see Annex A for the questionnaire used.
Responses
In this section we will summarise the headline measures for the pupil satisfaction questionnaire. For most questions this will simply be a table of how pupils responded, but for some questions we will also provide cross tabulations by pupil characteristics when these appear to have an important relationship with the responses given. We have examined cross tabulations of all questions against the following pupil characteristics: sex; free school meal entitlement; special educational needs; behavioural, emotional or social special educational needs; SEN involving learning difficulties; all categories of SEN; the timing of workshops (e.g. September-February; October-July); Key Stage 2 attainment; frequency of workshops; number of hours of workshops; intensity of workshops (minutes per week); number of pupils in workshop group; and baseline (September 2007) scores on the depression, anxiety and life satisfaction inventories, as well as the baseline teacher scores of pupils’ behaviour (teacher SDQ). In most cases these were not significantly related to the pupils’ reported satisfaction with the workshops, although when they are, and this seems to contribute to an understanding of the programme, we report them.
Overall satisfaction
There were 1952 pupils included in UKRP workshops in school settings in 2007-8 who are included in the evaluation. Of these, 1629 returned a satisfaction questionnaire with at least some questions answered.11 These form the basis of the sample.
Total satisfaction was measured by summing the responses to questions 3-11 (reverse scoring questions 4 and 6), to give a total score ranging between 9 and 45. Note that a lower score reflects a more positive assessment of the workshops: had a pupil agreed strongly to all the positive statements (and disagreed strongly to the two negative ones) they would have a score of 9. A middle response of 3 (neither agree nor disagree) to each item would result in a total score of 27, so any scores below this imply a preponderance of positive responses over negative ones, and any above it a preponderance of negative responses.
11 As for most questionnaires in this study, items earlier in the questionnaire were more likely to elicit a response than
19
Overall, pupils were satisfied with the programme (see Table 7), with a median score of 20 and the mean slightly higher. This did not vary significantly by pupil characteristics such as gender or free school meal entitlement, but did by baseline psychological scores. Pupils were also on average more satisfied with the workshops that took place at the beginning of the year, from September to mid-year (usually February or March), than with those that lasted all year or those that took place in the second half of the year; and they were less satisfied with those that took place from September to July. Both of these differences were statistically significant at the 1% level (p-values from a mean-comparison test are reported in Table 7).12 These differences in means should be treated with caution as they do not control for pupil characteristics such as psychological baseline scores, which in some cases differ significantly between workshop designs.13 Nevertheless, when we split the sample into pupils who had workshops at least once
a week versus those who had workshops less frequently, we find that the former group report significantly higher satisfaction. Given that there are no significant differences in baseline psychological scores between the two groups (not shown), this could suggest that pupils were more satisfied with workshops that took place at least once a week.
One important question is whether the workshops are acceptable to pupils who already display some signs of psychological distress at the start of Year 7. As Table 7 shows, pupils who had a score above the median on the anxiety, depression or behaviour inventories were significantly less likely to report being satisfied with the programme, as did those who scored below the median on the life satisfaction scale. (Remember that a high score on the depression, anxiety and behaviour inventories indicates more distress; while a higher score on the life satisfaction scale indicates greater satisfaction.) This difference is statistically significant for all four
measures, and the general pattern continues across all items in the questionnaire. However, for the first three (pupil-reported) scores this could be due to reporting effects as much as genuine dissatisfaction with the workshops: those with a tendency to report more negatively would do so on both the assessment questionnaire and the satisfaction questionnaire (though this cannot be the reason for the association between satisfaction and the teacher-reported behaviour score). Moreover, the score is still fairly positive: as mentioned above, a middle response of 3 (neither agree nor disagree) to each item would result in a total score of 27, so any score below this implies more positive than negative responses. Nevertheless, it is also possible that distressed pupils may have been on average less satisfied with the workshops, for example because they found the subject matter or discussing personal problems more difficult.
12 The p-value gives the probability that such a large difference in means would occur by chance if there were in fact
no difference in satisfaction between the two groups. A p-value of less than 0.01 means that there is less than a 1% chance that we would get this result, i.e. that it is very likely that there is a difference in satisfaction between the two groups.
13 For instance, pupils in workshops from mid-year to July score significantly worse on the baseline psychological
20 Table 7: Overall pupil satisfaction
Mean Std. Dev. N Min Max
Total satisfaction score 20.93 6.99 1432 9 45
Summary of total satisfaction score by pupil
characteristics Mean Std. Dev. N
Workshops lasting from September to July 21.77 7.05 754
Other workshops 19.99 6.81 678
p-value of mean-comparison test 0.00 Total 1432
Workshops lasted from September to mid-year 19.08 6.21 353
All other workshops 21.53 7.13 1079
p-value of mean-comparison test 0.00 Total 1432
Workshops lasted from mid-year to July 20.98 7.29 325
All other workshops 20.91 6.90 1107
p-value of mean-comparison test 0.89 Total 1432
Workshop frequency: less than one workshop per week 21.63 7.06 932
Workshop frequency: at least one workshop per week 19.62 6.68 500
p-value of mean-comparison test 0.00 Total 1432
Baseline depression score below the median (CDI<7) 19.79 6.69 663
Baseline depression score at or above the median (>=7) 22.04 7.08 658
p-value of mean-comparison test 0.00 Total 1321
Baseline anxiety score below the median (RCMAS<8) 20.23 6.93 628
Baseline anxiety score at or above the median (>=8) 21.47 7.00 693
p-value of mean-comparison test 0.00 Total 1321
Baseline life satisfaction score below the median (<35) 22.21 7.10 595
Baseline life satisfaction score at or above the median (>=35) 19.75 6.67 689
p-value of mean-comparison test 0.00 Total 1284
Baseline teacher behaviour score below the median (SDQ<4) 20.04 6.68 633
Baseline teacher behaviour score at or above the median
(>=4) 21.77 7.07 660
21 Table 8: Pupil perception of own problems
Q1: Since participating in UK Resilience Programme workshops, are your problems:
N Percent Cumulative %
Much worse 27 1.69 1.69
A bit worse 44 2.76 4.46
About the same 598 37.54 42
A bit better 592 37.16 79.16
Much better 332 20.84 100
Total 1,593 100
58% of pupils who answered question 1 said that their problems were either ‘a bit better’ or ‘much better’ (Table 8). These responses were again more common in those who started from a better baseline, i.e. with a score below the median on depression (63%), anxiety (62%), and behaviour (63%), and above the median on life satisfaction (63%). This compares to those above on the median on depression (53%), anxiety (55%), and behaviour (54%), and below the median on life satisfaction (52%), who reported that their problems were ‘a bit’ or ‘much’ better (cross tabulations not shown). It is difficult to interpret these responses, however, as without comparisons of the same question posed after other interventions it is not clear what a low, high or average response would be.14
Table 9:
Q3: I liked the UK Resilience Programme lessons a lot
N Percent Cumulative %
Agree a lot 413 26.46 26.46
Agree a little 618 39.59 66.05
Neither agree nor disagree 322 20.63 86.68
Disagree a little 127 8.14 94.81
Disagree a lot 81 5.19 100
Total 1,561 100
14 Approximately 100 pupils in the control group filled out the satisfaction questionnaire, with references to UKRP
22
Roughly two-thirds of pupils agreed to some extent that they liked lessons a lot (Table 9), and this is supported by many comments from both pupils and teachers about pupils’ enjoyment of lessons. Again, those who started from a worse baseline in terms of psychological well-being were significantly less likely to report that they enjoyed the lessons (p<0.01 for all psychological measures with the exception of the anxiety score). Nevertheless, in all the cross tabulations at least 60% of pupils said they enjoyed the lessons.15
For summaries of questions 4-11, please see Table 13 below.
Table 10: Perception of potential impact on academic attainment
Q15: I think what I learnt in the classes helps me with my schoolwork in general
N Percent Cumulative %
Agree a lot 282 18.31 18.31
Agree a little 468 30.39 48.7
Neither agree nor disagree 440 28.57 77.27
Disagree a little 160 10.39 87.66
Disagree a lot 190 12.34 100
Total 1,540 100
A slight majority of pupils did not agree with the statement that what they learned in UKRP classes helped them with schoolwork generally (Table 10). However, just under 49% of pupils did agree, and pupils’ characteristics were related to the probability that they agreed.
Interestingly, pupils with special educational needs relating to emotional, behavioural or social problems were more likely to agree that what they learned would help them with schoolwork (60%, as against 48% who did not have this type of SEN, see Table 11), although this is a small sample of pupils. Likewise, those who scored below the median on KS2 attainment were more likely to agree (52% as against 44% of those who scored at or above the median, Table 11). From a mean-comparison test on this item by SEN and KS2 attainment, we find that pupils who scored below the median at KS2 are significantly more likely to report that the programme helps with their schoolwork (p=0.002). Pupils with SEN are more likely to report this than those
without, but the difference between these two groups is less significant (p=0.038 for those with EBD SEN versus those without; p=0.019 for the difference in means between those with any SEN categorisation versus those without). Pupil comments provided on the surveys to explain this include: “because it helps me control my temper”; and, “because it stops me getting stressed with the teacher when I don’t understand”; as well as comments relating to avoiding
procrastination, not giving up, and gaining confidence in group work and in speaking out in class.
15 UKRP pupils were significantly more likely to say that they enjoyed UKRP lessons than control group pupils in the
23
Table 11: Perception of potential impact on academic attainment, by pupil characteristics Q15: I think what I learnt in the classes helps me with my schoolwork in general
Pupils without EBD SEN
without EBD SEN
(%)
Pupils with EBD SEN
with EBD
SEN (%) Total Percent
Agree a lot 265 18.15 17 21.25 282 18.31
Agree a little 437 29.93 31 38.75 468 30.39
Neither agree nor
disagree 424 29.04 16 20.00 440 28.57
Disagree a little 153 10.48 7 8.75 160 10.39
Disagree a lot 181 12.40 9 11.25 190 12.34
Total 1,460 100 80 100 1,540 100
Pupils with KS2 results below the
median
KS2 below median (%)
Pupils with KS2 results above the
median
KS2 above
median (%) Total Percent
Agree a lot 149 21.50 116 14.72 265 17.89
Agree a little 214 30.88 234 29.70 448 30.25
Neither agree nor
disagree 190 27.42 237 30.08 427 28.83
Disagree a little 65 9.38 93 11.80 158 10.67
Disagree a lot 75 10.82 108 13.71 183 12.36
Total 693 100 788 100 1,481 100
Table 12: Using the skills
Q17: Do you use any of the skills that you learnt in the classes?
N Percent Cumulative %
Yes 688 47.29 47.29
No 767 52.71 100
Total 1,455 100
If so, which UKRP skills do you use? Where and when do you use them?
N Percent Cumulative %
Pupil commented on how skills were used 713 43.77 43.77
Pupil did not comment on using skills 916 56.23 100
24
A slight majority of pupils said that they did not use the skills they learnt in the classes (Table 12). A large proportion of those who said that they did use the skills went on to make a comment about what they used, and/or how they used them. Curiously, more pupils made a comment about how they used the skills than ticked ‘yes’ in the first part of the question. The most popularly listed skills were negotiation, assertiveness, compromising, and the various in-the-moment emotion-management techniques (clenching muscles for a minute; counting to 10; deep breathing; and other relaxation or control techniques). The more strictly ‘cognitive’ skills were also mentioned (putting it in perspective; not catastrophising; breaking down a problem into the activating event, the beliefs around it and the consequences), but these were less common. Pupils most commonly reported that they used the skills at home and at school.
Summary
25
Table 13: Summary of other variables from pupil satisfaction survey
Q4: I've not learned anything from UKRP that has helped me solve problems
N Percent Cumulative %
Agree a lot 131 8.51 8.51
Agree a little 265 17.21 25.71
Neither agree nor disagree 283 18.38 44.09
Disagree a little 371 24.09 68.18
Disagree a lot 490 31.82 100
Total 1,540 100
Q5: I've learned a lot from UKRP that has helped me feel happier in my life
N Percent Cumulative %
Agree a lot 355 23.19 23.19
Agree a little 563 36.77 59.96
Neither agree nor disagree 355 23.19 83.15
Disagree a little 143 9.34 92.49
Disagree a lot 115 7.51 100
Total 1,531 100
Q6:I've not learned anything from UKRP that has helped me behave well
N Percent Cumulative %
Agree a lot 126 8.2 8.2
Agree a little 201 13.08 21.28
Neither agree nor disagree 420 27.33 48.6
Disagree a little 333 21.67 70.27
Disagree a lot 457 29.73 100
Total 1,537 100
Q7: I think my class teacher understood me
N Percent Cumulative %
Agree a lot 520 33.85 33.85
Agree a little 541 35.22 69.08
Neither agree nor disagree 305 19.86 88.93
Disagree a little 82 5.34 94.27
Disagree a lot 88 5.73 100
26 Table 13 continued
Q8: I think my class teacher helped me a lot
N Percent Cumulative %
Agree a lot 537 34.98 34.98
Agree a little 518 33.75 68.73
Neither agree nor disagree 284 18.5 87.23
Disagree a little 118 7.69 94.92
Disagree a lot 78 5.08 100
Total 1,535 100
Q9: I think the classes helped me get on better with my family
N Percent Cumulative %
Agree a lot 298 19.31 19.31
Agree a little 391 25.34 44.65
Neither agree nor disagree 480 31.11 75.76
Disagree a little 158 10.24 86
Disagree a lot 216 14 100
Total 1,543 100
Q10: I think the other pupils in my UKRP class understood me
N Percent Cumulative %
Agree a lot 333 21.62 21.62
Agree a little 516 33.51 55.13
Neither agree nor disagree 457 29.68 84.81
Disagree a little 124 8.05 92.86
Disagree a lot 110 7.14 100
Total 1,540 100
Q11: I liked my class teacher
N Percent Cumulative %
Agree a lot 660 42.86 42.86
Agree a little 464 30.13 72.99
Neither agree nor disagree 241 15.65 88.64
Disagree a little 87 5.65 94.29
Disagree a lot 88 5.71 100
27
6.
Facilitator Experiences of the Workshops
Workshop facilitators were asked to fill in a detailed questionnaire asking about their
experiences of the workshops; whether they thought they had had an impact on pupils; and whether they had benefitted personally from the experience. Of 86 facilitators trained in Philadelphia and planning to teach UKRP in the academic year 2007-08, 55 replied to the questionnaire. Of these, 50 had taught at least one workshop in a mainstream school and their classes therefore form part of the evaluation. Workshops outside of mainstream schools took place at special schools, or were set up specifically for looked-after children. We include
responses from all 55 facilitators in the following discussion because their experiences may shed further light on the experience of using the programme with groups of pupils underrepresented (though present) in mainstream schools.
It is worth stressing that we are not relying on facilitators’ responses to identify whether the programme has an impact or not. However, their opinions of how the programme went and what contributed to its success or failure in different places is instructive, particularly with respect to the mechanisms or ‘active ingredients’ of the programme.
Effect on facilitators
Over 90% of facilitators agreed to some extent that they enjoyed facilitating the workshops (see Table 14). Almost as many felt that the experience had improved their professional skills to some extent (89%). An open question asking what effect leading the workshops had had on the respondent (if any) gives more insight into this. 30 facilitators responded to this question, and the responses can be divided into eight general categories. The single most popular comment was that facilitators used the UKRP skills themselves, and some mentioned that they had become more optimistic or confident, with seven saying they had become more aware of their own emotions. In addition, five said they enjoyed workshops, five that they had become more aware of and sensitive to pupils and their problems, and three that they had had a chance to build closer relationships with pupils than their ordinary teaching allowed.
Facilitator perception of pupil experience
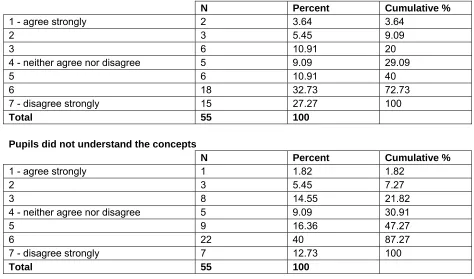
Only one facilitator did not agree (at least to some extent) that pupils had not enjoyed the workshops, and the same response was given to the statement “Pupils were generally engaged in workshops” (not shown). The one disagreement came from an LA officer working in a school, which may have contributed to a different atmosphere in the classes. Just over 70 % thought that pupils were generally supportive of each other in workshops, while 69% thought that pupils understood the concepts. Over 90% thought that pupils could apply the skills to their own experiences (see Table 15).
Effect on pupils
28
workshops would have an impact on pupils’ interactions with peers, teachers and parents, as well as an impact on their psychological well-being.
Table 14: Effect on facilitators
What effect has leading the workshops had on you (if any)?
N
Enjoyed workshops / they were fun 5
More aware of / sensitive to pupils and their problems 5
More aware of own emotions / more reflective 7
Built relationships with pupils 3
Use skills themselves 13
Built own confidence 5
Become more optimistic 2
Gained experience of group work 1
Total mentions 41
Total responses (number of facilitators) 30
Note: total mentions does not sum to 30 because some of the 30 respondents listed several ways the workshops had affected them.
I enjoyed facilitating UKRP workshops
N Percent Cumulative %
1 - agree strongly 23 41.82 41.82
2 25 45.45 87.27
3 2 3.64 90.91
4 - neither agree nor disagree 4 7.27 98.18
5 1 1.82 100
6 0 0 100
7 - disagree strongly 0 0 100
Total 55 100
I think that participating in UKRP workshops has improved my professional skills
N Percent Cumulative %
1 - agree strongly 21 38.18 38.18
2 22 40 78.18
3 6 10.91 89.09
4 - neither agree nor disagree 6 10.91 100
5 0 0 100
6 0 0 100
7 - disagree strongly 0 0 100
29
Table 15: Facilitators’ perceptions of pupil experience
Pupils enjoyed UKRP workshops
N Percent Cumulative %
1 - agree strongly 14 25.45 25.45
2 27 49.09 74.55
3 13 23.64 98.18
4 - neither agree nor disagree 0 0 98.18
5 1 1.82 100
6 0 0 100
7 - disagree strongly 0 0 100
Total 55 100
Pupils were not generally supportive of each other in workshops
N Percent Cumulative %
1 - agree strongly 2 3.64 3.64
2 3 5.45 9.09
3 6 10.91 20
4 - neither agree nor disagree 5 9.09 29.09
5 6 10.91 40
6 18 32.73 72.73
7 - disagree strongly 15 27.27 100
Total 55 100
Pupils did not understand the concepts
N Percent Cumulative %
1 - agree strongly 1 1.82 1.82
2 3 5.45 7.27
3 8 14.55 21.82
4 - neither agree nor disagree 5 9.09 30.91
5 9 16.36 47.27
6 22 40 87.27
7 - disagree strongly 7 12.73 100
Total 55 100
Pupils were able to apply the skills to their own experiences
N Percent Cumulative %
1 - agree strongly 8 14.55 14.55
2 26 47.27 61.82
3 17 30.91 92.73
4 - neither agree nor disagree 3 5.45 98.18
5 1 1.82 100
6 0 0 100
7 - disagree strongly 0 0 100
30
Table 16: Perception of effect on pupils’ psychological and social outcomes
I think that participating in UKRP workshops has improved pupils' psychological well-being
N Percent Cumulative %
1 - agree strongly 9 16.36 16.36
2 23 41.82 58.18
3 14 25.45 83.64
4 - neither agree nor disagree 8 14.55 98.18
5 1 1.82 100
6 0 0 100
7 - disagree strongly 0 0 100
Total 55 100
I think that participating in UKRP workshops has increased pupils' assertiveness
N Percent Cumulative %
1 - agree strongly 6 10.91 10.91
2 29 52.73 63.64
3 16 29.09 92.73
4 - neither agree nor disagree 4 7.27 100
5 0 0 100
6 0 0 100
7 - disagree strongly 0 0 100
Total 55 100
I don't think that participating in UKRP workshops will improve pupils' peer relations
N Percent Cumulative %
1 - agree strongly 2 3.64 3.64
2 4 7.27 10.91
3 3 5.45 16.36
4 - neither agree nor disagree 5 9.09 25.45
5 13 23.64 49.09
6 17 30.91 80
7 - disagree strongly 11 20 100
Total 55 100
I think that participating in UKRP workshops will help prevent bullying
N Percent Cumulative %
1 - agree strongly 4 7.27 7.27
2 17 30.91 38.18
3 23 41.82 80
4 - neither agree nor disagree 8 14.55 94.55
5 2 3.64 98.18
6 1 1.82 100
7 - disagree strongly 0 0 100
Total 55 100
(Effect on pupils continued)
31
the workshops would help prevent exclusion had replied quite positively to previous questions, so it is perhaps less likely that these responses were due to bad experiences or generally negative views of the workshops. About 64% of facilitators thought that the workshops would improve pupils’ academic attainment, with over 30% unsure. This is still a majority of facilitators, but is smaller than the proportion who believed that the workshops had an impact on pupils’ psychological well-being or social interactions.
Table 17: Perception of effect on pupils’ school outcomes
I don't think that participating in UKRP workshops will help prevent school exclusion
N Percent Cumulative %
1 - agree strongly 1 1.85 1.85
2 1 1.85 3.7
3 6 11.11 14.81
4 - neither agree nor disagree 8 14.81 29.63
5 19 35.19 64.81
6 15 27.78 92.59
7 - disagree strongly 4 7.41 100
Total 54 100