University of Southern Queensland
Faculty of Engineering and Surveying
Pump Gland Improvement Project
A dissertation submitted by
Damon Thomas Bishop
In fulfilment of the requirements of
Courses ENG4111 and 4112 Research Project
Towards the degree of
Bachelor of Engineering (Mechanical)
University of Southern Queensland
Faculty of Engineering and Surveying
ENG4111 & ENG4112
Research Project
Limitations of Use
The council of the University of Southern Queensland, its Faculty of Engineering and Surveying and the staff of the University of Southern Queensland do not accept any responsibility for the truth, accuracy or completeness of material contained within or associated with this dissertation.
Persons using all or any part of the material do so at their own risk, and not at the risk of the Council of the University of Southern Queensland, its Faculty of Engineering and Surveying or the staff of the University of Southern Queensland.
This dissertation reports an education exercise and has no purpose or validity beyond this exercise. The sole purpose of the course pair entitled “Research Project” is to contribute to the overall education within the student’s chosen degree program. This document, the associated hardware, software, drawings and other material set out in the associated appendices should not be used for any other purpose: if they are so used, it is entirely at the risk of the user.
Prof Frank Bullen
Dean
CERTIFICATION
I certify that the ideas, designs and experimental work, results, analysis and
conclusions set out in this dissertation are entirely my own effort, except where
otherwise indicated and acknowledged.
I further certify that the work is original and has not been previously submitted for
assessment in any other course or institution, except where specifically stated.
Damon Thomas Bishop
Student Number: 019222337
______________________________ Signature
______________________________
ABSTRACT
The need for this research project has arisen principally due to the economic cost incurred from poor reliability of a pump group within the Rio Tinto Alcan Gove Alumina refinery. This poor reliability issue concerns the glands on a pump group whose reliable operation is critical to the success of the business. This research project has identified the root cause of the problem and in turn provided a solution.
The Alumina industry relies heavily on slurry pumps to transport liquids and solids throughout the refining process. The failure of these pumps can significantly impact on a refineries ability to produce and consequently the reliability of the equipment is a major focus. Slurry pumps often utilise tradition stuffing box style glands to seal the wet end of the pump from the atmospheric and are usually the first part of a pump to fail. At the Rio Tinto Alcan Gove alumina refinery the mill injection pump group have been experiencing repetitive gland failures which have been costing the operation approx $12,000 per day. It is these pumps that the project has concentrated on.
The critical objectives of this research project include • Identification of the reliability project
• Identification of the root cause
• Proposal of a solution to mitigate the effect of the root cause. • Implementation of the solution.
To achieve these objectives several methodologies have been employed.
• Comprehensive review of production and maintenance cost associated with these pumps. • Literary review to examine past works involving pump gland on site and globally.
• Detailed failure investigation.
• Conducting of an Apollo root cause analysis to identify the root cause and provide the best solution to mitigate it.
• Implementation and validation of the solution.
ACKNOWLEDGEMENTS
Appreciation is given to the following groups for information and materials used in this project.
Rio Tinto Alcan Gove (RTAG)
Weir Warman Pumps
KSB Pumps Australia
TABLE OF CONTENTS
Page
Certification ………...….. 3
Abstract ………..… 4
Acknowledgements ………..…. 5
List of Figures ……….….. 10
List of Tables and Charts ………... 11
List of Appendices ………... 13
Nomenclature……….……..… 14
Chapter 1 – INTRODUCTION ……….…. 15
1.1Outline of the Study………... 15
1.2Introduction……….. 15
1.3The Problem……….…. 15
1.4Research Objectives……….…. 16
1.5Conclusions: Chapter 1……….…. 16
Chapter 2 – SAFETY REVIEW……….…. 18
2.1Safety Introduction……….….. 18
2.2Identify Hazards……….. 19
2.3Identifying Risks……….….. 19
2.4Controlling the Risks……….… 19
Chapter 3 – MILL INJECTION PUMP OVERVEIW………..…… 21
3.1Aims of the Chapter……….….…. 21
3.2Introduction………..…. 21
3.2.1 Location……….… 21
3.2.3 Purpose of Refinery……….….. 21
3.3Identification of a Reliability Project………... 24
3.4Mill Injection Group………..…. 27
3.4.1 Expansion of Refinery……….... 28
3.4.2 Pump Makes……….….. 28
Chapter 4 – LITERATURE REVIEW……….….. 31
4.1Aims of the Chapter…….………..…. 31
4.2Introduction to Centrifugal Pumps……….…… 31
4.3Introduction to Slurry Pumps……….…… 33
4.4Gland Configuration and Performance in Slurry Pumps……….…….. 35
4.5Gland Failure Characteristics……….… 36
4.5.1 Worn Shaft Sleeves……….…. 36
4.5.2 Poor Packing Material Selection………... 37
4.5.3 Incorrect Gland Water Supply……….…... 38
4.5.4 Incorrect Packing Installation……….… 38
4.5.5 Wrong Pump Application………... 39
4.5.6 Mechanical Fault……… 39
4.6Industry Methods in Improving Slurry Pump Gland Reliability…………... 40
4.6.1 Grooved Flow Restrictor Bushes……… 40
4.6.2 Live Loading on the Glands ……….. 40
4.6.3 Grease Purging of the Glands……….. 41
4.6.4 Stuffing Box Bearings……… 41
4.6.5 Slurry Packing……… 41
4.6.6 Mechanical Seals……….... 41
4.6.7 Stiffened Shaft Assemblies……….….. 42
4.7Previous Projects Concerning the Mill Injection Pumps………….…..…... 42
4.7.1 Gland Water Differential Project………... 42
4.7.2 Installation of a Grooved Flow Restrictor……….. 43
4.7.3 Repack MST………... 43
4.7.4 Mechanical Seal Installation………... 43
4.7.5 Slurry Packing Trial……… 44
Chapter 5 – DATA COLLECTION and ANALYSIS………...…… 45
5.1Aims of the Chapter…….………... 45
5.2Data Required………...…. 45
5.3Data………...……….… 47
5.3.1 Suitability of Shaft Sleeve………... 48
5.3.2 Suitability of Packing Selection ………..…… 48
5.3.3 Suitability of Gland Water Supply………..……. 49
5.3.4 Suitability of Pump To Application……….... 50
5.3.5 Mechanical Inspection on Gland Failure ……….……. 52
5.4Conclusions………..…… 52
Chapter 6 – APOLLO ROOT CAUSE ANALYSIS……….. 53
6.1Aims of the Chapter…….……….…. 53
6.2Incident Report………..……… 53
6.3Reality Chart………..… 54
6.4Solution Selection……… 54
6.5Solution Description………..………..… 56
6.6Conclusion……….……….. 58
Chapter 7 – SOLUTION IMPLIMENTATION AND VALIDATION……… 59
7.1Aims of the Chapter…….………..…. 59
7.2Mill Injection Shaft Upgrade Cost………. 59
7.3Acceptance From Refinery Management……… 60
7.4Plan for Installation………...….. 60
7.5Validation of the Project Six Months After Implementation………..… 62
Chapter 8 – CONCLUSION……… 64
1 Review of Project…….………..………..…. 64
8.1.1 ………..… 64
8.2Further Work to Complete Project………..……… 65
8.3Further Benefits and Opportunities………. 66
8.4Closing………...….… 67
REFERENCES………..…… 68
LIST OF FIGURES
Figures
Number Title Page
3.1 Northern Map of Northern Territory………..… 21
3.2 Arial View of Rio Tinto Gove Alumina Refinery………..….. 22
3.3 Process Diagram of the Bayer Process……….…..… 23
3.4 Mill Injection Group Schematic……….….….. 28
3.5 Mill Injection Group Pumps………..……… 29
3.6 D Group Pumps……….……… 30
4.1 Pump Dynamics……….……… 32
4.2 Flow Curve………..……... 33
4.3 Slurry Pump Parts List……….…. 34
4.4 Stuffing Box Configuration……….…….. 36
5.1 Shaft Sleeve Condition after 10 days operation……….. 47
5.2 Shaft Sleeve Condition after 77 days operation……….…………. 47
5.3 Packing after 5 days run time ……….……… 48
5.3 Packing After 21 days run time………..…… 48
5.5 Gland Water Pressure……….………..….. 49
6.1 Existing Shaft Assembly………...…… 56
6.2 Stiffened Shaft Assembly……… 56
7.1 New Assembly in Box………...… .. 61
LIST OF TABLES and CHARTS
Tables
Number Title Page
1.1 Time Line for Completing Research Project Milestones……….…… 17
2.1 Likelihood / Consequence Matrix……….….. 18
2.2 Risk Control Table……….……. 19
2.3 Hierarchy of Control……….…….. 20
3.1 Exert from Production Loss Report……….…… 24
5.1 Data Collection Plan……….. 46
6.1 Incident Report………..….... 53
6.2 RCA Team………. 54
6.3 Summary of Root Causes……….. 54
6.4 Solution Generated From RCA……….………… 55
6.5 Solution Assessment……….… 55
6.6 KSB Pump Deflection Calculation………..….. 57
7.1 Cost For Project………. 59
7.2 NPV……….…….. 60
Charts
Number Title Page
3.1 Total Pump Losses ………. 25
7.2 Mill Injection Pump losses by Failure Mode……….. 25
3.3 MTBF for selected Refinery Pump Groups………...…. 26
3.4 Repack Events on the Mill Injection Group ………..………. 26
4.1 Mill Injection MTBF………...… 42
5.1 Flow Curve for 6-8 LSA-25 ………..…. 50
5.2 Stage 1 and 2 Mill Injection Flows for a 1 Month Period………….….. 51
5.3 Calculated pump Shaft Deflection for the 1 Month Period………. 51
6.1 Calculated Shaft Deflection With Stiffened Assembly ………..…...…. 57
7.1 Comparison of MTBF for P633-4B Before and After Shaft Upgrade.... 63
LIST OF APPENDICES
Number Title Page
A Project Specification……….… 69
B Industry Products to improve Gland Reliability………....…… 70
C Previous Improvement Projects……….………...……. 73
D Gland Water Requirements for Slurry Pumps……….….. 76
E Shaft Deflection Calculations……….…….….. 77
F Mechanical Inspection Reports……….….... 80
G Reality Chart Summaries………..…. 84
H Letter of Offer concerning Stiffened Shaft Assemblies…………..……….…. 91
I Power Point Presentation to Management ……… 94
NOMENCLATURE
Reliability- the probability that a device will
perform its intended function during a
specified period of time under stated
conditions.
Utilisation - Utilisation is a measure of the
time that the plant is utilized, albeit
productively or non-productively.
(Operating Time / Calendar Time)
Availability - Availability is a measure of
the time that plant and equipment is
available to perform its intended function
over a defined period. (Available Time /
Calendar Time)
MTBF - is used to quantify the reliability in
operation of equipment. (Utilised Time /
Number of Failures)
SFL – Strong Feed Liquor
Scat – A worn segment of Mill Rod or Ball.
NPSHr – Net positive suction head
requirements for a specific pump to run with
adequate suction pressure and avoid
cavitations.
BEP – The best efficiency point (BEP) is
the flow rate where a pump has its highest
efficiency.
Head – Liquid force measured by elevation.
P.P.E – Personnel Protection Equipment
EHS – Environment, Health and Safety
MST – Maintenance Scheduled Task
CHAPTER 1
INTRODUCTION
1.1
Outline of the Study
The need for this research project has arisen principally due to the economic cost incurred from
poor reliability of a pump group within the Rio Tinto Alcan Gove Alumina refinery. This poor
reliability issue concerns the glands on a pump group whose reliable operation is critical to the
success of the business. Previous projects which have been carried out with the aim of improving
the gland reliability have had little success. Additionally there is often frequent discussion within
the Alumina industry concerning pump gland reliability and the lack of resources that
specifically target slurry pumps glands as opposed to “clean fluid” pumps. The intention and
scope of this project is laid out in 1.4 Research Objectives.
1.2
Introduction
Whilst the field of Reliability engineering is not new there has been a relatively recent escalation
on its importance which has been born out of the need for industry to maximise their return on
their investment in their equipment. Equipment failure can impact a business in many ways such
as production loss cost, maintenance costs and environment, health and safety and therefore the
solution to preventing these failures can yield valuable proceeds. To find the optimum solution
the root cause will need to be understood.
1.3
The Problem
The Alumina industry relies heavily on slurry pumps to transport liquids and solids throughout
the refining process. The failure of these pumps can significantly impact on a refineries ability to
produce and consequently the reliability of the equipment is a major focus. Slurry pumps often
utilise tradition stuffing box style glands to seal the wet end of the pump from the atmospheric.
Pump glands often are usually the first part of a pump to fail and often are merely symptom of a
bigger issue within the pump or the process of which the pump is subjected. This research
project will examine a gland failure issue and attempt to produce a solution which will in turn
1.4
Research Objectives
The critical objective of this research project is to identify a reliability project, isolate the root
cause and propose a solution to mitigate the effect of the root cause.
The format of this project will be closely aligned with the project specification (Appendix A). To
ensure that the project meets all poignant completion dates a plan has been step up so as to track
the progress (Table 1.1).
1.5
Conclusions: Chapter 1
The results of this study is expected to demonstrate a problem solving methodology which
enables the reliability engineer to solve a problem with an unknown solution.
The background and literature review will consist of a review of Slurry pumps, principally
focusing on the gland composition, failure modes and performance and provide background in
the equipment reliability issue which the project is involved. This will assist in the identification
Active Due Inactive
Week 1 Week 2 Week 3 Week 4 Week 5 Week 6 Week 7 Week 8 Week 9 Week 10 Week 11 Week 12 Week 13 Week 14 Week 15 Week 16 Week 17
28-Feb 7-Mar 14-Mar 21-Mar 28-Mar 4-Apr 11-Apr 18-Apr 25-Apr 2-May 9-May 16-May 23-May 30-May 6-Jun 13-Jun 20-Jun
Due
Due
Week 1 Week 2 Week 3 Week 4 Week 5 Week 6 Week 7 Week 8 Week 9 Week 10 Week 11 Week 12 Week 13 Week 14 Week 15 Week 16 Week 17
19-Jul 26-Jul 2-Aug 9-Aug 16-Aug 23-Aug 30-Aug 6-Sep 13-Sep 20-Sep 27-Sep 4-Oct 11-Oct 18-Oct 25-Oct 1-Nov 8-Nov
Due
Due
Due
Research slurry pump sealing in industry (preferably the Alumina industry) with respect to designs, performance and reliability.
Time Line for completion of Research Project milestones (Mill injection gland reliability project)
Start of Week
Build Document Shell
Develop timeline to Complete Project
Project Specification Submission
Read Project Reference Book
Start of Week
Read Project Reference Book
Project Proposal Submission
Commence developing potential solutions Analysis the field data for the purpose of isolating the root cause or causes.
Project Appreciation Submission
Develop an evaluation plan for the collection and monitoring of historical and current data concerning the gland performance on the mill injection pumps. Collect and analysis the data concerning the “cost to the business” that have resulted in the mill injection pumps poor gland performance.
Investigate previous improvement projects which have been previously performed on this pump group
Perform Root cause Analysis (Write up report) Develop timeline to Complete Project
Complete Mathamatical analysis to validate solution (Write up report)
Obtain costing reports to impliment solution (Write up report)
Submitt Complete Project
Submitt Extended Abstract and Work Experience
Present solution to management (Write up report) Impliment solution (Write up report)
Validate solution (Write up report)
Draft Submission Submitted
CHAPTER 2
SAFETY REVIEW
2.1
Safety Introduction
An Alumina refinery is an inherently a dangerous place, the caustic which is used to dissolve the
alumina also reacts with human tissue essentially dissolving it. The product is pumped at
temperatures of over 200ºc and pressures of over 4000kPa. This makes any incident where the
exiting of the product from the system into the atmosphere potentially a dangerous one. The
process that is required to be followed in order to manage these risks in the refinery which is
found in the EHS procedural manual is essentially simplified as
• Identifying the Hazard
• Identifying the Risk
• Placing controls to manage the risk
The Likelihood / Consequence matrix (Table 2.1) is a widely used tool which enables risk to be
categorised with the intent of determining the level of control required.
Consequence Likelihood
1 - Minor 2 - Medium 3 - Serious 4 - Major 5 - Catastrophic A - Almost
Certain
Moderate High Critical Critical Critical
B - Likely Moderate High High Critical Critical
C - Possible Low Moderate High Critical Critical
D - Unlikely Low Low Moderate High* Critical
E - Rare Low Low Moderate High* High*
[image:18.595.51.539.503.712.2]2.2
Identifying Hazards
Pump gland failures often result in the product exiting the stuffing box region of the pump under
high pressure. This presents a hazard particularly when the product is caustic slurry at 105 ºc. In
the event of a human to be in the vicinity of a sudden gland failure a realistic consequence would
range from a minor chemical / thermal burn to a serious chemical / thermal burn which would
result in a loss time injury. This identifies a hazard with a serious consequence if nothing is done
to control it.
2.3
Identifying risks
To quantify the hazard so appropriate controls can be in place the Likelihood / Consequence
matrix is used (Table 2.1) this compares the severity of the hazard with likelihood of it occurring.
Fortunately glands typically fail gradually therefore while the hazard is potentially serious the
likelihood of it occurring would be unlikely. Therefore the risk can be classified as moderate.
2.4
Controlling the RiskTo manage a moderate risk Table 2.2 is referred to. Table 2.2 suggests that the risk can be
managed through control which routine monitoring of the effectiveness of these controls and
periodic review.
Residual Risk Rating
Tolerability Action Message
Critical Intolerable Significant and/or urgent action is required to eliminate or reduce the risk level. Area Superintendents must allocate resources and review the risks. Consider Quantitative risk assessment.
High Intolerable Develop a Risk Reduction Plan to eliminate or reduce the risk to a tolerable level. Consider Hierarchy of Controls and ALARP (as low as reasonably practicable) principles.
Moderate or Low Tolerable Maintain controls, and ensure risks are periodically monitored and reviewed.
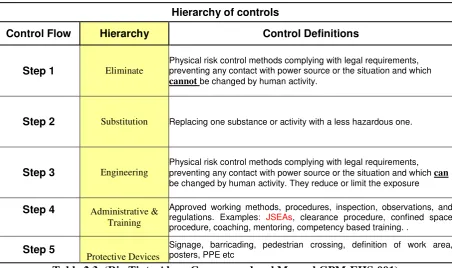
In Table 2.3 the preferred selection of controls process is illustrated. This enables the most
optimum and practical control to be put in place.
Hierarchy of controls
Control Flow Hierarchy Control Definitions
Step 1 Eliminate
Physical risk control methods complying with legal requirements, preventing any contact with power source or the situation and which
cannot be changed by human activity.
Step 2 Substitution Replacing one substance or activity with a less hazardous one.
Step 3 Engineering
Physical risk control methods complying with legal requirements, preventing any contact with power source or the situation and which can
be changed by human activity. They reduce or limit the exposure
Step 4 Administrative & Training
Approved working methods, procedures, inspection, observations, and regulations. Examples: JSEAs, clearance procedure, confined space procedure, coaching, mentoring, competency based training. .
Step 5
Protective Devices
Signage, barricading, pedestrian crossing, definition of work area, posters, PPE etc
Table 2.3. (Rio Tinto Alcan Gove procedural Manual GPM-EHS-001)
In the case of the Rio Tinto Alcan Gove refinery the following protocol is to be followed when
working in and around online pumps.
• Perform relevant inductions – Visitor is aware of potential dangers and what to do if they
are encounter. I.E. Safety shower location, Radio channels, ECT.
• Seek permission from operation before entering the area – This will enable
communication of any hazard so the visitor is aware.
• Perform a personnel hazard assessment upon entering the area to ensure all is safe.
• Gland guards are to be in place – This will divert any product which exits the stuffing box
towards the ground.
• PPE to be worn – In the case of an incident some protection will be given.
• Area to be barricaded in the event of a gland failing.
With these controls in place the risk is now understood to be managed and allow safe access for
[image:20.595.72.525.144.412.2]CHAPTER 3
MILL INJECTION PUMP OVERVEIW
3.1
Aims of the Chapter
The specific aims of this chapter are to:
• Provide an introduction to the Rio Tinto Gove Alumina refinery, its location, function and
the Bayer process.
• Provide the justification for the reliability issue concerning this research project.
• Explain the purpose and composition of the Mill injection pump group
3.2
Introduction
3.2.1. Location
The Rio Tinto Alcan Gove Bauxite Mine Alumina Refinery is situated on the Gove Peninsular in
the N.E region of Arnhem Land in the Northern Territory next to the purpose built town of
[image:21.595.172.424.410.591.2]Nhulunbuy.
Figure 3.1. (http://www.sailing-story.com/images/darwin-nhulunbuy-map.jpg, 17/05/2010)
3.2.2. Refinery Function
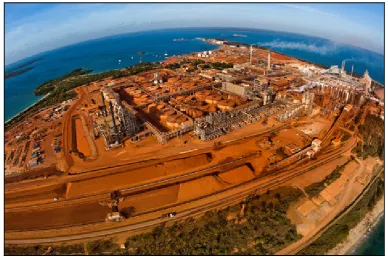
The refinery which was first commissioned in 1972 utilises locally mined bauxite to produce
Alumina. The refinery is currently producing 3 million tonnes of Alumina per annum which
(http://en.wikipedia.org/wiki/List_of_alumina_refineries). The refinery extracts the Alumina
[image:22.595.103.492.144.401.2]from the Bauxite using the Bayer Process.
Figure 3.2. (http://www.riotintoalcan.com/ENG/resources/image_library_1456.asp,
17/05/2010)
3.2.3. Bayer Process
At the Gove refinery the Bayer process (See Pictured) achieves it purpose through the following
process.
• Bauxite is strip mined (6.8 million tonnes annually), crushed to <25mm and loaded on a
system of conveyors which deliver the ore to the refinery stockpiles 18km away.
• The Bauxite is reclaimed and delivered into the mills where the dry bauxite is blended
with a Caustic solution then ground to a fine paste. It is here that the extraction of the Alumina
from the bauxite begins as the caustic dissolves the alumina.
• The caustic slurry is then feed through a series of pressure vessels and heat exchangers to
allow the maximum absorbsion of alumina from the bauxite.
• The slurry is then separated into two streams where the mud solids are sent out to the
residue disposal and the alumina rich “liquor” is feed through filtration and into the “white side”
• In the white side the liquor is allowed to cool and then passed through a series of filters
so as to extract the hydrated (wet) alumina.
• The hydrate is then conveyed to calcinations where the hydrate is passed through fluid
bed calciners. At +1000c the kilns remove all bonded water to produce a dry alumina
[image:23.595.96.495.227.447.2]ready for export.
Figure 3.3. (http://www.redmud.org/images/0.C2.gif, 15/05/2010)
To perform the Bayer process the refinery relies on large volumes of caustic slurry and liquor to
be transported through an extensive and complex piping system. To achieve this, the refinery has
dedicated approximately 400 of its approximate 1000 pumps to pump product in various forms
throughout its piping network.
Due to the dependence of the process on slurry pump performance poor performance can have a
significant impact on the output of the refinery. When an event occurs though poor performance
3.3
Identification of a Reliability Project
Production targets for the refinery are forecast on a daily basis. When the refinery fails to
achieve the targeted tonnage rates the events which led to the short comings are tabled and
published as the daily production loss reports. These reports identify the production loss event.
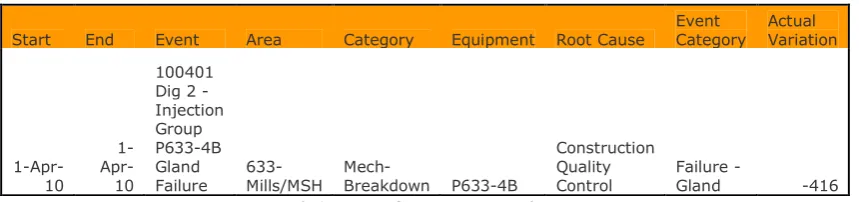
Table 3.1 displays an exert of an event from the Production Loss report.
Start End Event Area Category Equipment Root Cause
Event Category Actual Variation 1-Apr-10 1- Apr-10 100401 Dig 2 - Injection Group P633-4B Gland Failure 633-Mills/MSH
Mech-Breakdown P633-4B
Construction Quality Control
Failure -
[image:24.595.69.499.208.309.2]Gland -416
Table 3.1 Exert from Production Loss report
These losses are reviewed weekly by the Reliability engineering team which uses the data to
highlight the areas where the equipment reliability is performing poorly. Projects are then
developed using this data. Pumps which make up the lions share of the rotating equipment on
site can and often do feature heavily in the production reports and hence numerous projects
concerning pumps are developed for the Pump reliability engineer to work on.
One pump group in particular has continued to dominate the production loss reports and on
reference to Chart 3.1 it is evident that the mill injection group has been the number one
contributor to production losses for pumps in the time period measured. These losses total 34,500
tonnes which equates to $10,350,000 @ $300 per tonne of alumina (2010-04-16 spot price of
Total Pump losses 01/01/2008 - 01/04/2010 0 5,000 10,000 15,000 20,000 25,000 30,000 35,000 40,000 Mill Inje ctio n G
roup
Geh o Pu
mp grou
p
Liqu or In
ject ion Gro up Mill Slu
rry D isch
arge
Stg 3 IS
C P um
ps
Stg 1 &
2 IS C S
lurry Pum ps Mud Inje ctio n G
roup
Stg 1 &
2 IS C W
ater Pum
ps
Mill Slu
rry H eatin
g
De Wat
erin g P
ump Gro
up
HTD Dilu
te S lurry Gro up SFL Feed Gro up LTD Pur
e C onde
nsat e G
roup Coa rse Seed Ret urn Pum ps Cla rifie
r Und erflo
w P ump
Gro up
Evap Con
dy P um
p G roup SFL Boo ster Gro up Inst rum
ent P urge
Wat er
Turb id L
iquo r gro
up
HR D U
nder flow
Stg 3 C
ondy Ret urn Gro up Stg 1 an
d 2 Pro
cess Con
dy G roup
DC W U
nder flow s LTD Pro cess Con dens ate Gro up TCA Pum
p gr oup
Pres sure
Dec ante
r Ove rflow Gro up HTD Pro cess Con dens ate Gro up Pres sure Dec ante
r Fee d G
roup
Cyc lone
Und erflo
w P ump
Gro up
Chart 3.1 Pump Losses for all groups
High production losses are not the only indicator of high cost equipment in the refinery. Further
examination of the process loss reports reveals that the of the 34,500 tonnes of alumina losses
attributed to the Mill injection group 99.3% of them relate to Gland failures and 0.7% are
attributed to Drive belt failures.
Mill Injection Pumps Losses by Failure Mode (Tonnes of Alumina)
-208 -31306 Belts Gland Failures Chart 3.2
Using the MTBF calculation of (Run Time/Failure count) for a given time period the MTBF can
M TBF for se lecte d refine ry pum p groups 0 20 40 60 80 100 120 Mill Injection Group
Stage 3 Inter Stage Cooling Pumps Liquor Booster Pumps Liquor Injection Pumps Mill Slurry Pumps R u n T im e ( D a y s ) Chart 3.3
The results pictured in chart 3.3 displays the fact that the mill injection group have one of the
lowest MTBF for glands on site and coupled with their high availability requirements (4 groups
feeding three stages) lead to why the Mill injection group feature so heavily on the production
loss reports.
This low MTBF not only cost the business in lost production tonnes but also contributed to high
maintenance expenditure. An examination of the maintenance record associated with this pump
group shows that from the period of 01/01/2007 there were 207 gland repack events carried out
(see Chart 3.4). At an average labour rate of $100.00/hr and using an average of $600.00 worth
of materials the total maintenance cost to perform a 4 hour repack for each gland failure event is
$207,000 or $2000 on a weekly basis.
Repack events on the Mill injection group since 01/01/2007
0 5 10 15 20 25 30
Q1 2007 Q2 2007 Q3 2007 Q4 2007 Q1 2008 Q2 2008 Q3 2008 Q4 2008 Q1 2009 Q2 2009 Q3 2009 Q4 2009 Q1 2010
Another important fact to be gleaned from the chart is the fact that the occurrence of gland
failures has remained fairly stable over the last several years this indicates that there has been no
real improvement in MTBF.
With the data which has been presented the following summarisation can be made.
The Mill injection Gland failures are currently costing the refinery approximately $13,000
dollars per day in production losses. (2010-04-16 spot price of Alumina from LME) and
maintenance costs. The successful completion of this research project concerned with
identification of the root cause and implementation of a solution would give significant return on
the invested time and energy by the reliability engineer.
3.4
Mill Injection Group
Mill Injection Pumps transport caustic slurry from the Mill relay tanks to the Low temperature
digesters in stage 1, 2 and 3. Due to the elevation of the digesters and the pressures associated
within the vessels the discharge pressure of the pumps need to be in the vicinity of 2000 kPa.
This is achieved by having two pumps in series. One pump operates as the low pressure pump
and feeds slurry to the high pressure pump. For the three stages to maintain flows there are 4
individual pump groups A, B, C and D. This provides redundancy in the system in the case of a
pump group requiring maintenance so as not to affect flows. In the event two pump groups
experience a mechanical or electrical failure flow cuts to a stage will be experienced which will
then be recorded as a production loss.
The pumps are identified using the site standard equipment identification.
A GROUP – Low pressure pump P633-4A, High pressure pump P633-5A
B GROUP - Low pressure pump P633-4B, High pressure pump P633-5B
C GROUP - Low pressure pump P633-104C, High pressure pump P633-105C
D GROUP - Low pressure pump P633-304D, High pressure pump P633-305D
• P – equipment type (Pump)
• 633- Area of refinery equipment is found
• 4 – Low pressure, 5 – High Pressure
Figure 3.4. (Mill injection group schematic. Obtained from Process book)
3.4.1 Expansion of Refinery
In 2007 the refinery underwent an expansion where a third stage was built. To accommodate this
the mill injection pumps was increased by another group (D).
The consequence of the expansion meant that instead of three groups feeding two stages – which
required 66% utilisation it then required that 4 groups feed three stages which requires 75%
utilisation. This increased the reliability requirements of the pump groups.
3.4.2 Pump Makes
A, B and C Group. Comprises of three K&L 6X8 LSA25 on the low pressure side and three
K&L 6X8 LSA25 HP on the high pressure side.
K&L refers to the pump manufacturers (Kelly and Lewis), 6 x 8 refers to the discharge and
suction pipe size respectively (inches), LSA refers to slurry application , 25 refers to the impeller
diameter size (25 inches) and HP refers to high pressure application.
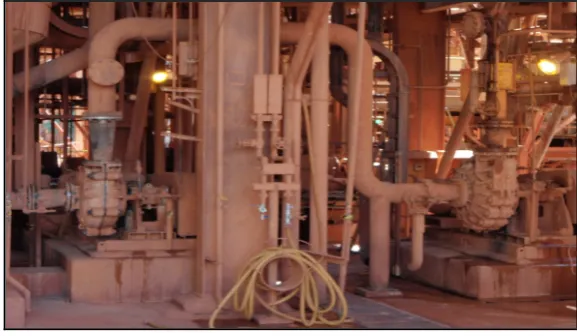
Figure 3.5. Mill Injection Pumps (note the steel shroud over the pump which acts as a safety guard in the event of a scat from the mill enters the pumps and causes catastrophic failure)
These pumps have been in service since 1972 (Plant commissioning) and are generally subjected
to the following conditions
• Maximum Flow – 366m3/hr
• Normal Flow – 340m3/hr
• Minimum Flow – 206m3/h
• Slurry SG – 1.824 / Solids SG – 2.4 / Liquid Density – 1.3 / Concentration – 54.8%
On the low pressure side the pumps are driven by a fixed speed 160kw AC motor the power is
transferred through a reduction belt drive and delivered to the pump at 811rpm. The high
pressure pumps are similar except for the fact that a variable speed fluid drive is utilised between
the motor and the v-belt pulley this enables the High pressure pump to regulate its discharge
D Group. Comprises of a Warman 6x8EE - AH on the low pressure side and a Warman
6x8FF-AHP on the high pressure side. Warman refers to the manufacturer (Weir Minerals), 6 x 8 refers
to the discharge and suction pipe size respectively (inches), EE or FF refers to the frame size
(Bearing cartridge) respectively and AH indicates that is for an abrasive heavy duty slurry
application and the P indicates high pressure.
These pumps have been in service since 2007 (3rd stage commissioning) and are generally subjected to the following conditions (same as A, B and C group)
• Maximum Flow – 366m3/hr
• Normal Flow – 340m3/hr
• Minimum Flow – 206m3/h
• Slurry SG – 1.824 / Solids SG – 2.4 / Liquid Density – 1.3 / Concentration – 54.8%
On the low pressure side the pump is driven by a fixed speed 185 kW AC motor, power is
transferred through a reduction belt drive and delivered to the pump at 1028rpm.The high
pressure pump is identical except for the fact that the motor is controlled by a VSD. This way the
speed as with the A, B and C group the speed can be regulated to control pressure to the
[image:30.595.152.441.445.613.2]digesters.
Figure 3.6. D Group Pumps
This pump group forms a critical part of the refinery. The unplanned failure of these pumps
immediately limits the ability of the refinery to make alumina which then leads to loss of
CHAPTER 4
LITERATURE and BACKGROUND REVEIW
4.1
Aims of the Chapter
The specific aims of this chapter are to:
• Research the basic features of a centrifugal pump.
• Describe the unique features of Slurry Pumps
• Provide a description of pump glands their composition and purpose.
• Research failure modes concerning pump glands
• Outline current industry methods in improving slurry pump gland reliability
• Indentify previous work or reliability projects which have been carried out on the mill
injection pump glands.
• Provide an evaluation of the information researched.
4.2
Introduction to Centrifugal Pumps
Pumps are used to transfer liquids from low-pressure zones to high-pressure zones (Bachus,
2003, p.1). To do this effectively the liquid needs to be at the suction of the pump at a required
pressure so the pump can work with the fluids attributes. Centrifugal pumps cannot draw fluid
into the housing.
P1/γ + v1²/2g+ Z1 = P2/γ + v2²/2g+ Z2= P3/γ + v3²/2g+ Z3
Bernoulli’s Equation
The principal components in a pump which gives it the ability to transfer liquids is the volute and
the impeller. The impeller rotates on a shaft and allow liquid to enter its eye (See Figure 4.1).
The liquid then travels along the impeller vanes and is accelerated towards the outside of the
impeller. Following Bernoulli’s equation this creates a low pressure zone at the eye of the
impeller due to the increase in velocity. When the fluid reaches the end of the impeller the
velocity rapidly decreases which increases the pressure. Due to the positioning of the impeller
and the shape of the volute the fluid is then forced along a path by the impeller and direct
towards the discharge. As the fluid travels around the volute the velocity decreases due to the
This pressure differential that has developed between the suction and the discharge now allows
[image:32.595.101.496.184.394.2]the liquid to be transported through a piping system at a specific flow rate with a specific head.
Figure 4.1 Pump Dynamics (Bachus, 2003, p.3)
On the manufacture of a pump impeller, designers will subject the impeller to hydraulic testing,
this testing involves the flows produced by the impeller gradually being restricted until flow shut
off is achieved. The data which includes flow rates, power consumption, discharge and suction
heads is collected and presented on what is known as a flow curve (see Figure 4.2), Each
impeller design has its own flow curve and enables engineers to design a pumping system to
match the flow and pressure requirements. In the interest of efficiency it is always preferable to
run the pump as close to the best efficiency point as possible. The B.E.P is the point where the
power coming out of the pump (water horse power) is the closest to the power coming into the
pump (brake horse power) from the driver. This is also the point where there is no radial
deflection of the shaft cause by unequal hydraulic forces acting on the impeller.
Figure 4.2 Flow Curve (McNally Institute 2-3)
4.3
Introduction to Slurry Pumps
Slurry pumps are used to transport solids in a liquid medium. The solids may consist of bauxite,
silica and other minerals which can be up to10mm in diameter and are highly abrasive. This
aggressive application challenges traditional “clean fluid” pump technologies and has forced
pump manufacturers to incorporate numerous design changes into their components to perform
the duty as per requirements. The changes include the following.
• Usage of high chromium alloys “white iron” to resist abrasive wear in the wet end
components.
• Greater wall thickness’s in the wear components.
• Greater internal clearances concerning the impeller to throat bush (reduced Efficiency)
• Greater use of packing as opposed to mechanical seals for pump sealing.
• Different pump stuffing box configurations as opposed to clean homogenous solution
pumps.
• Greater shaft rigidity.
• Larger bearing sizes to accommodate bigger loads.
• Blunt tipped impellers.
• Lower number of vanes used in the impeller.
• Pump run at a lower speeds
Figure 4.3 (Obtained from a Warman parts guide for an 8/6 FF-AHP High Pressure Slurry
[image:34.595.53.541.98.697.2]4.4
Gland Configuration and Performance in Slurry Pumps
The stuffing box houses the packing assembly and is located where the shaft penetrates the
casing that is under pressure. In slurry pump applications the stuffing box is bolted to the casing.
The stuffing box bore is concentric to the shaft sleeve and of a specific size so as to
accommodate rings of packing (Volk. 2005, p334).
Compression packing is most commonly used on rotating equipment. The seal is formed by the
packing being squeezed between the inboard end of the stuffing box and the gland. A static seal
is formed at the ends of the packing rings and the inside diameter of the stuffing box. The
dynamic seal is formed between the packing and the shaft sleeve. (Karassik et al. 1986, p2.114).
Seal water should be available at 10 psi (0.7 bar) above maximum pump discharge pressure.
(LSAS Technical Booklet).
A negative attribute associated with this type of sealing is the fact that it allows considerable
water into the wet end of the pump which dilutes the product. In the Alumina industry water
ingress into the slurry reduces the yield and means that the water will have to later be extracted
through either the evaporation or calcination process. Therefore it is important to run the gland
water to an optimum level.
There are essentially two different stuffing box configurations that can be utilised by slurry
pumps (See Figure 4.4).
• Low flow version is the most common in the alumina industry as it requires the least
gland flush to work effectively.
• Forward flush configuration tends to be used more in high pressure pump applications
(+2000kPa) due to a tendency for the packing to be extruded through the clearance of the
shaft sleeve and stuffing box by the high pressure gland water which is turn on before the
pump is started and pressurised. In this case water forms a barrier between the slurry and
Figure 4.4 Stuffing Box Configurations (Obtained by LSA Technical Book from GIW)
These two configurations are the most common method of sealing slurry pumps, mechanical
sealing is used widely however unless conditions are stable and the pump is allowed to run close
to its design, problems often arise and expensive repairs can occur. Stuffing box type sealing
provides a more robust configuration and is able to operate effectively under a broader range of
conditions.
4.5
Gland Failure Characteristics
The following points discuss common modes of failures for pump glands. The research into this
will enable a better understanding and assist when identifying the root cause of failure
concerning the mill injection pumps.
4.5.1 Worn Shaft Sleeve
o Stuffing box shaft sleeves are surrounded in the stuffing box by packing: the sleeve
must be smooth so that it can turn without generating heat (Karassik et al. 1986,
p2.117).
o For packing to operate properly, the finish on the shaft sleeve must be at least 0.4µ
m). The sleeve must be harder than the packing and chemically resistant to the liquid
being sealed. (Karassik et al. 1986, p2.117). Packing rings
o For pumps subject to slurry the surface must be hard so as to resist wear, chromium,
tungsten carbide and ceramic and some of the materials used for severe service. If the
sleeve has a coated material for a hard wearing surface, the sleeve must also have
good thermal shock. (Karassik et al. 1986, p2.116).
Research into shaft sleeves suggests that the material of construction is critical to its ability to
resist wear. In the case of the Gove alumina refinery the type of pump which is used in the mill
injection area is also used many other applications some being considerably less severe in
application than the mill injection pumps. The same shaft sleeve material is in installed into
everyone of the pumps. This material while being suitable for most of the applications may not
be suitable in the mill injection area.
4.5.2 Poor Packing Material Selection.
Packing requires a number of attributes to work effectively. The correct balance of these
attributes is required for the optimum reliability to be achieved, the attribute are as follows
o Conformability – The ability for the packing material to adapt to its volumetric
constraints and provide an effective seal.
o Lubricity – The packing is impregnated with lubricant (usually graphite) it needs to
be able to retain it so as or start up it won’t over heat.
o Low coefficient of expansion – As the pump shaft speed increases so does the
temperature. The packing needs to expand as little as possible.
o Braid construction – Different weaving configuration can affect the packings ability
to retain its shape during operation.
o Low abrasiveness – Material needs to be soft enough so as not to wear the shaft
sleeve
o Ease of installation – The easier the packing is to install the less likely failure will be
result
(http://www.impomag.com/scripts/ShowPR.asp?RID=7811&CommonCount=0, Al Guizzetti,
Having many attributes selecting the correct packing is about finding the right balance of
qualities to suit the application. At the Gove alumina refinery there are two pump packing types
used. This packing material has been deemed suitable to work in a wide range of applications
from acid service, clean fluid and slurry. The definition of suitable needs to be investigated
4.5.3 Incorrect Gland Water Supply
o Under pressure – Slurry will force its way underneath the packing quickly abrading
the packing undermining its ability to form a seal.
o Over pressure – Gland water will extrude the packing through the clearance between
the shaft sleeve and the stuffing box into the wet end of the pump.
o Low flows – An important function of gland water is to remove heat from the stuffing
box. Excessive heat build up will burn the packing.
o Poor gland water quality – Impurities in the gland water can block piping restricting
the flow or impregnate the packing undermining its ability to seal.
o The quality, quantity and pressure of this gland sealing water is of prime importance
and must be carefully matched to the duty required.
(Slurry Pump Handbook. 2009, P2-12).
In large refineries where there are extensive gland water systems uniform pressure and flow are
difficult to achieve. Further to this as the refinery ages the piping deteriorates and scaling from
corrosion will progressively get worse. Pressure, flow and water quality will need to be measured
at the individual pumps to ascertain whether it is a contributing factor to poor gland reliability.
4.5.4 Incorrect packing installation
o Wrong sized packing length – Excessive stuffing box clearances allows slurry to exit
wet end of pump.
o Over compressed packing – Prevents gland water from cooling shaft sleeve.
o Under compressed packing – Excessive stuffing box clearances allows slurry to exit
wet end of pump and into atmosphere.
This type of failure can be attributed to the training and skills of the pump tradesmen. The Gove
such as the mill injection glands as opposed to a sporadic one it is unlikely that poor installation
is responsible.
4.5.5 Wrong Pump Application
o High pressure spikes- Can be caused due to control valves on the discharge side
suddenly opening and closing. This can cause the discharge pressure of the pump to
momentarily to exceed the gland water pressure. This will inject slurry into the
packing deteriorating packing life.
o Pump operating off its best efficiency point – At the best efficiency point the
balance between flow, pressure and pump area is in equilibrium. When the pump is
operated away from the BEP the flow, pressure and area ratios become imbalanced
which create radial forces. These radial forces will increase as the pump operates
further away from the BEP. As the radial forces increase so to will the amount of
shaft deflection which is occurring. The deflection will cyclically deform the packing
decreasing its ability to perform its sealing duty.
(Know and Understand Centrifugal Pumps Larry Bachus and Angel Custodio 2003)
This suggests that a pump which operated at or close to its BEP will run reliably. To do this the
pump and piping system needs to ensure the following.
• Discharge valves remain in a constant position.
• There is no pipe scaling to build restriction in the lines.
• Operations require constant flows.
In reality this is not possible so some shaft deflection will be experienced and it needs to be
distinguished as to what is the acceptable level of shaft deflection.
4.5.6 Mechanical Fault
o Bearing failure – Bearing wear will increase the radial out of the shaft. This
run-out will deform the packing decreasing its ability to perform its sealing duty.
o Bent Shaft – Like a bearing failure and shaft deflection the bent shaft will deform the
These mechanical faults would be easily detectable and the symptoms of gland failure would be
expected to disappear after the corrective action has been performed.
Knowing and understanding the different failure modes which can occur in a stuffing box will be
an important tool when attempting to isolate a root cause in a gland failure. They will become
points of reference for later in the project.
4.6
Industry Methods in Improving Slurry Pump Gland Reliability
Slurry pumps are widely used in the resource industry due to their ability to transport solids in a
liquid medium. Australia being a major producer of raw materials relies heavily on slurry pumps
and consequently there is a large industry centred on the supply of products which are constantly
being developed for the purpose of improving gland performance. The following products are
relatively new on the market and give an example of possible solution that may be used in the
mitigation of a root cause of a reliability issue concerning glands. Further information about the
products can be found in Appendix B.
4.6.1. Grooved Flow Restrictor Bushes – These components are installed in forward flush
stuffing box configurations and replace the standard bush installed by the pump manufacturer.
The Grooved Flow Restrictor Bushes have a tapered spiral groove manufactured on the inside
diameter which is counter rotational to the shaft direction. Additionally the internal diameter of
the grooved section of the bush is conical, this then performs the following actions
o Gland water solids which are in suspension are separated to the outside of the bush
and channelled out of the stuffing box and into the wet end.
o Pumping action of the tapered spiral increases the pressure towards the wet end
maintaining an increased pressure differential.
o Reduces water usage by utilising tangential ports which distribute the water more
effectively.
4.6.2. Live Loading on the Glands – For a gland to work effectively the compression on the
maintenance staff. However there are often factors which prohibit this action occurring and the
reliability of the gland is affected. These factors include
o Poor access in the case of vertically mounted pumps or remotely located.
o Pump which present hazards such as high temperature, high pressure pumps.
o Pumps which have low maintenance intervals and experience a long time between
inspections.
This product maintains a constant force on the gland follower through either spring or hydraulic
loading which ensures that the compression is maintained.
4.6.3. Grease Purging of the Gland – In applications where gland water quality is poor or the
pressure and flow is unsuitable grease can be used to replace the water as a flushing medium.
Grease pressure is maintained through a grease pump and pumped into the gland. Due to the
superior lubrication qualities of grease compared to water only a fraction of the normal flush is
used.
4.6.4. Stuffing Box Bearings – Pumps that have a low shaft stiffness ratio and that are
operating significantly away from their B.E.P can experience shaft deflection due to the
unbalanced forces in the wet end of the pump. The Stuffing box bearing is installed in the
stuffing box and provides support to the shaft close to the impeller. This minimises deflection
and increases gland life by maintaining packing shape.
4.6.5. Slurry Packing- Due to the tendency for slurry pumps to be exposed to far more
aggressive applications then clean “fluid pumps” slurry specific packing has been developed.
Slurry packing incorporates re-enforcing fibres to maintain integrity, enhanced lubricants to
reduce friction and complex braiding to maintain shape.
4.6.6. Mechanical Seals- Traditionally mechanical seals have been avoided in slurry
applications. This is due to the limited range of applications a mechanical seal can be subjected
to. Axial loading, shaft run out, poor flush water and high solids will all contribute to mechanical
seal failure. In recent years slurry seals have been developed to better cope with these
4.6.7. Stiffened Shaft Assemblies – These assemblies are provided by Pump manufacturers to
avoid shaft deflection occurring. In the case where a pump is required to operate significantly
away from its B.E.P shaft deflection can lower gland life through the deformation of the packing.
The stiffened shafts or larger frames have better rigidity and are able to handle greater loading.
4.7
Previous Projects Concerning the Mill Injection Pumps
Over the last ten years there have been several projects that have investigated the poor gland
reliability issue concerning these pumps. These projects were performed by engineering and
maintenance personnel with the aim of mitigating the production losses. The project description
and details have mostly been extracted after examining the historical records of the pump crew
meeting minutes, past work orders raised and interviewing of the staff who were involved with
this pump group previously. An example of this evidence of this can be found in Appendix C.
4.7.1. Gland Water Pressure Differential Project - Project was carried out in 2006 as part of
a continuous improvement project. Due to process conditions the discharge pressure on the high
pressure pump side fluctuates making the pressure differential between the gland water and
pump discharge unstable. A pressure control system was installed to maintain a constant 200kPa
difference. This ensured that the pressure differential was constant. This had a positive effect on
the MTBF for the high pressure pumps (Pumps identified as having a 5 in their equipment
number). Referral to Chart 4.1 displays the high pressure pumps as having a significantly higher
MTBF as compared to the Low pressure pumps the exception to this is the 304D pump which is
a different make of pump compared to the other three.
Chart 4.1
MTBF (Based on Run Time)
The implementation of this improvement would have little effect on the low pressure pumps as
the speed and therefore discharge pressure is constant. The performance of 304D will be worth
investigating as to why it performs significantly better than the other low pressure pumps.
4.7.2. Installation of a Grooved Flow Restrictor – Project was carried out in 2005 by the
workshops engineer at the time. This involved the reconfiguration of the stuffing box from a
standard configuration to a forward flush configuration where a grooved flow restrictor was
fitted.
Project was unsuccessful and the stuffing box was re-converted back shortly after. There is no
data available to analysis as to the impact the project had on the gland MTBF,however it has
been suggested that the grooved flow restrictors were contacting the shaft sleeves and damaging
the components.
4.7.3. Repack MST – This was instigated in 2006 by the pump maintenance co-ordinator with
the aim of repacking the Pump glands on a scheduled basis before the MTBF point. A work
order was raised on a fortnightly basis and the repack planned in. Using this strategy it was
thought that the production loses could be avoided.
With eight pumps in the mill injection group it meant that one pump was required to be isolated
ready for maintenance approximately 8% of the time. Due to process requirements operations
could not afford to release the pumps for that frequency. Additionally when a pump was
available pump crew often lacked the manning to perform the task. The MST was cancelled after
one year.
4.7.4. Mechanical Seal Installation – Prior to 2000 there is some evidence that suggests a
slurry mechanical seal was trialled on these pumps however verification has not been achieved.
Given the poor reliability associated with the pump glands it is doubtful as to the suitability of
4.7.5. Slurry Packing Trials – Throughout the operational life of the mill injection pumps
there have been numerous packing trials that have been conducted. Different packing suppliers
have offered to help solve the issues by trialling their products. Slurry packing with different
weaves, yarn material and lubricant base have all been trialled with little effect.
Despite there being numerous slurry packing manufacturers the variation in make, quality and
composition is limited. Therefore the difference in performance will also be limited. To enact a
significant change in gland reliability changing the slurry packing brand is unlikely to have the
desired effect. However once the root cause is addressed the fine tuning process may involve
trialling different packing compositions.
4.8
Conclusions
The research conducted in this chapter has had the following purpose.
• Understand as to how pumps glands work.
• Understand how pump glands can fail.
• Understand what products or upgrades can be retrospectively installed so as to mitigate
the gland failures.
• Understand the successful and unsuccessful improvement work that has already been
conducted on this pump group and what effect it has had on the pump gland reliability.
The completion of this research has provided a broad understanding of the reliability issue at
hand and will enable future work to be focused towards the higher probability scenarios. Using
this strategy we can refer to Chart 4.1 which displays the fact that the poor gland reliability
mainly exists in the Low pressure A, B and C group pumps. Therefore to maximise the value
from this project we can exclude the other pumps from further analysis.
The fruits of this chapter will now lay the foundations for the following chapters which include
data collection, root cause analysis and the development and implementation of potential
solutions.
CHAPTER 5
DATA COLLECTION and ANALYSIS
5.1
Aims of Chapter
The specific aims of this chapter are to:
• Determine the relevant data which is to be collected based on the research conducted and
existing data previously displayed in this project.
• Display data which has been collected or calculated
• Report and discuss the of relevance of the collected data
This data analysis will then be combined with the next chapter to enable a complete Root Cause
analysis to be conducted.
5.2
Data Required
Referring to Chart 4.1 which displays the MTBF of the mill injection pumps. The chart indicates
that the D group pumps (Warman Manufacture) and the High pressure pumps (Identified by the
5 in the equipment number) are significantly better performers than the low pressure A, B and C
group pumps. This identification allows the data collection to focus on those three pumps.
The literary review in Chapter 4 indicated that the following failure modes associated with
Glands are the mostly likely modes which will yield the root cause.
• Worn Shaft Sleeves
• Poor Packing Selection
• Incorrect Gland Water supply
• Wrong Pump Application
• Mechanical Fault
To confirm the relevance of each failure mode to the mill injection pumps Table 5.1 displays the
Data Collection Plan
Failure Mode Data Requirement Data Source By When Collection
Freq / Span
Worn Shaft Sleeves Shaft Sleeve make Drawing Register D.Bishop 30th Jun Once Shaft Sleeve wear
attributes
Visual Investigation D.Bishop 01st Aug 2 Examples
Shaft sleeve MTBF compared with similar.
Process History and Ellipse work orders
D.Bishop 01st Aug Once
Poor Packing
Selection
Current Packing used Equipment Parts listings D.Bishop 01st Aug Once
Packing condition after failure
Visual Investigation D.Bishop 01st Aug 2 Examples
Incorrect Gland
Water supply
Required Gland Water flow
Manufacturers Specs (LSAS Technical Booklet).
D.Bishop 01st Aug 5 Samples
Required Gland Water pressure
Manufacturers Specs (LSAS Technical Booklet).
D.Bishop 01st Aug 5 Samples
Actual Gland Water flow At Pump D.Bishop 01st Aug Once Actual Gland Water
pressure
At Pump D.Bishop 01st Aug Once
Wrong Pump
Application
Flow curve of pump Pump Manufacturer resources D.Bishop 01st Aug Once
Actual flows pump is subjected to. Relation to B.E.P
Pi Historical trends D.Bishop 01st Aug 1 Months data
Shaft deflection
experienced by the pump for given flows
Calculations using
Manufacturers specifications and flow data from process history
D.Bishop 01st Aug 1 Months Data
Mechanical Fault Mechanical inspection after gland failure
[image:46.595.31.568.95.747.2]Failure Investigation D.Bishop 01st Aug 2 Examples
5.3
Data
5.3.1 Suitability of Shaft Sleeve
Make Shaft Sleeve is manufactured from mild steel, with Metco 34F hard facing, hardness tested to Rockwell 'C' 60+.
Metco 34F is a Tungsten Carbide powder blended with nickel. The powder is thermally fused on
to the shaft sleeve and requires minimal grinding. This gives the wear surface both the hardness
and corrosive resistance requirements for this application.
[image:47.595.161.450.251.676.2]Visual Inspections after use
Figure 5.1 After 10 days in operation
Figure 5.2 After 77 Days- rendered unusable
MTBF Current MTBF with the existing shaft sleeves is 70 days run time. This is poor compared
against other shaft sleeves in similar applications where 180 days has been achieved.
5.3.2 Suitability of Packing Selection
Make Current packing used is 1400r Graphmax 3/4 sq section manufactured by Chesterton. This packing is rated to 550 deg and 120 Bar rating.
Failure Inspections
[image:48.595.150.450.190.654.2]Fig 5.3 5 Days run time
Fig 5.4 21 Days run time
The square section packing looks to have been deformed due to shaft deflection
5.3.3 Suitability of Gland Water Supply
Required Gland Water Flow - Maximum of 18l/min Gland flush be used – No minimum
stated. The document suggests that considerably lower flows than the maximum stated should be
achievable with no adverse effects.
Actual Gland Water Flow – CurrentMaric flow restrictor set at 12 l/min
Required Gland Water Pressure - 70kPa above maximum discharge pressure.
(Obtained from LSA Technical Booklet). At 811rpm the pumps maximum discharge pressure is
49m head. With a slurry S.G of 1.824 this equates to a pressure of 868 kPa. The means that the
gland water pressure of 1000 is close to the optimum recommended by the manufacturers of 940
kPa
Actual Gland Water Pressure - HP water source has been recorded at between 950 and
[image:49.595.141.454.413.648.2]1000kPa depending on supply requirements.
5.3.4 Suitability of Pump To Application
Flow Curve
Chart 5.1 Flow Curve for 6-8 LSA -25
B.E.P for the current pump installed is at 687m³/hr and 42.9 m head (See Chart?)
Average Operating Point is 275m³/hr at 49m head.
B.E.P
Actual Flows pump is subjected to (Data extracted from Process history book)
Mill Injection Flows Using A, B or C Groups
170 190 210 230 250 270 290 310 330 30/0 6/10 2/07 /10 4/07 /10 6/07 /10 8/07 /10 10/0 7/10 12/0 7/10 14/0 7/10 16/0 7/10 18/0 7/10 20/0 7/10 22/0 7/10 24/0 7/10 26/0 7/10 28/0 7/10 m ^ 3 / h
r Stage 1
Stage 2 Average
Chart 5.2 Stage 1 and 2 Mill Injection Flows for a 1 month period
Pump Shaft deflection (See Appendix for calculations involved)
Shaft Deflection at Pump Shaft End
1.22 1.23 1.24 1.25 1.26 1.27 1.28 1.29 1.30 30/0 6/2 010 2/07 /201 0 4/07 /201 0 6/07 /201 0 8/07 /201 0 10/0 7/2 010 12/0 7/2 010 14/0 7/2 010 16/0 7/2 010 18/0 7/2 010 20/0 7/2 010 22/0 7/2 010 24/0 7/2 010 26/0 7/2 010 28/0 7/2 010 m m 's P633-4A P633-4B Average Deflection
Chart 5.3 Calculated Pump Shaft deflection for the 1 month period
R