T E C H N I C A L N O T E
Open Access
The BrainMap strategy for standardization,
sharing, and meta-analysis of neuroimaging data
Angela R Laird
1*, Simon B Eickhoff
2,3, P Mickle Fox
1, Angela M Uecker
1, Kimberly L Ray
1, Juan J Saenz Jr
1,4,
D Reese McKay
1, Danilo Bzdok
2,3, Robert W Laird
4, Jennifer L Robinson
5,6, Jessica A Turner
7, Peter E Turkeltaub
8,
Jack L Lancaster
1and Peter T Fox
1Abstract
Background:Neuroimaging researchers have developed rigorous community data and metadata standards that encourage meta-analysis as a method for establishing robust and meaningful convergence of knowledge of human brain structure and function. Capitalizing on these standards, the BrainMap project offers databases, software applications, and other associated tools for supporting and promoting quantitative coordinate-based meta-analysis of the structural and functional neuroimaging literature.
Findings:In this report, we describe recent technical updates to the project and provide an educational description for performing meta-analyses in the BrainMap environment.
Conclusions:The BrainMap project will continue to evolve in response to the meta-analytic needs of biomedical researchers in the structural and functional neuroimaging communities. Future work on the BrainMap project regarding software and hardware advances are also discussed.
Keywords:functional neuroimaging, structural neuroimaging, meta-analysis, BrainMap, neuroinformatics, activation likelihood estimation, ALE
Background
A recent and timely editorial inBMC Research Notes
called for a series of educational articles that promote best practices in data sharing in the biomedical sciences [1]. In the domain of neuroimaging research, data sharing is criti-cal for establishing the robust and meaningful convergence of knowledge of human brain function and structure. The need for such data pooling is primarily dictated by the inherent limitations of neuroimaging data. Most important among those are the rather small sample sizes investigated, the low reliability of indirect signals, and the inherent sub-traction logic that is only sensitive to differences between two specific conditions.
Progress towards open sharing of reusable original data has been slow, limited by complex data acquisition and analysis techniques that require extensive curation, the size of the data sets, patient confidentiality, as well as a
desire on the investigators’part to protect their costly investment and maintain future rights to their data. Never-theless, several recent efforts have begun to promote neuroimaging data sharing on a large scale, such as the Biomedical Informatics Research Network [2,3], XNAT Central [4,5], the Alzheimer’s Disease Neuroimaging Initiative [6,7], and the Human Connectome Project [8,9]. These projects focus on sharing complete imaging data sets at the subject level across a wide range of modalities, such as task-based functional magnetic resonance imaging (fMRI), resting state fMRI, structural MRI, diffusion ima-ging, positron emission tomography, magnetoencephalo-graphy, and electroencephalography. These multivariate neuroimaging data can be processed and analyzed in a huge variety of ways using algorithms that are in a contin-ual state of evolution and improvement. As a result, understanding complete data and processing provenance [10] across these diverse data sets remains a significant neuroinformatics challenge for the imaging community.
In contrast to these large-scale, multi-institutional sharing initiatives, the BrainMap project was created as
* Correspondence: [email protected]
1
Research Imaging Institute, University of Texas Health Science Center, San Antonio, TX, USA
Full list of author information is available at the end of the article
an alternative to sharing raw biomedical images. Instead, BrainMap offers a venue for sharing neuroimaging data in a reduced format as a means to encourage and facili-tate the identification of consistent findings on brain activity and structure across multiple data sets [11-14]. Here, we describe the rigorous community standards developed since the inception of functional and struc-tural neuroimaging research that have laid the founda-tion for the advancement of formal meta-analysis methods. These meta-analyses do not require access to raw image data, but can be achieved via information reported by authors in the published literature. In this report, we address the data and metadata standards that enable neuroimaging meta-analyses and the strategy developed by the BrainMap project to encourage data reuse and sharing throughout the community.
Neuroimaging Data Analysis and Reporting Standards
Spatial normalization algorithms have been developed and implemented in all of the major neuroimaging soft-ware packages (e.g.,FSL[15],SPM[16],AFNI[17], etc.) to ensure that data from individual subjects are spatially normalized from a subject’s“native” brain space to a
“standard” brain space. This data standardization
removes the effects of intersubject anatomical variability due to differences in brain size and shape, allowing inves-tigators to report their research findings in a manner that facilitates the comparison and synthesis of results across multiple studies [18]. The location of brain imaging results are hence generally published as three-dimen-sional coordinates (x,y,z) of the centers of mass of clus-ters or local maxima of brain activation or structural findings, to provide readers with quantitative summaries of the statistical parametric images, with correspondingz ortstatistic values to indicate the strength of the obser-vations. Most commonly, these tables of coordinates refer to locations in Talairach [19] or MNI standard spaces [20]. To facilitate meta-analysis of structural or functional brain findings, it is critical that authors clearly report which standard space was utilized in their publica-tions, as well as which software application was used for spatial normalization, since different applications can yield different results [21]. Frequently, this data descrip-tion can be incomplete or even inaccurate in the litera-ture, especially when the authors have employed a coordinate conversion algorithm to convert MNI coordi-nates to Talairach space (or vice versa) [21,22] and do not properly indicate this data transformation. Incom-plete data descriptions can have a significant effect on meta-analysis outcomes [23], and can be remedied by stronger adherence to the data reporting standards set forth by the fMRI Methods Working Group [24].
Capitalizing on these community standards for data ana-lysis and reporting, the BrainMap project was conceived in
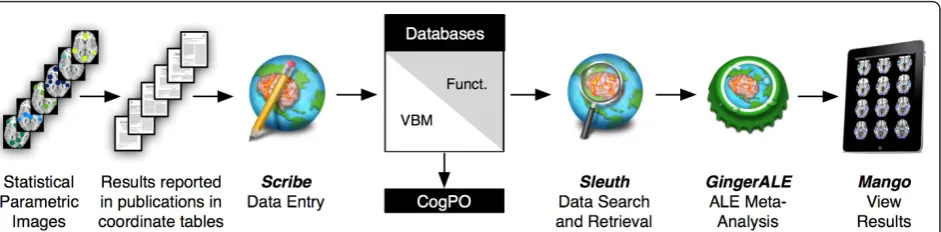
1988 and originally developed as a web-based interface to guide users through search, retrieval, and visualization of a coordinate-based database of functional neuroimaging results [25]. After more than 20 years of development, BrainMap has evolved into a much broader project whose software and data have been utilized in nearly 130 publica-tions, with half of those articles published in the last two years [26]. In contrast to other neuroimaging databases, BrainMap provides not only data for meta-analyses and data mining, but also distributes software and concepts for quantitative integration of data. Currently, the BrainMap project includes two neuroimaging databases, three desk-top software applications, one web-based application, and several other tools that serve ancillary functions for carry-ing out meta-analyses. Below we describe recent updates to the project and provide an educational description for performing meta-analyses in the BrainMap environment (an overview is depicted in Figure 1); this information reflects the new software versions that were released in August 2011.
Findings
BrainMap Databases
BrainMap was initially developed as a database for func-tionalneuroimaging studies reporting brain activation pat-terns as tabular-formatted three-dimensional stereotactic coordinates. Metadata describing the experimental design and data processing pipeline for each study are manually extracted from each publication, along with the coordi-nates, by internal BrainMap staff members or external users from the community. Generally, the latter is sup-ported by investigators who are interested in performing a meta-analysis on a given topic and consequently wish to increase BrainMap’s volume of studies relevant to this topic. Together, the extracted metadata and coordinate data for each publication comprise the database content. Currently, BrainMap archives the results of 2,114 func-tional neuroimaging publications, which include 39,672 subjects and report 79,577 activation locations across 9,994 experiments. This volume is estimated to include approximately 20% of the relevant literature [27].
BrainMap VBM database has been released to the public and is now live. Currently, BrainMap VBM archives the results of 729 voxel-based morphometry publications, which includes 50,375 subjects reporting 15,206 locations of structural differences across 2,231 experiments. While the BrainMap VBM database is much smaller than the functional database, this volume of the literature is also much smaller (939 total eligible publications), and it is hence estimated that the database includes approximately 78% of the eligible VBM studies.
Database Infrastructure
Both the BrainMap functional and VBM databases are managed with Oracle, a commercial relational database management system [31]. BrainMap’s data resides on a Sun Microsystem workstation running Oracle Solaris 10 at the Research Imaging Institute in San Antonio, TX.
The Oracle Corporation’s Object-Relational Database
Management System was utilized when designing Brain-Map’s database structure. Object-relational databases have a high-level structure that allows for defining data as objects instead of a collection of items in tables. Treating objects as cohesive units simplifies storing, updating, and retrieving data, as well as defining rela-tionships between objects. The ability to quickly fetch object data is extremely helpful when communicating with BrainMap’s Object-Oriented client programs.
BrainMap Software Applications
BrainMap’s client programs are written in the Java pro-gramming language that may run under PC, Macintosh, and UNIX operating systems. The use of Java makes updating and distributing these applications simpler for both developers and users. There are three main
desktop applications that provide access to the Brain-Map databases:Scribe,Sleuth, andGingerALE.
1.Scribeallows users to input data and metadata from publications into the databases using the Brain-Map taxonomy [32]. In previous versions,Scribeonly provided access to functional submissions; however, the newly released version 2.0 allows users to create entries for either the functional or VBM databases. WhenScribeis launched, a dialog window asks users to select which type of paper they wish to code, func-tional or VBM. Following this, the main application window is configured to match the user’s selection. Functional submissions are created as .ent files while the VBM database archives .vbm files, which allows each type of submission to be easily identified. In addition to integrating the interface for functional and VBM submissions, we have also improved how the application functions when there is no active internet connection, as this caused some problems in previous software versions.
[image:3.595.68.539.89.205.2]2.Sleuthallows users to search and retrieve coordi-nate data and metadata from the databases. A radio button gives users the option of searching either the functional or VBM database; simultaneous searching of both databases is not permitted to avoid a conflation of both types of imaging results. The graphical user interface ofSleuthhas been redesigned in version 2.0, and now allows users to build searches with multiple criteria using an interface that was inspired by the playlist building feature in Apple’siTunessoftware [33]. In addition, searches are now more rapidly exe-cuted as a result of server side optimizations to the database architecture in which search results are
pre-generated instead of being generated dynamically each time a search is made. Once a search is executed, users are able to examine and filter the query results in workspace panel. As part of this process, the software also allows the brain-based visualization of results with individual experiments being toggled on and off. Most recently,Sleuthnow offers the ability to search for stu-dies identifying functional or structural results located in a three-dimensional arbitrary-shaped region of interest (ROI) in Talairach or MNI space. To carry out these image-based ROI searches, all user-originated files must conform to a strict format: ROIs must be formatted as binary NIfTI [34] images with 1x1x1 mm3resolution, and the ROI must not extend across more than 500 voxels. These stringent requirements are enforced to ensure a timely response from the database; more advanced hardware solutions are cur-rently being evaluated to reduce these technical limita-tions and allow rapid image-based ROI searches of greater volume. OtherSleuthtools include the ability to: (1) generate a histogram of metadata results that describe the paradigms and behavioral domains asso-ciated with experiments in the current workspace, and (2) export workspaces in multiple formats, including images in NIfTI format (nii), EndNote[35] citation files (txt), or files suitable for meta-analysis using the GingerALEapplication (txt). Meta-analysis coordinate files can be exported in the form of either Talairach or MNI coordinates.
3. GingerALEallows users to carry out activation likelihood estimation (ALE) meta-analyses using BrainMap-formatted coordinate-based data in Talair-ach or MNI space. In ALE, a set of coordinates retrieved viaSleuth, which are identified by the user as suitable for meta-analysis, are input toGingerALE, blurred with a Gaussian distribution to accommodate the associated spatial uncertainty, and a statistical parameter is computed that estimates convergence across the modeled brain images and measures the likelihood of activation at each voxel in the brain. ALE was originally developed by Turkeltaub et al. [36], but the algorithm has undergone several revi-sions since then. When initially integrated into the BrainMap environment, a statistical framework was developed for multiple comparisons corrections and allowing two sets of coordinates to be contrasted [37]. In 2009, the algorithm was extensively modified to: (1) model the spatial uncertainty of each brain location using an estimation of the intersubject and interlaboratory variability typically observed in neuroimaging experiments, and (2) calculate the above-change clustering between experiments (i.e., random-effects analysis), rather than between foci (i.e., fixed-effects analysis) [38]. Most recently, we
published a modification of the ALE algorithm that minimizes both within-experiment and within-group effects, further optimizing the ALE technique [39]. These algorithms are available in the newest software
release,GingerALEversion 2.1.GingerALE2.1 also
includes a more streamlined interface and a revision of the subtraction analysis [40] originally developed by Laird et al. [37] that has been substantially improved using the new statistical framework devel-oped by Eickhoff et al. [38]. Tools are also included to spatially renormalize coordinates to Talairach or MNI space using publicly available algorithms [21,22].
All of the above software applications can be down-loaded from the BrainMap website [41]. [See Additional File 1 for the Scribeuser manual, Additional File 2 for the Sleuth user manual, and Additional File 3 for the GingerALEuser manual]
Related Tools
In addition to Scribe,Sleuth, andGingerALE, BrainMap distributes or links to several other related tools that serve ancillary functions for carrying out coordinate-based neuroimaging meta-analyses and sharing coordi-nate-based data and metadata.
1. BrainMapWeb is a web-based application for searching and retrieving data from the functional database [42]. Queries are similar to those ofSleuth, but lack 3D visualizations and advanced data manip-ulation capabilities.
2.icbm2talis a coordinate-based transformation that was developed to accommodate spatial disparity between Talairach and MNI coordinates [21].icbm2tal has been shown to provide improved fit as compared to the earliermni2taltransform [22], and improve the accuracy of coordinate-based meta-analyses [23]. icbm2talis distributed from withinGingerALEor can be downloaded as MATLAB .m files [43].
3.Mango(Multi-image Analysis GUI) is a viewer for biomedical research images [44]. It provides analysis tools and a user interface to navigate image volumes. Mangois available as a desktop application, web application, or iPad application. In the context of the
BrainMap project,Mangomay be used for viewing
meta-analysis results and generating and editing ROIs forSleuth’simage-based ROI searches.
4. TheTalairach Daemonis a spatially
comprehen-sive set of anatomical labels for Talairach coordinates [45,46]. TheTalairach Daemonis available as a desk-top java client, web applet, or high-speed database
server [47]. TheTalairach Daemon is utilized by
archived in the databases and to label the centers of mass of ALE meta-analysis results inGingerALE.
5. TheAnatomy Toolbox is a MATLAB-based
soft-ware tool [48] that allows the comparison of statisti-cal images, including meta-analysis results, with probabilistic cytoarchitectonic maps of the human brain [49,50]. Consistent findings from neuroimaging may be related to the histological properties of the cerebral cortex. In turn, regions of interest defined by cytoarchitectonic areas [51] may be used for probing the BrainMap databases.
6.CogPO[52] is an ontology of cognitive paradigms that is being built to enable the formal, machine-inter-pretable representation of paradigms in cognitive
neu-roscience experiments [53].CogPO is based on the
BrainMap taxonomy for describing experiments, and utilizes both the BrainMap functional database and the Functional Imaging Biomedical Informatics Research Network Human Imaging Database [54] for develop-ment and evaluation.CogPOversion 1 is available as a wiki [55] or can be downloaded in OWL format [56]. CogPOalso is available from within the Neuroscience
Information FrameworkNeuroLexWiki [57] and the
National Center for Biomedical OntologyBioPortal
[58].
Two Exemplar Meta-Analyses
In this section, we provide two examples of how coordi-nate-based neuroimaging meta-analyses can be performed using the BrainMap system of databases and software applications.
ALE Meta-Analysis of Acupuncture Studies
Paradigm-based, or function-based, meta-analyses are ana-lyses in which coordinates are pooled from a set of pub-lished neuroimaging studies examining similar behavioral conditions, as a means to determine the most consistently observed activation pattern for a given task. As an exam-ple, we performed a paradigm-based meta-analysis to identify consistent results observed during acupuncture tasks in functional neuroimaging studies. ASleuthsearch for the experiments reporting activations in healthy sub-jects was constructed using multiple search criteria:
(1) Experiments: Paradigm Class IS “Acupuncture”,
(2) Experiments: Context IS “Normal Mapping”, and
(3) Experiments: Activation IS“Activations Only”. This Sleuthquery returned hits for 10 papers, with 23 experi-ments; however, the search results were then manually fil-tered inSleuth’sworkspace by toggling experiments to remove activations associated with sham acupuncture. Thus, the final meta-analytic data set included 180 coordi-nates of brain activation locations from 10 papers across 20 experiments. These coordinates were exported from Sleuthfor ALE meta-analysis usingGingerALE.GingerALE
also accepts text files generated manually by the user (i.e.,
withoutSleuth); however, the formatting must match
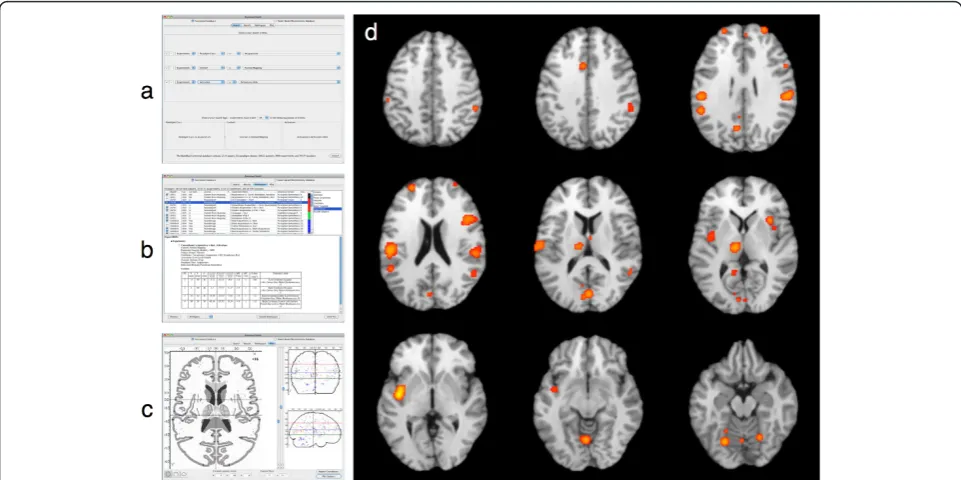
Sleuth’soutput. [See Additional File 4 for an example of a BrainMap-formatted text file that can be read by Ginger-ALE] Figure 2 depicts the procedure for (a) searching, (b) filtering, and (c) visualizing the acupuncture workspace in Sleuth, and (d) reveals the results of ALE meta-analysis of this data set as viewed inMango. The strongest conver-gence of foci from this group of acupuncture studies was observed in the bilateral insula, postcentral gyri, inferior parietal lobule, thalamus, and cerebellum. These regions are generally associated with stimulation of the somato-sensory system, and are likely candidates for regions engaged during acupuncture tasks.
Meta-Analytic Connectivity Modeling of the Amygdala In contrast to a paradigm-based meta-analysis, we next demonstrate how structure-based meta-analyses are car-ried out using BrainMap software using the meta-analy-tic connectivity modeling (MACM) approach. MACM was developed as a method of investigating whole-brain coactivation patterns for a region of interest across a range of tasks, i.e., functional connectivity. In this tech-nique, the BrainMap database is used to search for stu-dies reporting normal mapping activations in healthy subjects that fall within the boundaries of a three-dimensional rectangular, spherical, or arbitrary-shaped ROI, regardless of the behavioral conditions employed. The whole brain activation patterns from these studies are then integrated using the ALE method, yielding a map of significant coactivations that provides a task-free meta-analytic model of the region’s functional interac-tions throughout the rest of the brain. This method can be viewed as the meta-analytic analogue to seed-based connectivity analyses of resting state fMRI data [59-61]. MACM analyses have been shown to be useful in understanding the functional connectivity of the amyg-dala [62], parietal operculum [63], regions of the default mode network [64], and the nucleus accumbens [65].
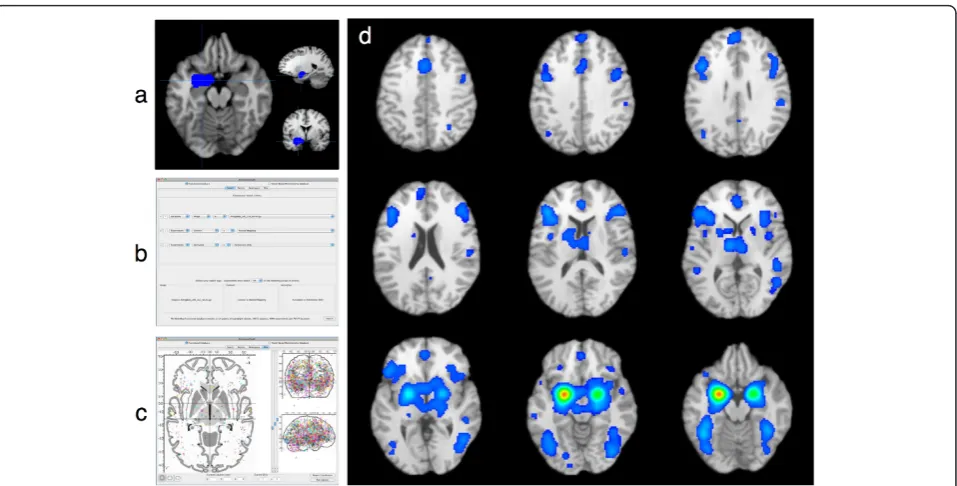
these coordinates were exported as a text file to be meta-analyzed withGingerALE. Figure 3 depicts (a) the visuali-zation of the left amygdala ROI inMango, (b) the search criteria inSleuth, (c) visualization of the left amygdala
workspace inSleuth, and (d) the results of theMACM
analysis of this data set inMango. As reported by Robin-son et al. [62], the strongest convergence of foci of left amygdala coactivations was observed in the bilateral amygdala, posterior and anterior cingulate, inferior and medial frontal gyri, insula, thalamus, and fusiform gyri.
Conclusions
The BrainMap project, including its databases, software clients, and other associated tools, will continue to evolve in response to the meta-analytic needs of biomedical researchers in the structural and functional neuroimaging communities. Current work on BrainMap focuses on further extensions of the analysis capabilities, such as adding conjunction analysis of multiple data sets to Gin-gerALE[67] and the ability to run a cluster analysis on a statistical parametric image. Tools are also being devel-oped to integrate BrainMap metadata inMangoto facili-tate detailed and quantitative functional labeling of any given image in the viewer (e.g., a single region of interest or multiple regions from an activation map). In addition, we are currently working on adding capabilities for carry-ing out statistical testcarry-ing ofSleuth’smetadata histograms to determine the significant behavioral domains or
paradigms that have been most frequently reported as corresponding to a given ROI or set of ROIs. In the next
year, BrainMapWeb will also undergo a substantial
upgrade that will include a more efficient interface and integration of VBM searches. Lastly, we aim to update the hardware that serves the BrainMap database, in order improve the computational speed of image-based ROI searches inSleuthand reduce the technical limitations that have been imposed, particularly with respect to the size of the ROIs allowed.
[image:6.595.57.538.89.329.2]The BrainMap project’s overall goal is to provide the human brain mapping community with data sets, compu-tational tools, and neuroinformatics resources that enable quantitative meta-analyses and meta-analysis-based neu-roimaging data interpretation. Our philosophy is that the most compelling meta-analytic applications are those extend the ALE method beyond that of a purely retro-spective tool and utilize meta-analytic results to guide prospective analyses in newly acquired experimental neu-roimaging data. Our aim is to fully embrace this philoso-phy in the next phase of the BrainMap project as we develop novel meta-analytic tools for improving causal model fit when studying the temporal dynamics that are engaged across different brain regions using effective connectivity techniques, such as dynamic causal model-ing [68] and structural equation modelmodel-ing [69]. Similarly, our most recent work emphasizes our meta-analytic phi-losophy via large-scale data mining as a means to
Figure 2Procedure and Results for a Paradigm-Based ALE Meta-Analysis. In paradigm-based, or function-based, meta-analyses, the BrainMap database is searched for a paradigm or task of interest by (a) constructing an appropriate set of search criteria withinSleuth. Studies matching this query are (b) downloaded toSleuth’sworkspace panel for further filtering, and (c) the observed location results of these
investigate fundamental brain-behavior correlations and the organization and interactions within intrinsic connec-tivity networks [70,71]. Future work on the BrainMap project will additionally involve the development of more comprehensive data mining techniques, as well as extending the functionality of meta-analytic connectivity mapping tools, including constructing, validating, and distributing an atlas of whole-brain task-dependent con-nectivity. Within the scope of these future aims, the BrainMap project hopes to achieve significant progress in our long-term vision to provide researchers with the tools and data that will provide the foundations for neu-roimaging-based models of healthy brain function, as well as models of psychiatric or neurological disease, across the human lifespan.
Additional material
Additional file 1: BrainMapScribeSoftware Manual. This file describes the features of theScribedesktop application for creating BrainMap database entries.
Additional file 2: BrainMapSleuthSoftware Manual. This file describes the features of theSleuthdesktop application for searching, retrieving, and visualizing data archived in the BrainMap databases. Additional file 3: BrainMapGingerALESoftware Manual. This file describes the features of theGingerALEdesktop application for performing activation likelihood estimation (ALE) meta-analyses on coordinate-based neuroimaging data.
Additional file 4: BrainMapGingerALECoordinate File. This file is an example of a BrainMap-formatted text file of coordinates that can be read and analyzed usingGingerALE.
Additional file 5: Gzipped NIfTI Image File of the Left Amygdala for Arbitrary-Shaped ROI Search inSleuth. This file is an example of a BrainMap-formatted image file that can be used for arbitrary-shaped ROI searches inSleuth.
Acknowledgements
This work was supported by grants from the National Institute of Mental Health (R01-MH074457 and R01-MH084812) and the Helmholz Initiative on Systems-Biology“The Human Brain Model”.
Author details
1Research Imaging Institute, University of Texas Health Science Center, San
Antonio, TX, USA.2Department of Psychiatry and Psychotherapy, RWTH Aachen University, Germany.3Institute of Neuroscience and Medicine (INM
-2), Research Center Jülich, Jülich, Germany.4Department of Physics and Earth Sciences, St. Mary’s University, San Antonio, TX, USA.5Scott & White
Memorial Hospital, Neuroscience Institute, Temple, TX, USA.6Texas A&M
Health Science Center, College of Medicine, Temple, TX, USA.7The Mind
Research Network, Albuquerque, NM, USA.8Department of Neurology,
University of Pennsylvania, Philadelphia, PA, USA.
Authors’contributions
[image:7.595.60.539.87.330.2]ARL and PTF designed the study. ARL wrote the manuscript. SBE, PMF, AMU, and JLL developed and managed the software applications, databases, and other resources. SBE, DB, and PET contributed algorithms and tools to the software. KLR, JJS, DRM, JLR, and RWL contributed and analyzed data and tested the software. All authors read and approved the final manuscript.
Competing interests
The authors declare that they have no competing interests.
Received: 26 May 2011 Accepted: 9 September 2011 Published: 9 September 2011
References
1. Hrynaszkiewicz I:A call for BMC Research Notes contributions promoting best practice in data standardization, sharing, and publication.BMC Res Notes2010,3:235.
2. The Biomedical Informatics Research Network.[http://nbirn.net]. 3. Keator DB, Grethe JS, Marcus D, Ozyurt B, Gadde S, Murphy S, Pieper S,
Greve D, Notestine R, Bockholt HJ, Papadopoulos P, BIRN:A national human neuroimaging collaboratory enabled by the Biomedical Informatics Research Network (BIRN).IEEE Trans Inf Technol Biomed2008,
12:162-72.
4. XNAT Central.[http://central.xnat.org].
5. Marcus DS, Olsen TR, Ramaratnam M, Buckner RL:The Extensible Neuroimaging Archive Toolkit: An informatics platform for managing, exploring, and sharing neuroimaging data.Neuroinformatics2007,
5:11-34.
6. The Alzheimer’s Disease Neuroimaging Initiative.[http://www.adni-info. org].
7. Butcher J:Alzheimer’s researchers open the doors to data sharing.The Lancet Neurology2007,6:480-481.
8. The Human Connectome Project.[http://humanconnectome.org]. 9. Akil H, Martone ME, Van Essen DC:Challenges and opportunities in
mining neuroscience data.Science2011,331:708-712.
10. Mackenzie-Graham AJ, Van Horn JD, Woods RP, Crawford KL, Toga AW:
Provenance in neuroimaging.NeuroImage2008,42:178-195.
11. Fox PT, Lancaster JL:Mapping context and content: The BrainMap model. Nat Rev Neurosci2002,3:319-321.
12. Laird AR, Lancaster JL, Fox PT:BrainMap: The social evolution of a human brain mapping database.Neuroinformatics2005,3:65-78.
13. Laird AR, Lancaster JL, Fox PT:Lost in localization? The focus is meta-analysis.Neuroimage2009,48:18-20.
14. Laird AR, Eickhoff SB, Kurth F, Fox PM, Uecker AM, Turner JA, Robinson JL, Lancaster JL, Fox PT:ALE meta-analysis workflows via the BrainMap database: Progress towards a probabilistic functional brain atlas.Front Neuroinformatics2009,3:23.
15. FMRIB Software Library.[http://www.fmrib.ox.ac.uk/fsl]. 16. Statistical Parametric Mapping.[http://www.fil.ion.ucl.ac.uk/spm]. 17. Analysis of Functional NeuroImages.[http://afni.nimh.nih.gov/afni]. 18. Fox PT:Spatial normalization origins: Objectives, applications, and
alternatives.Hum Brain Mapping1995,3:161-164.
19. Talairach J, Tournoux P:Co-planar stereotaxic atlas of the human brain: 3-dimensional proportional system: An approach to cerebral imaging. Stuttgart: Georg Thieme1988.
20. Collins DL, Neelin P, Peters TM, Evans AC:Automatic 3D intersubject registration of MR volumetric data in standardized Talairach space.J Comput Assist Tomogr1994,18:192-205.
21. Lancaster JL, Tordesillas-Gutiérrez D, Martinez M, Salinas F, Evans A, Zilles K, Mazziotta JC, Fox PT:Bias between MNI and Talairach coordinates analyzed using the ICBM-152 brain template.Hum Brain Mapp2007,
28:1194-1205.
22. Brett M, Johnsrude IS, Owen AM:The problem of functional localization in the human brain.Nat Rev Neurosci2002,3:243-249.
23. Laird AR, Robinson JL, McMillan KM, Tordesillas-Gutiérrez D, Moran ST, Gonzales SM, Ray KL, Franklin C, Glahn DC, Fox PT, Lancaster JL:
Comparison of the disparity between Talairach and MNI coordinates in functional neuroimaging data: validation of the Lancaster transform. NeuroImage2010,51:677-683.
24. fMRI Methods Working Group.[http://www.fmrimethods.org]. 25. Fox PT, Lancaster JL:Neuroscience on the net.Science1994,266:994-996. 26. BrainMap Publications (1994-Present).[http://brainmap.org/pubs]. 27. Derrfuss J, Mar RA:Lost in localization: The need for a universal
coordinate database.NeuroImage2009,48:1-7.
28. Glahn DC, Laird AR, Ellison-Wright I, Thelen SM, Robinson JL, Lancaster JL, Bullmore E, Fox PT:Meta-analysis of gray matter anomalies in schizophrenia: Application of anatomic likelihood estimation and network analysis.Biol Psychiatry2008,64:774-781.
29. Ellison-Wright I, Glahn DC, Laird AR, Thelen SM, Bullmore ET:The anatomy of first-episode and chronic schizophrenia: An anatomical likelihood estimation meta-analysis.Am J Psych2008,165:1015-1023. 30. Nickl-Jockschat T, Habel U, Michel TM, Manning J, Laird A, Fox PT,
Schneider F, Eickhoff SB:Brain structure anomalies in autism spectrum disorder (ASD): A meta-analysis of VBM studies using anatomic likelihood estimation (ALE).Hum Brain Mapp.
31. Oracle Corporation.[http://www.oracle.com].
32. Fox PT, Laird AR, Fox SP, Fox PM, Uecker AM, Crank M, Koenig SF, Lancaster JL:BrainMap taxonomy of experimental design: Description and evaluation.Hum Brain Mapp2005,25:185-198.
33. AppleiTunes.[http://www.apple.com/itunes].
34. The Neuroimaging Informatics Technology Initiative.[http://nifti.nimh.nih. gov].
35. Thomson ReutersEndNote.[http://endnote.com].
36. Turkeltaub PE, Eden GF, Jones KM, Zeffiro TA:Meta-analysis of the functional neuroanatomy of single-word reading: Method and validation.NeuroImage2002,16:765-780.
37. Laird AR, Fox M, Price CJ, Glahn DC, Uecker AM, Lancaster JL, Turkeltaub PE, Kochunov P, Fox PT:ALE meta-analysis: Controlling the false discovery rate and performing statistical contrasts.Hum Brain Mapp2005,
25:155-164.
38. Eickhoff SB, Laird AR, Grefkes C, Wang LE, Zilles K, Fox PT: Coordinate-based activation likelihood estimation meta-analysis of neuroimaging data: A random-effects approach based on empirical estimates of spatial uncertainty.Hum Brain Mapp2009,30:2907-2926.
39. Turkeltaub PE, Eickhoff SB, Laird AR, Fox M, Wiener M, Fox P:Minimizing within-experiment and within-group effects in activation likelihood estimation meta-analyses.Hum Brain Mapp.
40. Eickhoff SB, Bzdok D, Laird AR, Roski C, Caspers S, Zilles K, Fox PT: Co-activation patterns distinguish cortical modules, their connectivity and functional differentiation.Neuroimage.
41. BrainMap Project.[http://www.brainmap.org].
42. BrainMapWeb[http://www.brainmap.org:9000/bmapWeb]. 43. Theicbm2talTransform.[http://www.brainmap.org/icbm2tal]. 44. Mango[http://ric.uthscsa.edu/mango].
45. Lancaster JL, Rainey LH, Summerlin JL, Freitas CS, Fox PT, Evans AC, Toga AW, Mazziotta JC:Automated labeling of the human brain: A preliminary report on the development and evaluation of a forward-transform method.Hum Brain Mapp1997,5:238-242.
46. Lancaster JL, Woldorff MG, Parsons LM, Liotti M, Freitas CS, Rainey L, Kochunov PV, Nickerson D, Mikiten SA, Fox PT:Automated Talairach Atlas labels for functional brain mapping.Hum Brain Mapp2000,10:120-131. 47. TheTalairach Daemon.[http://www.talairach.org].
48. TheAnatomy Toolbox.[http://www.fz-juelich.de/inm/inm-1/DE/Forschung/ _docs/SPMAnantomyToolbox/SPMAnantomyToolbox_node.html]. 49. Eickhoff S, Stephan KE, Mohlberg H, Grefkes C, Fink GR, Amunts K, Zilles K:
A new SPM toolbox for combining probabilistic cytoarchitectonic maps and functional imaging data.NeuroImage2005,25:1325-1335. 50. Eickhoff SB, Paus T, Caspers S, Grosbras MH, Evans A, Zilles K, Amunts K:
Assignment of functional activations to probabilistic cytoarchitectonic areas revisited.NeuroImage2007,36:511-521.
51. Eickhoff SB, Heim S, Zilles K, Amunts K:Testing anatomically specified hypotheses in functional imaging using cytoarchitectonic maps. NeuroImage2006,32:570-582.
52. TheCognitive Paradigm Ontology.[http://www.cogpo.org]. 53. Turner JA, Laird AR:The Cognitive Paradigm Ontology: Design and
application.Neuroinformatics.
54. Keator DB, Wei D, Gadde S, Bockholt J, Grethe JS, Marcus D, Aucoin N, Ozyurt IB:Derived data storage and exchange workflow for large-scale neuroimaging analyses on the BIRN Grid.Front Neuroinformatics2009,
8:231-249.
55. TheCogPOWiki.[http://www.wiki.cogpo.org].
56. TheCogPO, Version 1.[http://www.cogpo.org/ontologies/CogPOver1.owl]. 57. The Neuroscience Information FrameworkNeuroLexWiki.[http://neurolex.
org/wiki].
58. The National Center for Biomedical Ontology. BioPortal[http://www. bioportal.ncbo.org].
60. Xiong J, Parsons LM, Gao JH, Fox PT:Interregional connectivity to primary motor cortex revealed using MRI resting state images.Hum Brain Mapp
1999,8:151-156.
61. Cordes D, Haughton VM, Arfanakis K, Wendt GJ, Turski PA, Moritz CH, Quigley MA, Meyerand ME:Mapping functionally related regions of brain with functional connectivity MR imaging.AJNR Am J Neuroradiol2000,
21:1636-1644.
62. Robinson JL, Laird AR, Glahn DC, Lovallo WR, Fox PT:Meta-analytic connectivity modelling: Delineating the functional connectivity of the human amygdala.Hum Brain Mapp2010,31:173-184.
63. Eickhoff S, Jbabdi S, Caspers S, Laird AR, Fox PT, Zilles K, Behrens T:
Anatomical and functional connectivity of cytoarchitectonic areas within the human parietal operculum.J Neurosci2010,30:6409-6421.
64. Laird AR, Eickhoff SB, Li K, Robin DA, Glahn DC, Fox PT:Investigating the functional heterogeneity of the default mode network using coordinate-based meta-analytic modeling.J Neurosci2009,29:14496-14505. 65. Cauda F, Cavanna AE, D’agata F, Sacco K, Duca S, Geminiani GC:Functional
connectivity and coactivation of the nucleus accumbens: A combined functional connectivity and structure-based meta-analysis.J Cogn Neurosci.
66. Smith SM, Jenkinson M, Woolrich MW, Beckmann CF, Behrens TE, Johansen-Berg H, Bannister PR, De Luca M, Drobnjak I, Flitney DE, Niazy RK, Saunders J, Vickers J, Zhang Y, De Stefano N, Brady JM, Matthews PM:
Advances in functional and structural MR image analysis and implementation as FSL.Neuroimage2004,23:S208-S219.
67. Caspers S, Zilles K, Laird AR, Eickhoff SB:ALE meta-analysis of action observation and imitation in the human brain.Neuroimage2010,
50:1148-1167.
68. Friston KJ, Harrison L, Penny W:Dynamic causal modelling.Neuroimage
2003,19:1273-1302.
69. McIntosh A, Gonzales-Lima F:Structural equation modeling and its application to network analysis in functional brain imaging.Hum Brain Mapp1994,2:2-22.
70. Smith SM, Fox PT, Miller KL, Glahn DC, Fox PM, Mackay CE, Filippini N, Watkins KE, Toro R, Laird AR, Beckmann CF:Correspondence of the brain’s functional architecture during activation and rest.Proc Natl Acad Sci USA
2009,106:13040-13045.
71. Laird AR, Fox PM, Eickhoff SB, Turner JA, Ray KL, McKay DR, Glahn DC, Beckmann CF, Smith SM, Fox PT:Behavioral interpretations of intrinsic connectivity networks.J Cogn Neurosci.
doi:10.1186/1756-0500-4-349
Cite this article as:Lairdet al.:The BrainMap strategy for
standardization, sharing, and meta-analysis of neuroimaging data.BMC
Research Notes20114:349.
Submit your next manuscript to BioMed Central and take full advantage of:
• Convenient online submission
• Thorough peer review
• No space constraints or color figure charges
• Immediate publication on acceptance
• Inclusion in PubMed, CAS, Scopus and Google Scholar
• Research which is freely available for redistribution