T E C H N I C A L N O T E
Open Access
RNA isolation method for single embryo
transcriptome analysis in zebrafish
Mark de Jong
1, Han Rauwerda
1, Oskar Bruning
1, Jurgo Verkooijen
1, Herman P Spaink
2, Timo M Breit
1*Abstract
Background:Transcriptome analysis during embryogenesis usually requires pooling of embryos to obtain sufficient RNA. Hence, the measured levels of gene-expression represent the average mRNA levels of pooled samples and the biological variation among individuals is confounded. This can irreversibly reduce the robustness, resolution, or expressiveness of the experiment. Therefore, we developed a robust method to isolate abundant high-quality RNA from individual embryos to perform single embryo transcriptome analyses using zebrafish as a model organism. Available methods for embryonic zebrafish RNA isolation minimally utilize ten embryos. Further downscaling of these methods to one embryo is practically not feasible.
Findings:We developed a single embryo RNA extraction method based on sample homogenization in liquid
nitrogen, RNA extraction with phenol and column purification. Evaluation of this method showed that: the quality of the RNA was very good with an average RIN value of 8.3-8.9; the yield was always≥200 ng RNA per embryo; the method was applicable to all stages of zebrafish embryogenesis; the success rate was almost 100%; and the extracted RNA performed excellent in microarray experiments in that the technical variation was much lower than the biological variation.
Conclusions:Presented is a high-quality, robust RNA isolation method. Obtaining sufficient RNA from single embryos eliminates the necessity of sample pooling and its associated drawbacks. Although our RNA isolation method has been setup for transcriptome analysis in zebrafish, it can also be used for other model systems and other applications like (q)PCR and transcriptome sequencing.
Background
Transcriptome studies of model organisms during devel-opment such asMus musculus [1],Drosophila melano-gaster [2] and Caenorhabditis elegans [3] are exciting research fields with many opportunities, yet often ham-pered by the availability or size of biological materials. In the last two decades Zebrafish (Danio rerio) has joined these experimental model organisms in many domains of biological and biomedical research [4-6]. This is also fueled by the convenient morpholino techni-que, in which antisense oligonucleotide injection -usually in eggs or embryos- effectively ‘knocks down’ target gene expression [7]. Additionally, the morpholino technique in combination with genome-wide transcrip-tome analysis has boosted developmental studies
involving zebrafish embryogenesis. Hence, many research groups worldwide embraced this model system in their research.
In studies of genetic networks in zebrafish develop-ment [8], responses toe.g. pathogen infection [9,10], or tissue specificity [11-14], biological materials are often pooled to obtain sufficient RNA. The results of these studies are undoubtedly of great value, but each mea-surement can only be interpreted as the average profile of the selected pool. Although pooling can be useful in some studies, the possible downsides of pooling are beyond discussion [15-17]. Pooling should therefore be an optional step, rather than a necessity. Especially with the rapidly developing zebrafish embryos that are only identified by broad-range phenotypic markers, pools of embryos will show variability because the embryos in it will not reside in the exact same embryonic phase. To tackle these drawbacks and adopt a more systems biol-ogy approach aimed at individual systems, we developed * Correspondence: [email protected]
1
MicroArray Department & Integrative Bioinformatics Unit, Swammerdam Institute for Life Sciences, Faculty of Science, University of Amsterdam, Science Park 904, 1098 XH, Amsterdam, the Netherlands
a reliable protocol to isolate high-quality RNA from individual zebrafish embryos with a yield sufficient for microarray analysis and other transcriptome analysis techniques.
Available methods for embryonic zebrafish RNA isola-tion commonly need to utilize 20 embryos or more to obtain sufficient RNA (For examples see The zebrafish book [18] and [19]). Scaling extraction volumes propor-tionally down to less embryos, is feasible to ~10 embryos, but smaller numbers lead to unworkable methods. One method is described to isolate RNA from 10 embryos at 36 hpf (~500 ng/embryo) or 52 hpf (~600 ng/embryo) [13], but as these embryos were already relatively far in development, it was not clear if this would also be applicable to earlier stage embryos. In this work, several methods were investigated for iso-lating RNA from individual embryos with the following prerequisites: 1) Isolated RNA should display a RNA Integrity Number (RIN, quality measurement from Agi-lent Technologies) greater than or equal to 7.0; 2) The RNA yield per embryo should be sufficient to allow quality checks and downstream processing, i.e. more than 200 ng; 3) Impurities should be low, so that mRNA amplifications can be performed.
One of the challenges of isolating RNA from zebrafish is the presence of a rigid and insoluble chorion. Enzy-matic degradation of the chorion is possible, but will most likely affect the transcriptome. Therefore, we chose for a sample preparation method involving mechanical disruption of the chorion under frozen conditions. RNA isolations itself, can be performed by several well-estab-lished methods based on phenol-chloroform extraction and precipitation or column-based nucleic acid purifica-tion with the aid ofe.g. guanidine thiocyanate. All kinds of methods and commercial kits are available today, each with particular advantages and applications. We have tested several published methods based on phenol-chloroform extractions with precipitation, column purifi-cations and bead-based extraction methods. None of them performed well enough with respect to purity, yield and reproducibility. We therefore changed one of these methods [14] until it fulfilled our requirements of quality, yield and reproducibility. Important observations during the optimization were: 1) Incompletely homogenized samples gave lower quality RNA; 2) Good homogeniza-tion was only obtained with frozen samples; 3) Increased volumes of applied Qiazol lowered yield substantially and 4) The use of a phase-separation agent (e.g. phase-lock gel heavy) is indispensable for maximum yield and limit-ing Qiazol carry-over. To validate and demonstrate the value of our method, several dedicated experiments were performed.
Results
RNA quality and technical variation
To investigate the technical variation of our method, RNA was isolated from eight individual embryos (Danio rerio, strain AB) at the germ ring stage. Because embryonic staging is quite difficult, the embryos will be in a marginally different stage and will because of that, show biological variation. From four embryos, RNA was individually isolated (called Single 1 to 4). To eliminate the biological variation, the other four embryos were first individually homogenized, then the homogenized material was pooled, and finally split into four samples for separate RNA isolations (Semi-single 1 to 4). Hence, the Semi-(Semi-single samples should hold the same RNA content and differences could be attributed solely to technical variation of the RNA iso-lation method. The quality of the isolated RNA was very good, as all RIN values were ≥ 8.3 (Figure 1a) [Additional file 1]. All RNA isolations yielded≥ 400 ng (Figure 1b). As expected, the variation in RNA yield was much lower in the Semi-single samples than the Single samples. This might indicate that RNA content varies greatly between individual embryos, although column affinity differences by, for example, higher silica content could also have caused this. To further assess the quality of the isolated RNA, the mRNA from each sample was amplified, labeled, and hybri-dized on a custom Agilent 8 × 15 k zebrafish microar-ray using standard microarmicroar-ray procedures. RNA isolated from a pool of 20 embryos from the germ ring stage served as a common reference RNA sample. This RNA was isolated with similar volumes as used for sin-gle embryos as described in the methods section and yielded ~350 ng/embryo with RIN 8.7. Figure 1c shows that the mean unnormalized log2 signal intensities of
reference, as well as test samples on all microarrays were all well-above background and highly comparable. The variance in the unnormalized log2 ratios (test/
Robustness
To show the robustness of our RNA isolation methods, two experiments including larger numbers of samples were executed: 30 unfertilized eggs and 186 individual embryos, ranging from dome stage to 90% epiboly. The average RIN value of all samples was 8.9 for the unferti-lized eggs and 8.4 for the epibolic samples (Figure 1a). Only one sample from all isolations was observed with a RIN value below 7.0 (Figure 1a), which is below the quality prerequisite. All samples yielded ≥ 200 ng of RNA (Figure 1b).
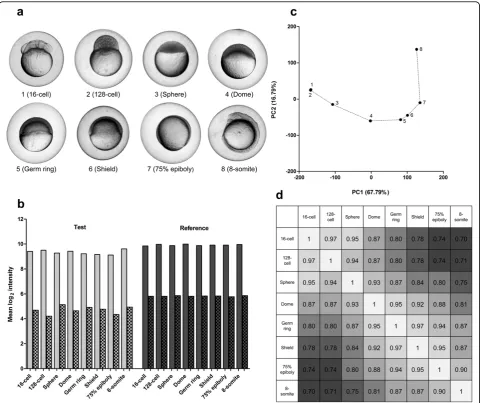
Applicability in zebrafish embryogenesis
[image:3.595.57.542.89.496.2]To demonstrate applicability throughout zebrafish embryogenesis, a developmental set of eight embryos was selected, ranging from 16-cell to the 8-somite stage (Figure 2a). The quality of the isolated RNA was good, as all RIN values were ≥7.9 (Figure 1a) [Additional file 2] and yields were all above 200 ng (Figure 1b). Pooling a small fraction of RNA from each sample constituted the common reference. All signals on the custom Agi-lent 8 × 15 k zebrafish microarrays were well-above background (Figure 2b) and the common reference Figure 1Validation of the RNA isolation method from single zebrafish embryos. (a) RNA RIN values and (b) yields from: Single, individual embryos (4); Semi-single, homogenized, pooled, and split embryo material (4, see text); Developmental, embryos from the 16-cell to 8-somite stage (8); Unfertilized, unfertilized eggs (30); Epibolic, embryos from dome stage to 90% epiboly (186). Stages and RNA yield could not be linked. Note that RIN values show overlap because of a single decimal place measurement accuracy. (c) Mean, unnormalized log2signal intensities from
microarray analysis (smooth bar, foreground signal and scatter board bar, background signal). (d) Principal component analysis (PCA) of the unnormalized log2ratios (test/reference) from the Single and Semi-single samples. (e) Spearman correlations showing the similarity of the
signals were highly comparable. The PCA on the unnor-malized log2 ratios (test/reference) showed a
develop-mentally ordered separation of all samples (Figure 2c). The Spearman correlations showed a similar picture with samples further apart in the embryogenesis having a lower correlation. The correlations between the refer-ence samples were all≥0.99 (data not shown).
Conclusions
In summary, here we present a robust RNA isolation method for individual zebrafish embryos. The validation of this method showed that the technical variation is much lower than the biological variation. Moreover, this method seems excellently suited to distinguish different embryonic stages by microarray analysis. Although this method has
been setup with a focus on transcriptome analysis, it can also be used for other applications like (q)PCR or tran-scriptome sequencing. Our method could also be made applicable for embryos and small samples of dissected tis-sues from other model systems, as we already have done for small human skin biopsies, especially when sample material is limited or pooling is unwanted.
Methods
Biological materials
[image:4.595.58.542.88.491.2]Zebrafish were handled in compliance with local animal welfare regulations and maintained according to stan-dard protocols http://zfin.org[20]. Embryos of Danio rerio (strainAB) were kept at 30°C in egg water (60μg/ ml Ocean sea salts). Individual embryos were imaged Figure 2Dissecting zebrafish development with microarray analysis. (a) Eight selected embryos ranging from the 16-cell to 8-somite stage. (b) Mean, unnormalized log2signal intensities from microarray analysis (smooth bars, foreground signal and scatter board bars, background
signal). (c) Principal component analysis (PCA) on unnormalized log2ratio data (test/reference) showing a‘developmental’curve starting at the
with stereo microscopy (Leica MZ16 FA) and trans-ferred to 1.5 ml tubes. Remaining egg water was removed and embryos were quickly snap frozen in liquid nitrogen and stored at -80°C. Females were anesthetized briefly in egg water containing 0.02% buf-fered ethyl 3-aminobenzoate methanesulfonate (Tricaine, Sigma-Aldrich). They were transferred to petri-dishes and unfertilized eggs were harvested by gentle squeez-ing. Afterwards, they were allowed to recover for one month.
Zebrafish test microarrays
Microarrays have been custom designed and obtained from Agilent Technologies using the 8 × 15 k slide for-mat. The 15 k microarray (design ID: 021987) contains ~15.000 probes and has been designed on a non-rendundant set of Ensembl and Vega transcripts with a ZFIN annotation. The design for this array and microar-ray data discussed in this publication have been depos-ited in the National Center for Biotechnology Information Gene Expression Omnibus (GEO) [21-23] and are accessible through GEO series number GSE17736 and GSE17738.
RNA extraction protocol
Per RNA isolation, one 1.5 ml tube was filled beforehand with 75-100 mg phase-lock gel heavy (5-Prime) and pel-leted for 30 s at 12,000 × g. Tubes with individual embryos were kept in liquid nitrogen until processing. Single embryos were grinded individually with a liquid nitrogen pre-chilled metal micro-pestle (Carl Roth). The pestle was lifted slightly and 200μl Qiazol (Qiagen) was added. The pestle was placed back into the tube with Qiazol and the homogenate was allowed to thaw. Before removal, the pestle was washed with an additional 100μl Qiazol to rinse of any material that might have stuck to the pestle. The homogenate was vortexed vigorously for 15 s, left at room temperature for at least 5 min, and then spun down quickly for 15 s. 60μl chloroform was added to the homogenate, vortexed for 15 s and kept at room temperature for 3 min. The partly separated mix-ture was transferred as a whole to a pre-prepared phase-lock gel heavy containing tube and centrifuged for 15 min at 12,000 × g. The aqueous phase was transferred to a new 1.5 ml tube. The RNA was purified by column pre-cipitation according to the RNeasy MinElute Cleanup Handbook (version 2007) - Appendix D: RNA Cleanup after Lysis and Homogenization with Qiazol Lysis Reagent (Qiagen). At the end of the procedure, the RNA was eluted in 14μl nuclease-free water.
RNA yield and quality
The amount of RNA perμl was measured on the Nano-Drop ND-1000 (Thermo Scientific). The integrity of the
RNA was investigated with the BioAnalyzer (Agilent Technolgies) using the RNA pico 6000 kit (Agilent Technologies).
Amplification and labelling of RNA
200 ng RNA including controls, (Spikeset A for Cy3 and -B for Cy5, 1/16 final dilution) from the Two-Color RNA Spike-In Kit (Agilent Technologies), was taken as input for half volume reactions of the one-round mRNA amplification per zebrafish embryo (Amino-allyl MessageAmp II kit, Applied Biosystems). 5 μg of amplified RNA was dried in a speedvac and dissolved in 5 μl 50 mM carbonate buffer (pH 8.5) by thoroughly up and down pipetting and placed at 42°C for 5 min. They were vortexed and spun down briefly. Vials of mono-reactive CyDyes (GE Healthcare) were dissolved in 200 μl DMSO. To each reaction 10 μl of dissolved CyDye was added (Test Cy3, Reference -Cy5). They were mixed thoroughly by pipetting up and down, vortexed and spun down briefly. Subsequently, samples were incubated for 60 min at room tempera-ture in the dark. After 30 min the samples were vor-texed and spun down briefly and left the residual 30 min in the dark. The reactions were quenched by addi-tion of 5 μl 4 M hydroxylamine for 15 min in the dark at room temperature. 80μl of nuclease-free water was added to each sample to bring the volume to 100 μl. The RNA was purified with column precipitation according to the RNeasy MinElute Cleanup Handbook (version 2007) - Protocol: RNA Cleanup and Concen-tration (Qiagen). Finally, the RNA was eluted twice in 14 μl nuclease-free water. The yield and CyDye incor-poration were measured with the NanoDrop ND-1000 (Thermo Scientific).
Microarray hybridization, scanning & data processing
Each hybridization mixture was made up from 300 ng
‘Test’and 300 ng ‘Reference’ sample according to the Two-Color Microarray-Based Gene Expression Analy-sis Manual version 5.5 (Agilent Technologies). The RNA was allowed to hybridize for 16 hours at 65°C and 10 RPM. Afterwards the slides were washed and scanned in an ozone-free room with the Agilent DNA microarray scanner G2565BA (Agilent Technologies). Slides were scanned with eXtended Dynamic Range and 5 μm resolution. Microarray data was extracted with Feature Extraction Software version 9.5.3 (Agi-lent Technologies). The obtained median signals were log2 converted and the average log2 signal intensity
was calculated for the foreground and background sig-nals. Log2 converted ratios were used to perform
Additional file 1: RNA quality Single and Semi-single samples. This figure shows the RNA profiles of the Single and Semi-single samples as given by the Agilent 2100 BioAnalyzer together with their respective RNA Integrity Numbers (RIN).
Click here for file
[ http://www.biomedcentral.com/content/supplementary/1756-0500-3-73-S1.TIFF ]
Additional file 2: RNA quality Development samples. This figure shows the RNA profiles of the Development samples as given by the Agilent 2100 BioAnalyzer together with their respective RNA Integrity Numbers (RIN).
Click here for file
[ http://www.biomedcentral.com/content/supplementary/1756-0500-3-73-S2.TIFF ]
Acknowledgements
The authors thank the animal caretakers from Leiden University, especially U. Nehrdich for her expertise and support.
Author details
1
MicroArray Department & Integrative Bioinformatics Unit, Swammerdam Institute for Life Sciences, Faculty of Science, University of Amsterdam, Science Park 904, 1098 XH, Amsterdam, the Netherlands.2Department of Molecular Cell Biology, Institute of Biology, Leiden University, Gorlaeus Laboratories - Cell Observatorium, Einsteinweg 55, 2333 CE, Leiden, the Netherlands.
Authors’contributions
MdJ and TMB conceived the method and wrote the paper; MdJ developed the method; MdJ and JV performed the experiments; OB and HR analyzed the data; TMB and HPS supervised the project. All authors read and approved the final manuscript.
Competing interests
The authors declare that they have no competing interests.
Received: 5 January 2010 Accepted: 16 March 2010 Published: 16 March 2010
References
1. Hamatani T, Yamada M, Akutsu H, Kuji N, Mochimaru Y, Takano M, Toyoda M, Miyado K, Umezawa A, Yoshimura Y:What can we learn from gene expression profiling of mouse oocytes?Reproduction2008,
135:581-592.
2. Lebo MS, Sanders LE, Sun F, Arbeitman MN:Somatic, germline and sex hierarchy regulated gene expression during Drosophila metamorphosis.
BMC Genomics2009,10:80.
3. Capra EJ, Skrovanek SM, Kruglyak L:Comparative developmental expression profiling of twoC. elegansisolates.PLoS One2008,3:e4055. 4. Anderson KV, Ingham PW:The transformation of the model organism: a
decade of developmental genetics.Nat Genet2003, ,Suppl:285-293. 5. Ingham PW:The power of the zebrafish for disease analysis.Hum Mol
Genet2009,18:R107-R112.
6. Brittijn SA, Duivesteijn SJ, Belmamoune M, Bertens LF, Bitter W, de Bruijn JD, Champagne DL, Cuppen E, Flik G, Vandenbroucke-Grauls CM, Janssen RA, de Jong IM, de Kloet ER, Kros A, Meijer AH, Metz JR, Sar van der AM, Schaaf MJ, Schulte-Merker S, Spaink HP, Tak PP, Verbeek FJ,
Vervoordeldonk MJ, Vonk FJ, Witte F, Yuan H, Richardson MK:Zebrafish development and regeneration: new tools for biomedical research.Int J Dev Biol2009,53:835-850.
7. Eisen JS, Smith JC:Controlling morpholino experiments: don’t stop making antisense.Development2008,135:1735-1743.
8. Mathavan S, Lee SGP, Mak A, Miller LD, Murthy KRK, Govindarajan KR, Tong Y, Wu YL, Lam SH, Yang H, Ruan Y, Korzh V, Gong Z, Liu ET, Lufkin T:
Transcriptome Analysis of Zebrafish Embryogenesis Using Microarrays.
PloS Genet2005,1:e29.
9. Sar Van der AM, Spaink HP, Zakrzewska A, Bitter W, Meijer AH:Specificity of the zebrafish host transcriptome response to acute and chronic
mycobacterial infection and the role of innate and adaptive immune components.Mol Immunol2009,46:2317-2332.
10. Stockhammer OW, Zakrzewska A, Hegedûs Z, Spaink HP, Meijer AH:
Transcriptome profiling and functional analyses of the zebrafish embryonic innate immune response to Salmonella infection.J Immunol
2009,182:5641-5653.
11. Toyama R, Chen X, Jhawar N, Aamar N, Epstein J, Reany N, Alon S, Gothilf Y, Klein DC, Dawid IB:Transcriptome analysis of the zebrafish pineal gland.
Dev Dyn2009,238:1813-1826.
12. Malek RL, Sajadi H, Abraham J, Grundy MA, Gerhard GS:The effects of temperature reduction on gene expression and oxidative stress in skeletal muscle from adult zebrafish.Comp Biochem Physiol C Toxicol Pharmacol2004,138:363-373.
13. Cerda GA, Hargrave M, Lewis KE:RNA profiling of FAC-sorted neurons from the developing zebrafish spinal cord.Dev Dyn2009,238:150-161. 14. Leung YF, Downling JE:Gene expression profiling of zebrafish embryonic
retina.Zebrafish2005,2:269-283.
15. Mary-Huard T, Daudin JJ, Baccini M, Biggeri A, Bar-Hen A:Biases induced by pooling samples in microarray experiments.Bioinformatics2007,23: i313-i318.
16. Jolly RA, Goldstein KM, Wei T, Gao H, Chen P, Huang S, Colet J-M, Ryan TP, Thomas CE, Estrem ST:Pooling samples within microarray studies: a comparative analysis of rat liver transcription response to prototypical toxicants.Physiol Genomics2005,22:346-355.
17. Allison DB, Cui X, Page GP, Sabripour M:Microarray data analysis: from disarray to consolidation and consensus.Nat Rev Genet2006,7:55-65. 18. Westerfield M:The zebrafish book. A guide for the laboratory use of zebrafish
(Danio rerio)Univ. of Oregon Press, Eugene, 4 2000.
19. Linney E, Dobbs-McAuliffe B, Sajadi H, Malek RL:Microarray gene expression profiling during the segmentation phase of zebrafish development.Comp Biochem Physiol C Toxicol Pharmacol2004,
138:351-362.
20. The Zebrafish Model Organism Database.[http://zfin.org]. 21. Gene Expression Omnibus (GEO).[http://www.ncbi.nlm.nih.gov/geo/]. 22. Barrett T, Suzek TO, Troup DB, Wilhite SE, Ngau WC, Ledoux P, Rudnev D,
Lash AE, Fujibuchi W, Edgar R:NCBI GEO: archive for high-throughput functional genomic data.Nucleic Acids Res2005,33:D562-566. 23. Edgar R, Domrachev M, Lash AE:Gene Expression Omnibus: NCBI gene
expression and hybridization array data repository.Nucleic Acids Res2002,
30:207-210.
doi:10.1186/1756-0500-3-73
Cite this article as:de Jonget al.:RNA isolation method for single embryo transcriptome analysis in zebrafish.BMC Research Notes2010 3:73.
Submit your next manuscript to BioMed Central and take full advantage of:
• Convenient online submission
• Thorough peer review
• No space constraints or color figure charges
• Immediate publication on acceptance
• Inclusion in PubMed, CAS, Scopus and Google Scholar • Research which is freely available for redistribution