RESEARCH ARTICLE
Prevalence of obstructive lung disease
in an African country using definitions
from different international guidelines:
a community based cross‑sectional survey
Eric Walter Pefura‑Yone
1,2*, André Pascal Kengne
3, Adamou Dodo Balkissou
2, Christiane Gaelle Magne‑Fotso
4,
Martine Ngo‑Yonga
4, Julie Raïcha Boulleys‑Nana
4, Nelly Rachel Efe‑de‑Melingui
4,
Patricia Ingrid Ndjeutcheu‑Moualeu
4, Charles Lebon Mbele‑Onana
4, Elvira Christelle Kenmegne‑Noumsi
4,
Barbara Linda Kolontchang‑Yomi
4, Boris Judicaël Theubo‑Kamgang
4, Emilienne Régine Ebouki
4,
Chrystelle Karen Djuikam‑Kamga
4, Francine Amougou
4, Liliane Mboumtou
4, Elsie Linda Petchou‑Talla
4,
Christopher Kuaban
1,5and Respiratory Health Survey Group in Cameroon (RHSGC)
Abstract
Background: Obstructive lung disease (OLD), a major global public health problem, has been less investigated in African countries. We assessed the prevalence and determinants of OLD in Yaounde (the capital city of Cameroon), using internationally agreed definitions.
Methods: Participants were adults (age >19 years) screened during a community‑based survey between Decem‑ ber 2013 and April 2014. Air flow limitation (AFL) was based on a pre‑bronchodilator forced expiratory volume in 1 s (FEV1) and forced vital capacity (FVC) below the lower limit of normal (LLN, AFL–LLN). Chronic obstructive pulmonary disease (COPD) was based on post‑bronchodilator FEV1/FVC ratio < LLN (COPD–LLN).
Results: Of the 1287 subjects included, 51.9 % were female, 9.3 % were current smokers and their mean age was 34.4 ± 12.8 years. Forty‑nine (3.8 %, 95 % CI 2.8–4.9 %) participants had AFL–LLN. Thirty‑one subjects had COPD–LLN; giving a prevalence of COPD–LLN of (2.4 %, 95 % CI 1.6–3.3 %). In multivariable analysis, male gender (AOR 2.42; 95 % CI 1.12–5.20) and lifetime wheezing (AOR 2.88; 95 % CI 1.06–7.81) were the determinants of COPD‑LLN. Otherwise, male sex (AOR 1.93, 95 % CI 1.00–3.73), age 40–59 years (AOR 1.99, 95 % CI 1.04–3.81) and lifetime wheezing (AOR 2.65, 95 % CI 1.13–6.20) remained as independent determinants of AFL–LLN.
Conclusions: Obstructive lung disease based on more accurate definitions was relatively infrequent in this popula‑ tion. It is important to sensitize the medical staff and the general public about this condition which should be actively investigated in individuals aged 40 years and above.
Keywords: COPD, Air flow limitation, Associated factors, Africa
© 2016 Pefura‑Yone et al. This article is distributed under the terms of the Creative Commons Attribution 4.0 International License (http://creativecommons.org/licenses/by/4.0/), which permits unrestricted use, distribution, and reproduction in any medium, provided you give appropriate credit to the original author(s) and the source, provide a link to the Creative Commons license, and indicate if changes were made. The Creative Commons Public Domain Dedication waiver (http://creativecommons. org/publicdomain/zero/1.0/) applies to the data made available in this article, unless otherwise stated.
Open Access
*Correspondence: [email protected]
2 Pneumology service, Yaounde Jamot Hospital, P.O Box: 4021, Yaounde,
Cameroon
Background
Chronic obstructive pulmonary disease (COPD) is a major global public health problem. The World Health Organization (WHO) has estimated that about 65 million people suffer from moderate to severe COPD worldwide [1]. A striking issue with COPD is that the condition is often underestimated by the patient, and largely under diagnosed and as a consequence undertreated by medi-cal doctors [2]. The prevalence of COPD varies across regions and can be as high as 10 % or beyond in regions with high prevalence of smoking [3]. COPD is currently the fourth leading cause of death globally, and is set according to WHO estimates to become the third leading cause of death and the fifth provider of disability world-wide by 2030 [1].
Smoking is the leading risk factor for COPD worldwide with the attributable risk fraction of COPD from active smoking ranging from 40 to 70 % across countries [4–6]. With an estimated prevalence of smoking ranging from 8 to 43 % in men and 5 to 30 % in women, and the expand-ing tobacco industry across the continent, COPD is set to become a major health challenge in African countries, alongside other communicable and non-communicable diseases [7]. Although smoking is a major risk factor for COPD, it remains that a large number of those with COPD have no history of smoking habits [8, 9]. Other contributing factors to the global burden of COPD include age greater than 40 years, air pollution, expo-sure to biomass, expoexpo-sure to certain gases, low socio-economic status, genetic factors, history of pulmonary tuberculosis and HIV infection [4, 8].
Published studies on COPD largely originate from developed countries. Very few epidemiological studies have been conducted on COPD in sub-Saharan Africa, although COPD represents the fourth cause of death in low and middle income countries [10]. Indeed, according to WHO’s estimates COPD accounted for 116,000 deaths in Africa in 2001, a contribution similar to that observed in Europe [11]. In a recent systematic review, Finney et al. [6] found only nine cross-sectional studies of acceptable methodological quality on COPD in the general popu-lation in Africa. Efforts to close this knowledge gap will have to overcome the challenge of varying definitions of air flow obstruction and COPD across recommendations. For instance, American Thoracic Society/European Res-piratory Society (ATS/ERS) recommends that the forced expiratory volume in 1 s/forced vital capacity (FEV1/ FVC) ratio < lower limit of normal (LLN) should be used to define COPD, while the global initiative for obstruc-tive lung disease (GOLD) rather recommends that the fixed ratio of FEV1/FCV (<0.70) should be used [12, 13]. In all instances, demonstrating a chronic airflow obstruc-tion not fully reversible after bronchodilator inhalaobstruc-tion
is essential to define COPD [3]. It is against this back-ground that the current study was undertaken with a dual objective of: 1) determining the prevalence of obstructive lung disease (OLD) including air flow limitation (AFL) and COPD in a major city in the Central Africa Region according to the different internationally recommended definitions; and 2) investigating the determinants of these conditions among adults in this setting.
Methods
Type of study, study setting and population
This was a community-based cross-sectional survey conducted between December 2013 and April 2014 (5 months duration) across all the seven districts of Yaounde, the Capital City of Cameroon with about 2 mil-lion inhabitants including 1.4 milmil-lion adults [14]. Con-senting adults aged 19 years and above were considered for inclusion in the study [15]. They had to be free of any of the following conditions: pneumonia in the last 4 weeks, active thoracic tuberculosis, physical or mental impairment affecting the ability to perform spirometry. The study was approved by the institutional ethic review committee of the Faculty of Medicine and Pharmaceuti-cal Sciences of the Douala University and the administra-tive authorities of the Health Delegation for the Centre Region.
Sampling
A three level stratified cluster sampling was applied. At the first level, 16 enumeration areas (EA, 2–3 per dis-trict) were selected using a simple random sampling. EA demarcations were those used in the third general population census conducted in Cameroon in 2005 [14]. Each EA comprised about 140–220 households. At the second level, one in two household was selected using a systematic sampling. The first selected household and the itinerary were those used during the national vacci-nation campaigns. At the third level, all individuals aged 19 years and above in selected households formed the primary statistical unit for data collection.
Data collection
and lifetime smoking below 20 packs in their lifetime), smokers (including those currently smoking and with a lifetime cigarette smoking higher than 20 packs in their lifetime), and former-smokers (including those who had stopped smoking for over 6 months) [16]; 3) past history of respiratory diseases including tubercu-losis, asthma, chronic bronchitis; 4) chronic respiratory symptoms including chronic cough and expectoration (lasting for at least 3 months per year), dyspnea which was graded in four stages (stage 1—shortness of breath while climbing at normal pace on mild inclined surface or a floor of the building, stage 2—shortness of breath while walking at normal pace with age mates on a flat surface, stage 3—shortness of breath while walking at own’s pace on a flat surface, stage 4—shortness of breath at rest or any small effort); 5) exposure to biomass based on the exposure to cooking smoke from solid fuel, and was considered as exposed all participants living for at least 6 months in a household where solid fuel was used for cooking purposes; 6) anthropometric measure-ments including height (meter) measured to the nearest centimeter using a stadiometer, weight (kg) measured with a CAMRY scale (CAMRY, Guangzhou, China), and body mass index calculated as weight (kg)/[height (m)*height (m)].
Spirometric measures
Spirometric data were obtained for all eligible par-ticipants as per standard methods [18], using turbine pneumotachograph (Spiro USB,Care fusion, Yorba Linda-USA) or a Fleisch pneumotachograph (Spirolyser SPL-10 USB, FIM-Medical, Lyon-France), meeting the ATS 1994 standards. All measurements were performed after at least 15 min rest, with the participant in a seated position, with the back straight, and the nose clipped to allow air flow only by mouth. The ATS/ERS acceptabil-ity and reproducibilacceptabil-ity criteria were applied [19]. At least three tests were done by each participant to establish the FVC curve. Spirometric variables measured included: FEV1, FVC and the FEV1/FVC ratio. FEV1 and FVC val-ues retained were the best out of the three tests which fulfilled the acceptability criteria (maximal difference below 5 % or 150 ml). All participants with a FEV1/FCV below the LLN or 0.70 received 400 µg of inhaled salbu-tamol and had the tests repeated 15 min later to assess the reversibility of AFL. Predicted values were estimated using the reference spirometric values for an African population derived by Musafiri et al. [20]. Quality control was done by regularly supervising investigators and tech-nicians who performed spirometry. Spirometry curves were reviewed weekly by one of chest physician involved in the study (EWPY and ADB) and feedback was made to technicians.
All spirometric tests results were reviewed by an expe-rienced chest physician (EWPY or ADB).
Operational definitions
Operational definitions were those recommended by the ATS/ERS (the use of LLN of FEV1/FVC ratio) [13] or by the global initiative for chronic obstructive lung disease (GOLD) [fixed cut-off of 0.70 for the FEV1/FVC ratio] [21]. Air flow limitation (AFL) was defined by a pre-bronchodilator FEV1/FVC < LLN (AFL–LLN) or below 0.70 (AFL–fixed cut-off). COPD was defined by a post-bronchodilator FEV1/FVC below the LLN (COPD–LLN) or below 0.70 (COPD–fixed cut-off). The severity of AFL or COPD was based on the modified 2006 GOLD stages [13]: stage I (mild)—FEV1 >80 % of the predicted value; Stage II (moderate)—FEV1 comprised between 50–80 % of the predicted value; Stage III and IV (severe)— FEV1 <50 % of the predicted value.
Statistical methods
The sample size was calculated by estimating the popu-lation of adults aged 19 years and above to be 1.4 mil-lion. For a type I error of 5 %, an estimated prevalence of 4.5 % for COPD [22], and a precision of 1.5 %, the required sample size was 733 individuals. Considering a correction factor of 1.5 for the cluster effect, and a non-response rate of 10 %, the final estimated sample size was 1210 individuals. Data analysis used the IBM-SPSS v.20 for Windows (IBM, Chicago, USA). Categorical variables were presented as count and frequencies, and continuous variables as mean and standard deviation (SD) or median and 25th–75th percentiles. Group comparisons used Chi square test and Fisher exact test for qualitative variables, and Student’s t test and equivalents for quantitative vari-ables. Logistic regression models were used to investigate the determinants of AFL and COPD. Significant variables in univariable analysis (based on a threshold p <0.10) were entered together in the same multivariable model and the significant ones retained as the final determi-nants. A p value <0.05 was used to characterize statisti-cally significant results.
Results
Study population
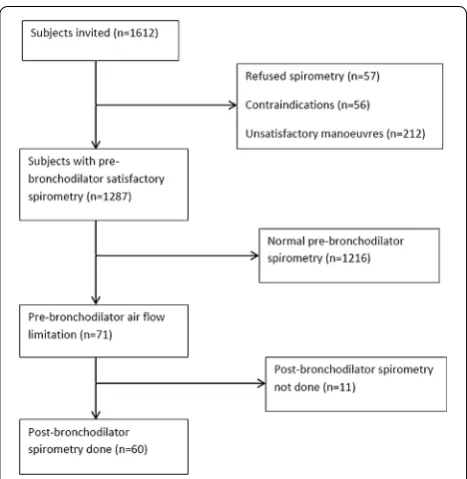
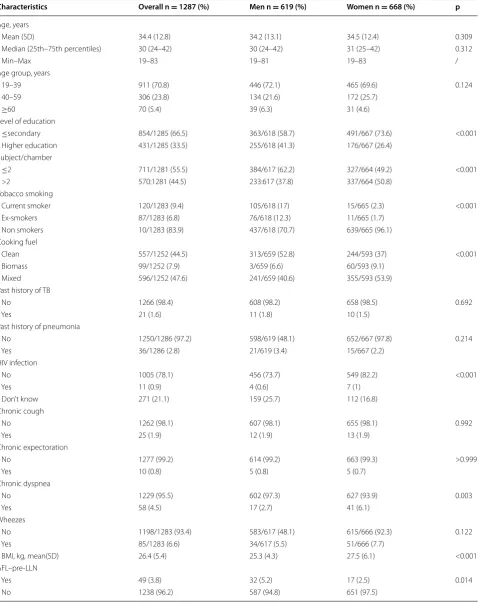
The baseline characteristics of participants are depicted in Table 1. Of the 1287 participants included, 668 (51.9 %) were women and 619 (48.1 %) were men. The mean age was 34.4 ± 12.8 years. Of the 1283 participants with
known status for smoking, 9.3 % were smokers and 6.8 % were ex-smokers. There were more male than female smokers (17 vs 2.3 %, p <0.001). The median (25th–75th percentile) quantity of tobacco smoked was 4.3 (1.2–13.7) pack-years. Only 28 (15.6 %) smokers and ex-smokers had a cumulative quantity of smoked of 20 pack-years or more. Dyspnea was more frequent in women (6.1 %) than in men (2.7 %), p = 0.003. A history of pulmonary
tuber-culosis was found in 21 (1.6 %) participants. Chronic expectoration and lifetime wheezing were found in 0.8 and 6.6 % of the participants, respectively.
Prevalence and severity of obstructive lung disease The prevalence of AFL and COPD are shown in Table 1. Forty-nine (3.8 %, 95 % CI 2.8–4.9 %) participants had AFL–LLN while 9(0.7 %, 95 % CI 0.2–1.2 %) had AFL– fixed ratio. Thirty-three (69.4 %), 13 (26.5 %) and 2 (4.1 %) participants were respectively classified as having mild, moderate and severe AFL–LLN.
Thirty-one participants had COPD–LLN, giving a prevalence of COPD–LLN of 2.4 % (95 % CI 1.6–3.3 %). The prevalence of COPD–fixed ratio was 0.5 % (95 % CI 0.1–0.9 %). Mild, moderate and severe COPD–LLN was respectively found in 67.7, 19.4 and 12.9 % of participants with COPD–LLN.
Determinants of air flow limitation
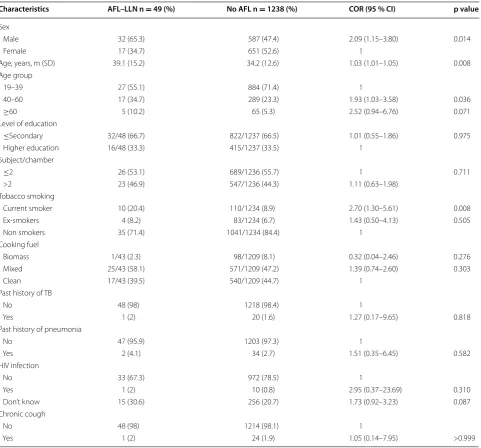
Univariable analysis of determinants of air flow limi-tation (AFL–LLN) is found in Tables 2. In univariable analyses, men were more affected than women (5.2 vs. 2.5 %, p = 0.014). The prevalence of AFL–LLN was much
higher in participants aged 40–59 years (5.6 %), and 60 years and above (7.1 %) than those aged 19–39 years (3 %). Ten (20.4 %) participants with AFL–LLN were cur-rent smokers vs. 110 (8.9 %) in those without AFL–LLN (p = 0.008). The prevalence of AFL–LLN was similar in
participants exposed to biomass than in the non-exposed (3.7 vs. 3.9 %, p = 0.893). The prevalence of AFL–LLN
was higher in participants with self-reported positive status for HIV than in those with unknown HIV sta-tus. Lifetime wheezing was more frequent in partici-pants with AFL–LLN than in those without (14.3 vs. 6.3 %, p = 0.0038). In multivariable analysis including
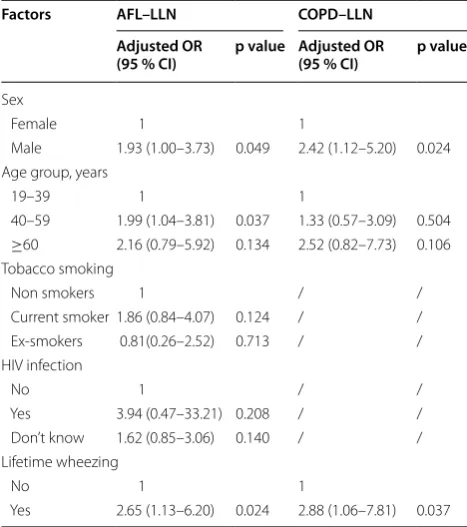
all variables with a p value <0.10, male sex (AOR 1.93, 95 % CI 1.00–3.73), age 40–59 years (AOR 1.99, 95 % CI 1.04–3.81) and lifetime wheezing (AOR 2.65, 95 % CI 1.13–6.20) remained as independent determinants of AFL–LNN (Table 3).
Quality control was done by regularly supervising investigators and technicians who performed spirom-etry. Spirometry curves were reviewed weekly by one of chest physician who participated in the study (EWPY and ADB) and feedback was made to technicians.
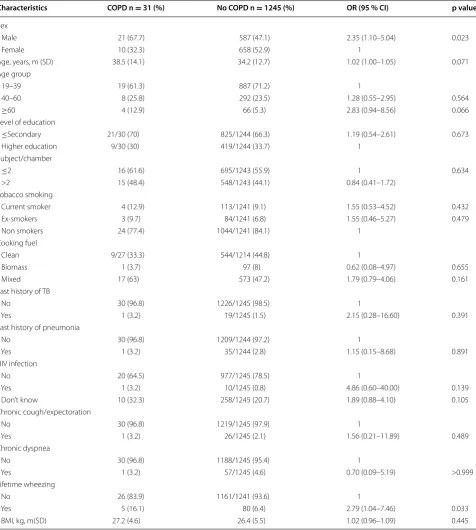
Determinants of COPD
Twenty-one (67.7 %) participants with COPD–LLN and 587 (47.1 %) participants without COPD–LLN were men (p = 0.023). The prevalence of lifetime wheezing was
16.1 % among those with COPD–LLN and 6.4 % among those without (p = 0.033), Table 4. No significant
asso-ciation was found between pulmonary tuberculosis, HIV status, BMI and COPD–LLN (Table 4). In multivariable analysis, male gender (AOR 2.42; 95 % CI 1.12–5.20) and lifetime wheezing (AOR 2.88; 95 % CI 1.06–7.81) were the determinants of COPD–LLN (Table 3).
Discussion
In this study conducted in a major city in sub-Saharan Africa using internationally accepted criteria to define AFL and COPD, the main findings were the follow-ing: 1) the prevalence of airway obstruction was 3.8 and 0.7 % using respectively the LLN and fixed ratio of 0.70 for FEV1/FVC to define airway obstruction; 2) the preva-lence of COPD was 2.4 and 0.5 % using respectively the LLN and fixed ratio to define COPD; 3) determinants of AFL–LLN were male sex, age, and wheezing, while 4) male sex and wheezing were the determinants of COPD–LLN.
[image:4.595.57.291.87.327.2]Table 1 Characteristics of subjects included in the study in Yaounde, Cameroun
Characteristics Overall n = 1287 (%) Men n = 619 (%) Women n = 668 (%) p
Age, years
Mean (SD) 34.4 (12.8) 34.2 (13.1) 34.5 (12.4) 0.309
Median (25th–75th percentiles) 30 (24–42) 30 (24–42) 31 (25–42) 0.312
Min–Max 19–83 19–81 19–83 /
Age group, years
19–39 911 (70.8) 446 (72.1) 465 (69.6) 0.124
40–59 306 (23.8) 134 (21.6) 172 (25.7)
≥60 70 (5.4) 39 (6.3) 31 (4.6)
Level of education
≤secondary 854/1285 (66.5) 363/618 (58.7) 491/667 (73.6) <0.001 Higher education 431/1285 (33.5) 255/618 (41.3) 176/667 (26.4)
Subject/chamber
≤2 711/1281 (55.5) 384/617 (62.2) 327/664 (49.2) <0.001
>2 570:1281 (44.5) 233:617 (37.8) 337/664 (50.8) Tobacco smoking
Current smoker 120/1283 (9.4) 105/618 (17) 15/665 (2.3) <0.001 Ex‑smokers 87/1283 (6.8) 76/618 (12.3) 11/665 (1.7)
Non smokers 10/1283 (83.9) 437/618 (70.7) 639/665 (96.1) Cooking fuel
Clean 557/1252 (44.5) 313/659 (52.8) 244/593 (37) <0.001
Biomass 99/1252 (7.9) 3/659 (6.6) 60/593 (9.1)
Mixed 596/1252 (47.6) 241/659 (40.6) 355/593 (53.9) Past history of TB
No 1266 (98.4) 608 (98.2) 658 (98.5) 0.692
Yes 21 (1.6) 11 (1.8) 10 (1.5)
Past history of pneumonia
No 1250/1286 (97.2) 598/619 (48.1) 652/667 (97.8) 0.214
Yes 36/1286 (2.8) 21/619 (3.4) 15/667 (2.2)
HIV infection
No 1005 (78.1) 456 (73.7) 549 (82.2) <0.001
Yes 11 (0.9) 4 (0.6) 7 (1)
Don’t know 271 (21.1) 159 (25.7) 112 (16.8)
Chronic cough
No 1262 (98.1) 607 (98.1) 655 (98.1) 0.992
Yes 25 (1.9) 12 (1.9) 13 (1.9)
Chronic expectoration
No 1277 (99.2) 614 (99.2) 663 (99.3) >0.999
Yes 10 (0.8) 5 (0.8) 5 (0.7)
Chronic dyspnea
No 1229 (95.5) 602 (97.3) 627 (93.9) 0.003
Yes 58 (4.5) 17 (2.7) 41 (6.1)
Wheezes
No 1198/1283 (93.4) 583/617 (48.1) 615/666 (92.3) 0.122
Yes 85/1283 (6.6) 34/617 (5.5) 51/666 (7.7)
BMI, kg, mean(SD) 26.4 (5.4) 25.3 (4.3) 27.5 (6.1) <0.001 AFL–pre‑LLN
Yes 49 (3.8) 32 (5.2) 17 (2.5) 0.014
[image:5.595.60.540.104.710.2]SD standard deviation, HIV human immunodefiency virus, BMI body mass index, AFL airflow limitation, LLN lower limit of normal, COPD chronic obstructive pulmonary disease
Table 1 continued
Characteristics Overall n = 1287 (%) Men n = 619 (%) Women n = 668 (%) p
AFL–fixed ratio
Yes 9 (0.7) 6 (1) 3 (0.4) 0.263
No 1278 (99.3) 613 (99) 665 (99.6)
COPD–LLN
Yes 31/1276 (2.4) 21/608 (3.5) 10/668 (1.5) 0.023
No 1245/1276 (97.6) 587/608 (96.5) 587/668 (96.5) COPD–fixed‑ratio
Yes 7/1276 (0.5) 4 (0.7) 3 (0.4) 0.715
No 1269/1276 (99.5) 604/608 (99.3) 665/668 (99.6)
Table 2 Factors associated to air flow limitation (AFL–LLN) in univariable analysis
Characteristics AFL–LLN n = 49 (%) No AFL n = 1238 (%) COR (95 % CI) p value
Sex
Male 32 (65.3) 587 (47.4) 2.09 (1.15–3.80) 0.014
Female 17 (34.7) 651 (52.6) 1
Age, years, m (SD) 39.1 (15.2) 34.2 (12.6) 1.03 (1.01–1.05) 0.008 Age group
19–39 27 (55.1) 884 (71.4) 1
40–60 17 (34.7) 289 (23.3) 1.93 (1.03–3.58) 0.036
≥60 5 (10.2) 65 (5.3) 2.52 (0.94–6.76) 0.071
Level of education
≤Secondary 32/48 (66.7) 822/1237 (66.5) 1.01 (0.55–1.86) 0.975 Higher education 16/48 (33.3) 415/1237 (33.5) 1
Subject/chamber
≤2 26 (53.1) 689/1236 (55.7) 1 0.711
>2 23 (46.9) 547/1236 (44.3) 1.11 (0.63–1.98)
Tobacco smoking
Current smoker 10 (20.4) 110/1234 (8.9) 2.70 (1.30–5.61) 0.008
Ex‑smokers 4 (8.2) 83/1234 (6.7) 1.43 (0.50–4.13) 0.505
Non smokers 35 (71.4) 1041/1234 (84.4) 1
Cooking fuel
Biomass 1/43 (2.3) 98/1209 (8.1) 0.32 (0.04–2.46) 0.276
Mixed 25/43 (58.1) 571/1209 (47.2) 1.39 (0.74–2.60) 0.303
Clean 17/43 (39.5) 540/1209 (44.7) 1
Past history of TB
No 48 (98) 1218 (98.4) 1
Yes 1 (2) 20 (1.6) 1.27 (0.17–9.65) 0.818
Past history of pneumonia
No 47 (95.9) 1203 (97.3) 1
Yes 2 (4.1) 34 (2.7) 1.51 (0.35–6.45) 0.582
HIV infection
No 33 (67.3) 972 (78.5) 1
Yes 1 (2) 10 (0.8) 2.95 (0.37–23.69) 0.310
Don’t know 15 (30.6) 256 (20.7) 1.73 (0.92–3.23) 0.087
Chronic cough
No 48 (98) 1214 (98.1) 1
[image:6.595.56.542.101.233.2] [image:6.595.59.541.285.733.2]higher than those found in our study. Globally, the preva-lence of airway obstruction based on pre-bronchodila-tor’s LLN ranges between 9 and 24 % in the 40 year and above age group [24]. The rate of airway obstruction in our study based on pre-bronchodilator’s LLN, both in the total population and in those aged 40 years and above, were at the lower tail of reported figures from around the world.
The prevalence of COPD based on a fixed post-bron-chodilator ratio was 0.5 % in our population, which is lower than the 11–25 % reported rate from other regions around the world [22, 24, 26]. Based on a more appropri-ate definition for our young population (i.e. post-bron-chodilator LLN) to diagnose COPD, the prevalence was 2.1 % in the general population and 3.2 % among those aged 40 years and above [27, 28]. This was lower than the 7–20 % reported elsewhere [24]. However, it was close to the 4.5 % reported by Musafari et al. in Rwanda based on the same definition [22].
The overall low prevalence of airway obstruction in our study regardless of diagnostic criteria is at least in part explained by the low prevalence of smoking in our population. In this study, the prevalence of current and former smoking was 16.2 % and only 15.6 % of smokers and ex-smokers had a cumulative quantity of smoked of 20 pack-years or more. This is at variance with the very high prevalence of smoking in regions with high preva-lence of COPD [24, 25]. The low prevalence of COPD in our study could also be explained by the young age of our sample. This young age however is in keeping with the age structure of the Cameroon population [14]. COPD is more frequent in men than in women in our study in accordance with studies from developed coun-tries [29]. This sex differential was however not found in a recent systematic review conducted by Adeloye et al., which included studies from sub-Saharan Africa [30]. Other well-known risk factors for COPD such as Table 3 Multivariable analysis of factors associated to air
flow limitation and chronic obstructive lung disease
TB tuberculosis, HIV human immunodeficiency virus, AFL air flow limitation, COPD chronic obstructive pulmonary disease, LLN lower limit of normal, OR odd’s ration, CI confidence interval
Factors AFL–LLN COPD–LLN
Adjusted OR
(95 % CI) p value Adjusted OR (95 % CI) p value
Sex
Female 1 1
Male 1.93 (1.00–3.73) 0.049 2.42 (1.12–5.20) 0.024 Age group, years
19–39 1 1
40–59 1.99 (1.04–3.81) 0.037 1.33 (0.57–3.09) 0.504
≥60 2.16 (0.79–5.92) 0.134 2.52 (0.82–7.73) 0.106 Tobacco smoking
Non smokers 1 / /
Current smoker 1.86 (0.84–4.07) 0.124 / / Ex‑smokers 0.81(0.26–2.52) 0.713 / / HIV infection
No 1 / /
Yes 3.94 (0.47–33.21) 0.208 / / Don’t know 1.62 (0.85–3.06) 0.140 / / Lifetime wheezing
No 1 1
Yes 2.65 (1.13–6.20) 0.024 2.88 (1.06–7.81) 0.037
m mean, SD standard deviation, TB tuberculosis, BMI body mass index, AFL air flow limitation, LLN lower limit of normal
Characteristics AFL–LLN n = 49 (%) No AFL n = 1238 (%) COR (95 % CI) p value
Chronic expectoration
No 48 (98) 1229 (99.3) 1
Yes 1 (2) 9 (0.7) 2.85 (0.35–22.91) 0.323
Chronic dyspnoea 1
No 48 (98) 1181 (95.4) 1
Yes 1 (2) 57 (4.6) 0.43 (0.06–3.18) 0.722
Lifetime wheezing
No 42 (85.7) 1156/1234 (93.7) 1
Yes 7 (14.3) 78/1234 (6.3) 2.47 (1.08–5.68) 0.038
BMI, kg, m(SD) 25.8 (4.4) 26.5 (5.45) 0.98 (0.92–1.03) 0.410
Table 2 continued
[image:7.595.58.544.99.243.2] [image:7.595.56.290.422.686.2]pulmonary tuberculosis, HIV infection, exposure to biomass were not associated with LLN–COPD in our study, likely reflecting the low statistical power due to the low prevalence of those characteristics in the gen-eral population.
The potential limitations of this study include the small number of participants’ age 40 years and above, and the inclusion of participants exclusively from urban areas. However, considering that non-tobacco related determi-nants of COPD can operate at any age, the inclusion in Table 4 Factors associated to chronic obstructive pulmonary disease (COPD–LLN) in univariable analysis
OR odd’s ration, M mean, SD standard deviation, TB tuberculosis, BMI body mass index, COPD chronic obstructive pulmonary disease, LLN lower limit of normal
Characteristics COPD n = 31 (%) No COPD n = 1245 (%) OR (95 % CI) p value
Sex
Male 21 (67.7) 587 (47.1) 2.35 (1.10–5.04) 0.023
Female 10 (32.3) 658 (52.9) 1
Age, years, m (SD) 38.5 (14.1) 34.2 (12.7) 1.02 (1.00–1.05) 0.071 Age group
19–39 19 (61.3) 887 (71.2) 1
40–60 8 (25.8) 292 (23.5) 1.28 (0.55–2.95) 0.564
≥60 4 (12.9) 66 (5.3) 2.83 (0.94–8.56) 0.066
Level of education
≤Secondary 21/30 (70) 825/1244 (66.3) 1.19 (0.54–2.61) 0.673
Higher education 9/30 (30) 419/1244 (33.7) 1
Subject/chamber
≤2 16 (61.6) 695/1243 (55.9) 1 0.634
>2 15 (48.4) 548/1243 (44.1) 0.84 (0.41–1.72)
Tobacco smoking
Current smoker 4 (12.9) 113/1241 (9.1) 1.55 (0.53–4.52) 0.432
Ex‑smokers 3 (9.7) 84/1241 (6.8) 1.55 (0.46–5.27) 0.479
Non smokers 24 (77.4) 1044/1241 (84.1) 1
Cooking fuel
Clean 9/27 (33.3) 544/1214 (44.8) 1
Biomass 1 (3.7) 97 (8) 0.62 (0.08–4.97) 0.655
Mixed 17 (63) 573 (47.2) 1.79 (0.79–4.06) 0.161
Past history of TB
No 30 (96.8) 1226/1245 (98.5) 1
Yes 1 (3.2) 19/1245 (1.5) 2.15 (0.28–16.60) 0.391
Past history of pneumonia
No 30 (96.8) 1209/1244 (97.2) 1
Yes 1 (3.2) 35/1244 (2.8) 1.15 (0.15–8.68) 0.891
HIV infection
No 20 (64.5) 977/1245 (78.5) 1
Yes 1 (3.2) 10/1245 (0.8) 4.86 (0.60–40.00) 0.139
Don’t know 10 (32.3) 258/1245 (20.7) 1.89 (0.88–4.10) 0.105 Chronic cough/expectoration
No 30 (96.8) 1219/1245 (97.9) 1
Yes 1 (3.2) 26/1245 (2.1) 1.56 (0.21–11.89) 0.489
Chronic dyspnea
No 30 (96.8) 1188/1245 (95.4) 1
Yes 1 (3.2) 57/1245 (4.6) 0.70 (0.09–5.19) >0.999
Lifetime wheezing
No 26 (83.9) 1161/1241 (93.6) 1
Yes 5 (16.1) 80 (6.4) 2.79 (1.04–7.46) 0.033
[image:8.595.60.537.103.634.2]prevalence studies of COPD of a much broader age range is justified. Exposure to biomass is usually more impor-tant in rural than urban areas, and it is possible that including rural participants could modify some of our findings. van Gemert et al. have recently found the COPD prevalence to be 16.2 % in rural Uganda region with high level of biomass utilisation [31]. Our study also has major strengths. It is the first study in Cameroon and the entire central Africa region to use spirometry to assess the pop-ulation burden of COPD. It is therefore a useful addition to existing studies on this topic from Africa [6, 30].
Conclusions
Airway obstruction was relatively low in this central Afri-can population with low smoking habits, with substantial evidence that the prevalence increased with advanced age. It is important to sensitize the population and deci-sion maker on this likely growing health treats. Larger studies comprising rural participants are needed to refine the findings from the current study.
Abbreviations
AFL: air flow limitation; ATS/ERS: American Thoracic Society/European Respira‑ tory Society; COPD: chronic obstructive pulmonary disease; EA: enumeration areas; FEV1: forced expiratory volume in 1 s; FVC: forced vital capacity; GOLD: global initiative for chronic obstructive lung disease; LLN: lower limit of nor‑ mal; OLD: obstructive lung disease.
Authors’ contributions
EWPY conceived the study, supervised data collection, co‑analysed the data and drafted of the manuscript; APK contributed to data analysis, drafting and critical revision of the manuscript. ADB, JRBN, REM, PINM, CLMO, ECKN, BLKY, BJTK, ERE, CKDK, CGMF, FA, LM, MNY and ELPT collected data, contributed to data analysis and critically revised the manuscript, CK contributed to the conception of study and critical revision of the manuscript; All authors read and approved the final manuscript.
Author details
1 Department of Internal Medicine and Subspecialties, Faculty of Medicine
and Biomedical Sciences, University of Yaounde I, Yaounde, Cameroon. 2 Pneu‑
mology service, Yaounde Jamot Hospital, P.O Box: 4021, Yaounde, Cameroon.
3 South African Medical Research Council & University of Cape Town, Cape
Town, South Africa. 4 Institut Supérieur de Technologie Médicale, Yaounde,
Cameroon. 5 Faculty of Heath Sciences, University of Bamenda, Bamenda,
Cameroon.
Acknowledgements
None.
Competing interests
The authors declare that they have no competing interests.
Received: 11 March 2015 Accepted: 23 November 2015
References
1. World Health Organisation: Burden of COPD (2015), http://www.who.int/ respiratory/copd/burden/en/. Accessed 22 Feb 2015.
2. van Schayck CP, Chavannes NH. Detection of asthma and chronic obstruc‑ tive pulmonary disease in primary care. Eur Respir J Suppl. 2003;39:16s–22s.
3. Gupta RP, Perez‑Padilla R, Marks G, Vollmer W, Menezes A, Burney P. Sum‑ marising published results from spirometric surveys of COPD: the prob‑ lem of inconsistent definitions. Int J Tuberc Lung Dis. 2014;18:998–1003. 4. Johnson P, Balakrishnan K, Ramaswamy P, Ghosh S, Sadhasivam M,
Abirami O, et al. Prevalence of chronic obstructive pulmonary disease in rural women of Tamilnadu: implications for refining disease burden assessments attributable to household biomass combustion. Glob Health Action. 2011;4:7226.
5. Gingo MR, Balasubramani GK, Rice TB, Kingsley L, Kleerup EC, Detels R, et al. Pulmonary symptoms and diagnoses are associated with hiv in the MACS and WHIS cohorts. BMC Pulm. Med. 2014;14:75.
6. Finney LJ, Feary JR, Leonardi‑Bee J, Gordon SB, Mortimer K. Chronic obstructive pulmonary disease in sub‑Saharan Africa: a systematic review. Int J Tuberc Lung Dis. 2013;17:583–9.
7. World Health Organisation: Tobacco control–overview (2014), http:// www.afro.who.int/en/clusters‑a‑programmes/hpr/health‑risk‑factors/ tobacco/overview.html. Accessed 17 Oct 2014.
8. Pai M, Lee C‑H, Lee M‑C, Lin H‑H, Shu C‑C, Wang J‑Y, et al. Pulmonary tuber‑ culosis and delay in anti‑tuberculous treatment are important risk factors for chronic obstructive pulmonary disease. PLoS One. 2012;7:e37978. 9. Arjomandi M, Faner R, Gonzalez N, Cruz T, Kalko SG, et al. Systemic inflam‑
matory response to smoking in chronic obstructive pulmonary disease: evidence of a gender effect. PLoS One. 2014;9:e97491.
10. World Health Organisation: The 10 leading causes of death by country income group (2012) http://www.who.int/mediacentre/factsheets/fs310/ en/index1.html. Accessed 12 Dec 2014.
11. Lopez AD, Mathers CD, Ezzati M, Jamison DT, Murray CJ. Global and regional burden of disease and risk factors, 2001: systematic analysis of population health data. Lancet. 2006;367:1747–57.
12. Global initiative for chronic obstructive lung disease (GOLD): Global strategy for the diagnosis, management and prevention of COPD (2013), http://www.goldcopd.org. Accessed 10 Oct 2014.
13. Pellegrino R, Viegi G, Brusasco V, Crapo RO, Burgos F, Casaburi R, et al. Inter‑ pretative strategies for lung function tests. Eur Respir J. 2005;26:948–68. 14. Bureau Central des Recensements et des Etudes de Population: Rapport
national sur l’etat de la population (2011), http://www.bucrep. Accessed 21 Sep 2014.
15. Organisation Mondiale de la Santé. Les jeunes et la santé: Défi pour la société (1986), http://whqlibdoc.who.int/trs/WHO_TRS_731_fre.pdf. Accessed 15 Jan 2015.
16. Buist AS, Vollmer WM, Sullivan SD, Weiss KB, Lee TA, Menezes AM, et al. The burden of obstructive lung disease initiative (bold): rationale and design. COPD. 2005;2:277–83.
17. Ferris BG. Epidemiology standardization project (American Thoracic Society). Am Rev Respir Dis. 1978;118:1–120.
18. Miller MR, Hankinson J, Brusasco V, Burgos F, Casaburi R, Coates A, et al. Standardisation of spirometry. Eur Respir J. 2005;26:319–38.
19. Brusasco VCRVG. Standardisation des explorations fonctionnelles respira‑ toires. Eur Respir J. 2005;2005(26):19–338.
20. Musafiri S, van Meerbeeck JP, Musango L, Derom E, Brusselle G, Joos G, et al. Spirometric reference values for an East‑African population. Respira‑ tion. 2013;85:297–304.
21. Global Initiative for Chronic Obstructive Lung Disease (GOLD): Global strategy for the diagnosis, management, and prevention of COPD. Execu‑ tive summary (2007), http//www.goldcopd.org/uploads/users/files/ GOLDReport07_0108.pdf. Updated 2007.
22. Musafiri S, van Meerbeeck J, Musango L, Brusselle G, Joos G, Seminega B, et al. Prevalence of atopy, asthma and COPD in an urban and a rural area of an African country. Respir Med. 2011;105:1596–605.
23. Gathuru IM, Bunker CH, Ukoli FA, Egbagbe EE. Differences in rates of obstructive lung disease between africans and african americans. Ethn Dis. 2002;12:S3‑107‑113.
24. Vollmer WM, Gislason T, Burney P, Enright PL, Gulsvik A, Kocabas A, et al. Comparison of spirometry criteria for the diagnosis of copd: results from the bold study. Eur Respir J. 2009;34:588–97.
• We accept pre-submission inquiries
• Our selector tool helps you to find the most relevant journal
• We provide round the clock customer support
• Convenient online submission
• Thorough peer review
• Inclusion in PubMed and all major indexing services
• Maximum visibility for your research
Submit your manuscript at www.biomedcentral.com/submit
Submit your next manuscript to BioMed Central
and we will help you at every step:
26. Ching SM, Pang YK, Price D, Cheong AT, Lee PY, Irmi I, Faezah H, Ruhaini I, Chia YC. Detection of airflow limitation using a handheld spirometer in a primary care setting. Respirology. 2014;19:689–93.
27. Cerveri I, Corsico AG, Accordini S, Niniano R, Ansaldo E, Anto JM, et al. Underestimation of airflow obstruction among young adults using FEV1/ FVC <70 % as a fixed cut‑off: a longitudinal evaluation of clinical and functional outcomes. Thorax. 2008;63:1040–5.
28. Swanney MP, Ruppel G, Enright PL, Pedersen OF, Crapo RO, Miller MR, et al. Using the lower limit of normal for the FEV1/FVC ratio reduces the misclassification of airway obstruction. Thorax. 2008;63:1046–51.
29. Buist AS, Vollmer WM, McBurnie MA. Worldwide burden of COPD in high‑ and low‑income countries. Part 1. The burden of obstructive lung disease (BOLD) initiative. Int J Tuberc Lung Dis. 2008;12:703–8.
30. Adeloye D, Basquill C, Papana A, Chan KY, Rudan I, Campbell H. An estimate of the prevalence of COPD in Africa: a systematic analysis. COPD. 2015;12:71–81.