DC Microgrid Dynamic Performance Assessment and
Enhancement Based on Virtual Impedance Method
Dong Chen, and Lie Xu
Department of Electronic & Electrical Engineering, University of Strathclyde Glasgow G1 1XW, United Kingdom
Abstract— A dynamic performance assessment method is proposed for DC microgrids. With the control scheme modeled as virtual impedance, an actively controlled slack converter terminal of a DC network can be modeled as a circuit branch in S-domain. Using Thevenin's equivalent, transfer functions of a DC microgrid are then deduced. A control scheme is proposed to enhance the dynamics of a DC system with multiple slack terminals. A case study of a multi-terminal DC microgrid is performed to analyze and enhance its dynamics. Time domain simulation and experiments are carried out to validate the proposed analytical and enhancement method.
Keywords— DC microgrid; Dynamic Performance Enhancement; Renewable Power; Virtual Impedance
I. INTRODUCTION
Renewable power and its integration has become one of the mainstream topics in the field of electric power generation and distributions. Since renewable energy are naturally dispersed and with relatively large power variation, microgrid is becoming a promising solution to the utilization of renewable energy as it takes a systematic view on the integration of renewable sources, energy storages, load and utility grid interface to minimize the local power variation [1]. Many renewable sources such as PV converter [2][3], wind turbine converter [4] and tidal power converter[5] various batteries and Grid-side Voltage Source Converter (GVSC) have DC stages, a DC microgrid can be formed by connecting all these DC links and DC loads together [4-8]. The total system cost can be reduced with lower cost on DC/AC converters and higher efficiency can be anticipated as the power generated can be stored and/or consumed locally.
In the past few years, numerous studies have been carried out on the topic of DC microgrids concerning control configurations[9][10] and general strategies [11-21], power adaptor design[22], protection [23] and operation behavior [24-28].
For an autonomously controlled DC system, the control is based on local DC voltage detections [14][15]. As the renewable sources and loads usually operate at Maximum Power Point Tracking (MPPT) [2-5] and plug-and-play manner in a DC microgrid, it is possible that large renewable power fluctuation and load switching could cause large DC voltage variation, which may give rise to unnecessary transition actions of certain terminal converters. Therefore, it
is essential to assess the dynamic performance and to incorporate certain control scheme to enhance the performance of a certain DC microgrid in case of possible undesirable transitions.
The analysis of a DC system’s dynamic performance concerns its modeling and proper assessment method [24-28]. The proper modeling of actively controlled DC terminals is another major issue as a Pulse Width Modulated (PWM) converter with associated control system needs to be integrated into a DC system model. Switching models of such converters are usually used in time domain simulation for accuracy concern. However, the non-linear details of PWM will make the establishment of analytical model for general stability assessment very complicated [24-26]. By neglecting the modulation process, average model can be obtained, which can describe a converter with linear transfer functions. By simplifying the current/power loop of converter, a very simple virtual resistance model of a converter can be established to analyze the static power flow [13]. However such model does not apply to dynamic performance assessment with sophisticated control. Virtual impedance method is proposed to assess the dynamic performance of a DC system with fairly simple modeling procedure [28], but has not yet been deeply investigated with simulation and experimental validations.
In order to assess the dynamic performance of a DC microgrid, various methods can be employed for performance or stability assessment criteria, namely: Lyapunov energy equation, root locus, Routh Test, Jury Test, open-loop margin analysis, etc. Among the aforementioned methods, Lyapunov energy equation is a method applies to both linear and non-linear models, whereas the others are for non-linear models only. As is reported, the method of Lyapunov equations can be used to assess a DC microgrid’s stability and help to stabilize the DC system with fast real time communication [26]. However, the demand for high-bandwidth communication undermines the system’s reliability and makes it less practical for a DC system whose incorporated terminals are not closely located.
A virtual impedance method is proposed for assessing and enhancing the dynamics of a DC microgrid in this paper. With this method, the converter terminals of a DC microgrid are modeled as virtual impedances in S-domain with converter control dynamics considered. This paper is organized as
follows. Section II introduces the principles of the virtual impedance method. System dynamics of single and multiple slack terminal systems are described in Section III and IV respectively. Section V describes the experimental validation and finally conclusions are drawn in Section VI.
II. DCMICROGRID MODELING USING VIRTUAL
IMPEDANCE METHOD
The terminals of DC microgrids can be categorized into slack terminal and power terminal. The former one refers to the terminals that are actively stabilizing the DC system whereas the latter category refers to the ones that are operating on their own merits [19]. In order to balance the power flow, there must be at least one slack terminal in operation in a DC microgrid. In this section, the principles of virtual impedance method are presented.
A. Modeling of a single slack terminal
Fig. 1(a) shows a simple locally controlled slack terminal which consists of a capacitor C connected to a DC bus, and a converter modeled as a controlled current source regulating the DC bus voltage [28]. In Fig. 1(a), ir refers to the converter current, ic the DC capacitor charging current and ip the perturbation current from any load/source (e.g. renewable power generation) connected to the common DC bus.
[image:2.595.336.528.241.308.2]
(a) Simplified circuit (b) DC Voltage control diagram Fig. 1. Locally controlled DC terminal
Fig. 2. Locally controlled DC bus equivalent circuit in S-domain
Using high bandwidth current control technique [29-30], the dynamics of the current control loop can usually be neglected when analyzing DC system dynamics and the cascaded voltage regulation scheme can be simplified as Fig. 1(b), where Vref is the local DC voltage control reference and
Reg(S) refers to the transfer function of the voltage regulator. As load consumption and renewable power generation normally depend on external factors, ip is considered as noise
input in Fig. 1(b). From Fig. 1(b), there is:
( ) ( )
1
( ) ( )
ref dc
r
V S V S
Reg S i S
(1)
Considering Vref as a virtual DC voltage source, 1/Reg(s)
can therefore be defined as the virtual impedance between the DC source and the DC capacitor. Thus the equivalent circuit in
S-domain can be given as shown in Fig. 2. Considering Figs. 1(b) and 2, the open-loop transfer function of the voltage control scheme can be obtained as
( ) ( ) Reg S
G S CS
(2)
B. Modeling of power terminal with remote slack terminal
For a power terminal whose voltage is controlled by a remote slack terminal, the system can be given as Fig. 3. The DC transmission cable is often modeled as a group of π sections. Since the cable capacitances are usually much smaller than the lump DC bus capacitance in a DC microgrid system, it is reasonable to neglect the cable capacitance and reduce the number of π section to one. As shown in Fig. 3, Rl
and Ll refer to the cable resistance and inductance respectively.
Fig. 3. A local power terminal controlled by a remote slack terminal
(a) Equivalent circuit in S domain
(b) Simplified equivalent circuit in S-domain
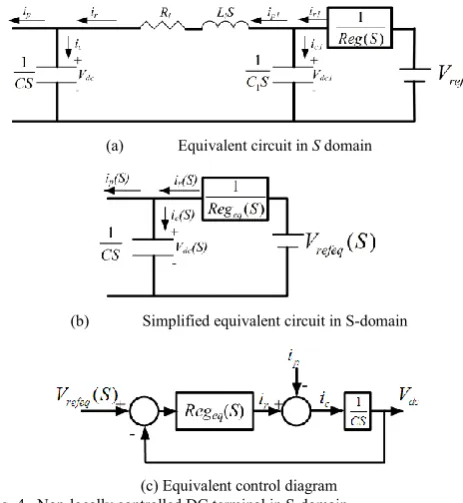
[image:2.595.313.545.333.585.2](c) Equivalent control diagram Fig. 4. Non-locally controlled DC terminal in S-domain
Applying similar S-domain modeling method shown in Fig. 2, the equivalent circuit of Fig. 3 can be redrawn as Fig. 4(a). Using Thevenin’s Theorem, Fig. 4(a) can be transformed into the format of Fig. 4(b) and the equivalent control diagram can be expressed in Fig. 4(c). The transfer functions of the equivalent voltage reference Vrefeq and regulator Regeq are
given as
1
( ) ( )
( )
refeq ref
Reg S
V S V
Reg S C S
[image:2.595.37.291.348.516.2]1 1
( ) ( )
( )( ( ) ) 1
eq
l l
Reg S C S Reg S
L S R Reg S C S
(4)
From Fig. 4(c) the Open-loop transfer function of the DC voltage on the power terminal can be given by
( )
( ) eq
eq
Reg S G S
CS
(5)
Substituting (4) into (5) yields
1 1
( ) 1
( )
( )( ( ) ) 1
eq
l l
Reg S C S G S
L S R Reg S C S CS
[image:3.595.319.559.53.247.2] (6)
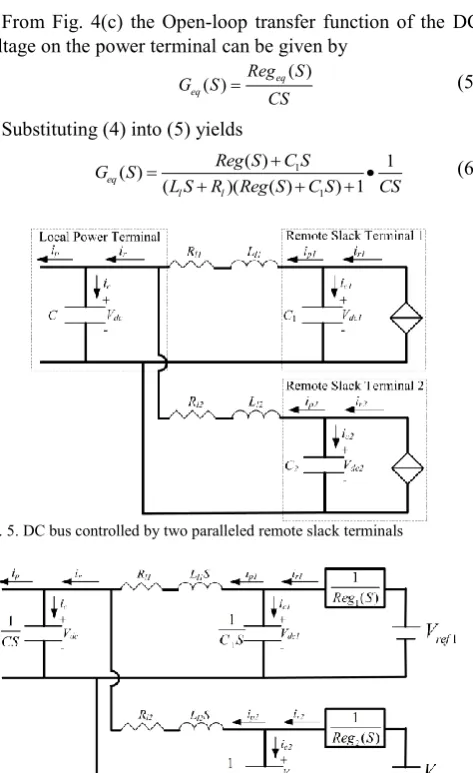
Fig. 5. DC bus controlled by two paralleled remote slack terminals
Fig. 6. S-domain equivalent circuit of DC bus controlled by two paralleled remote slack terminals
C. Modeling of a system with two slack terminals
In a DC microgrid, it is possible that more than one slack terminals, e.g. G-VSC or energy storage system (ESS) used for power balancing for instance, are in operation. Situation varies according to system configurations and in this section a two-slack-terminal system as shown in Fig. 5 is studied and the methodology used can be extended to systems with multiple slack terminals with different connections.
[image:3.595.48.285.79.466.2]Adopting similar methods previously used, the system in Fig. 5 can be transformed into Fig. 6 in S-domain, where Reg1 and Reg2 refer to the transfer functions of the two slack terminal regulators respectively.
Using Thevenin’s Theorem in S-domain from the power terminal side, the circuits in Fig. 6 can also be simplified in the format given in Fig. 4(b) where the virtual voltage source
Vrefeq(S) and regulator Regeq(S) are
1 1 2 2
1 2
( ) ( ) ( ) ( )
( )
( ) ( )
refeq eq refeq eq
refeq
eq eq
V S Reg S V S Reg S
V S
Reg S Reg S
(7)
1 2
( ) ( ) ( )
eq eq eq
Reg S Reg S Reg S
(8) where
1 1 1 1 1 1 1 2 1 1 1 1 1 1 1 1 1 ref refeq l l l l eq V S C S Reg S Reg S V S C R S C L S Reg R S L S C S Reg S Reg (9)
2 2 2 2 2 2 2 2 2 2 2 2 2 2 2 2 1 ref refeq l l l l eq V S C S Reg S Reg S V S C R S C L S Reg R S L S C S Reg S Reg (10)The corresponding open-loop DC voltage transfer function of a 2-slack-terminal system can also be given by (5). For systems with more than two operating slack terminals, the simplified equivalent circuit shown in Fig. 4(b) can also be reached using the fore cited virtual impedance method along with Thevenin’s Theorem hence the corresponding transfer functions. Thus, the simplified control block diagram of a DC system with any slack terminal can be given as Fig. 4(c) shows.
III. DYNAMICS OF A MULTIPLE-SLACK-TERMINAL SYSTEM
A. System transfer function
For a grid-connected DC microgrid system, the DC voltage is normally controlled by a G-VSC with Proportional-Integration (PI) regulator. Considering the control delay caused by digital control system, the transfer function of the virtual admittance Reg(S) for G-VSC can be configured as
( ) ( iG)
Z pG
K
Reg S D K C
S
(11)
0 2
0 2
pG
iG K
K
(12) where DZ is the transfer function of the control delay, ξ is the
damping coefficient and ω0 is the natural frequency.
In a practical real-time digital control system, the implementation of current/power loop and sampling sequence will give rise to output delay as the updated PWM duty cycle cannot take into effect immediately at the sampling point. By using the technique of predictive current and direct power control [29][30], the output is normally able to follow its order within one switching period as long as there is no modulation saturation. Thus it is reasonable to model the power/current loop of a VSC or DC/DC converter based slack terminal as a unit delay 1/Z (a full switching period Ts delay). The unit delay is often approximated by a 1st order low-pass process 1/(1+TS) or even neglected for simplification when the
frequency being studied is much smaller than 1/TS. Generally,
[image:3.595.46.284.360.488.2]The circuit depicted in Fig. 5 with two remote slack terminals is used for studying the dynamics using virtual impedance method in this section. Slack terminal 1 (Reg1) and its relevant cable parameters (Rl1, Ll1, C1) are fixed to the same initial values of the single-slack terminal case previously shown whereas slack terminal 2 (e.g., ESS) is controlled to absorb high frequency power ripples within the DC microgrid and its average power is set at zero. It uses a droop based regulator with lead-lag correction and high-pass filter as:
1 2
2
(1 )
( )
(1 ) 1
pE h
h
K T S T S
Reg S
T S T S
(13)
The equivalent Open-loop transfer function for the power terminal controlled by two paralleled slack terminals can be given as
1 1
2
1 1 1 1 1 1
2 2
2
2 2 2 2 2 2
1 1
1 1 1 1
( ) ( ) [
( ) ( ) 1
( ) 1
+ ]
( ) ( ) 1
1
( )
1 [
1
( )[ ( ) ] 1
1
eq
l l l l
l l l l
iG pG s
iG
l l pG
s
Reg S C S G S
L S R Reg S L C S R C S Reg S C S
CS L S R Reg S L C S R C S
K
K C C S
T S S
K
L S R K C C S
T S S
1 2 2 2 1
2 2 2 2
2
(1 )
(1 )(1 )(1 ) 1
]
(1 )
( )[ ] 1
(1 )(1 )(1 )
pE h
s h
pE h
l l
s h
K T S T S
C C S T S T S T S
K T S T S CS
L S R C C S
T S T S T S (14)
The close-loop transfer functions are
( )
( ) ( )
( ) ( ) 1 ( )
eq
dc r
refeq p eq
G S
V S i S
V S i S G S
(15)
) ( 1 ) ( 1 1 ) ( ) ( S Reg CS S G CS S i S V eq eq p dc
(16)
B. System stability and dynamics
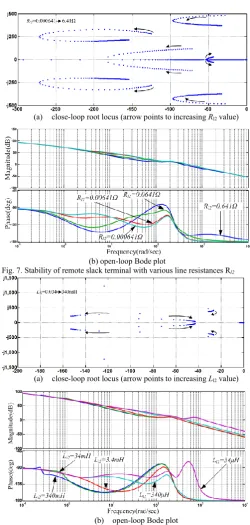
Again, a parametric study of the remotely controlled power terminal stability is carried out based on the derived transfer functions. The parameters are given as: C=0.138 p.u. (32 mF, based on Pn = 2MW, Vn = 1200V, f = 50Hz), C1 = 0.276 p.u. (64 mF), Rl1 = 0.89 p.u.(0.641 Ω), Ll1=0.148 p.u. (0.34 mH),
ω0 = 20π rad/sec, ξ=1, T1=0.004, T2=0.02, Th=0.5, KpE/KpG=10,
Rl2=0.0089 – 0.89 p.u.(0.641-641 mΩ), L12=0.0148 to 148 p.u.
(0.034 mH to 340 mH).
The close-loop root locus and the corresponding open-loop Bode plot when the second line resistance is varied from 0.0089 – 0.89 p.u.(0.641-641 mΩ) are given in Figs. 7 (a) and (b), respectively. From Fig. 7(a), system damping is improved when Rl2 is increased initially from very small value, but
becomes degraded after reached a certain value. Similar to the case of single slack terminal, the gap between phase response and -180 degree are wider on the higher frequency side hence reduced high frequency oscillation with increased cable resistance. On the other hand, increasing resistance also push
the phase response on lower frequency side closer to -180 degree and therefore there can be more severe oscillation if 0-dB line are within this lower band. Meanwhile, the large resistive variation on the second transmission line does not significantly change system’s phase margin and damping due to increased system size. In this case shown by Fig. 7(b), the 0 dB frequency are all around 350-500 rad/sec and the largest phase margin appears at Rl2 = 0.089 p.u. (64.1 mΩ), which is
followed by 0.89 p.u. (641 mΩ), 0.0089 (6.41 mΩ) and 0.00089 p.u. (0.641 mΩ).
(a) close-loop root locus (arrow points to increasing Rl2 value)
[image:4.595.305.556.174.700.2](b) open-loop Bode plot
Fig. 7. Stability of remote slack terminal with various line resistances Rl2
(a) close-loop root locus (arrow points to increasing Ll2 value)
[image:4.595.39.289.242.470.2](b) open-loop Bode plot
Fig. 8 shows the corresponding root locus and open-loop Bode plot when the cable inductance connecting the second slack terminal Ll2 is increased from 0.0148-148 p.u.(0.034-340 mH ). As seen, smaller connection inductance improves the phase margin in Fig. 8(b) and the best damping performance appears at the lowest Ll2 value. Again, the impact caused by the inductance variation on the second transmission line is not as significant as the case when there is only one slack terminal shown previously.
Fig. 9. Prototype DC microgrid configuration
IV. EXPERIMENTAL STUDY
In order to validate the analytical method, a prototype DC microgrid is established as is shown in Fig. 9. The nominal DC voltage is set at 100 V. A 1 kW G-VSC connects the DC bus with the 415V 3-phase AC grid. A 600 W permanent magnet synchronous generator (PMSG) is used as the variable generation (e.g., wind power) and a bi-directional DC/DC converter with a 36 V / 20 Ah battery system acts as the additional DC slack terminal whose aim is to suppress DC voltage variation and smooth the power exchange between the G-VSC and the AC grid by absorbing power oscillations produced by the variable generation.
A. Power step test
In order to test system dynamic performance with the second slack terminal, i.e., the ESS acting as power smoother for the G-VSC, load steps and generation power steps are applied to the system.
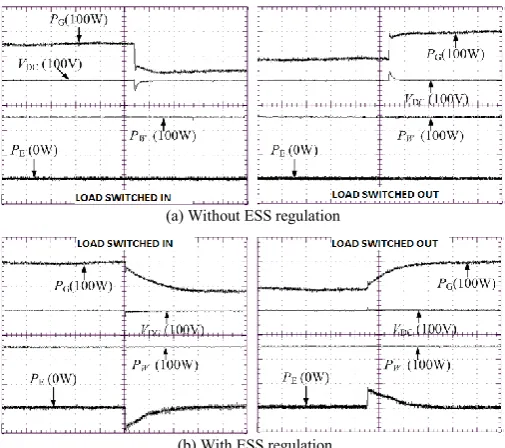
Fig. 10 compares system operation with and without ESS smoothing during same load switching. In Fig. 10(a), the system starts with a constant generation power Pw=100 W flowing into the microgrid. The voltage is solely regulated by the G-VSC (PG). At 1.25 s, a DC load of 190 W is switched which gives rise to an immediate 4 V DC voltage dip (for load switched in) and rise (for load switched out). Consequently, the G-VSC regulates its power to the DC microgrid from the AC side to accommodate the power imbalance hence a maintained DC voltage. For the case in Fig. 10(b) with ESS, the DC voltage is controlled by both the G-VSC and ESS (PE). When the same load is switched resulting in a sudden power imbalance, both the ESS and G-VSC actively compensate the power immediately. As the ESS regulator acts much faster
than the G-VSC, most power ripple is compensated by the ESS initially. The high-pass filter of the ESS regulator (as it is designed to absorb power oscillation only) drives the ESS power back to 0 and the power/current imbalance eventually compensated by the G-VSC. As the additional slack terminal improves dynamic response of the DC voltage loop, the DC voltage change is reduced to less than 2 V.
Fig. 11 compares the effect of power smoothing by the ESS (second slack terminal) during continuous power variation caused by the PMSG. During the test a 190 W load is initially connected to the microgrid. The generation power outputs an average power of 200 W with a repetitive random power fluctuation of 0.5 s (due to limited memory in the experimental system). Before the ESS is activated (i.e., with one G-VSC slack terminal only), large DC voltage variation can be seen due to the G-VSC voltage regulator’s limited band-width (natural frequency of 20π rad/s). At 3.9 s, the ESS is activated (i.e. second slack terminal is activated). The power fluctuation of higher frequency goes to the ESS whereas power goes to the G-VSC is greatly smoothed and the DC voltage variation is significantly reduced.
(a) Without ESS regulation
(b) With ESS regulation
Fig. 10. Operation during small load switching (10V/DIV, 200W/DIV/, 250ms/DIV)
[image:5.595.306.559.317.541.2] [image:5.595.333.526.570.677.2]B. Dynamic response test considering impedance variation
The tests in this section correspond to previous parametric analysis on the dynamic performance of a DC microgrid with various cable impedances and terminal capacitances. As it is very difficult to realize very large variation of a single impedance value in a lab-based implementation, moderate impedance variations are carried out to show the general tendency.
[image:6.595.36.291.267.542.2]Impedances of R1 and Ll are placed at point A (shown in Fig. 9) to simulate the cable impedance between the power terminal (Generation) and slack terminal (G-VSC). ESS terminal is located beside the power terminal to optimize the dynamic performance. Meanwhile the terminal control configurations are identical to the case study of the last section. By varying the impedances and terminal capacitances as shown in Table I, three tests are carried out.
Table I Impedance configuration for dynamic response test Test C1(μF) C2(μF) Rl (Ω) Ll (mH) Waveform
I 1000 2000 0.25 2 Fig. 12
II 1000 2000 0.25 0 Fig. 13
III 1000 1000 0.25 2 Fig. 14
(a) Without DC power conditioning
(b) With DC power conditioning
Fig. 12. Dynamic response for DC power conditioning-1 (10V/DIV, 200W/DIV/, 500ms/DIV)
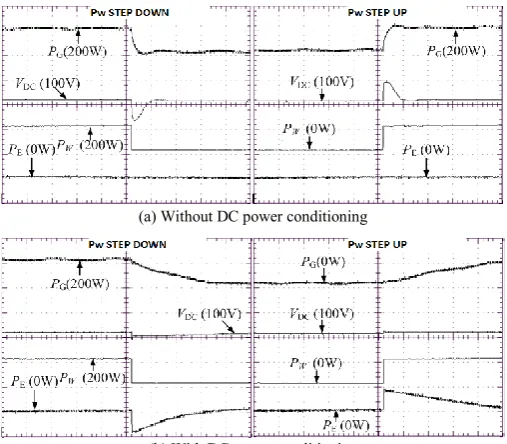
Fig. 12 shows the result of Test I in this section. In this test, the G-VSC capacitance is adjusted to 1000 μF while the generation side is 2000 μF. Addition line impedances of
Rl=0.25 Ω and Ll= 2 mH are added to the DC system. Significant transient voltages can be seen in Fig. 12(a): the generation terminal voltage is decreased by 8.5 V during 200 W power step down and increased by 8 V during 200 W power step up when the ESS power conditioning is not activated. Such “long-lasting” (last in 0.4 S) big voltage variation may trigger unexpected level switching in the autonomously controlled DC microgrid [15]. In the results
shown in Fig. 12(b), the ESS DC power conditioner is activated. As a result, the DC voltage variation is reduced to less than 3 V during both steps. This test shows that the local voltage suppression method suggested in Section IV works well with considerable cable impedance.
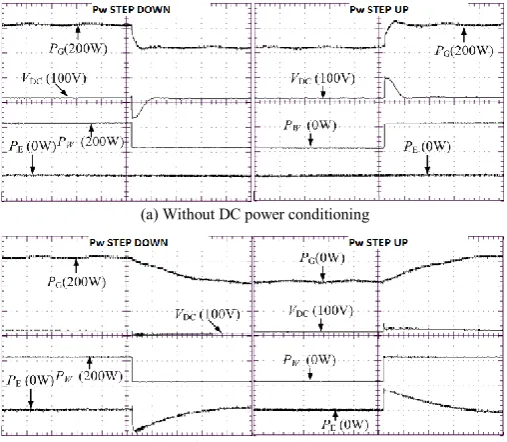
The test results shown in Fig. 13 are for the line inductance
Ll of 0. Compared to Fig. 12(a) it shows that the transient DC voltage variations are slightly reduced: 8V for power step-down and 7 V for step-up. This is because the reduction of cable inductance reduces the low frequency voltage variation during transients as similar tendency can be seen in Figs. 8 and 9. Again, when the ESS is on, the corresponding voltage variations as seen in Fig. 13(b), are further reduced to 1 V and 0.5 V respectively. Figs. 12 and 13 generally show that the inclusion of line inductance can cause extra voltage variation.
Test results demonstrated by Fig. 14 are also based on Fig. 12 with the generation side capacitance C2 reduced from 2000 μF to 1000 μF. Extra high frequency voltage variation (0.5 V) was discovered though not easily visible in Fig. 14 (a). Extra high frequency variation also exists when ESS conditioner is in operation as shown in Fig. 14 (b) (approximately 1 V in each step transients). This result shows that the reduction of generation/load side capacitance tends to introduce high frequency voltage variation during transients.
(a) Without DC power conditioning
(b) With DC power conditioning
Fig. 13. Dynamic response for DC power conditioning-2 (10V/DIV, 200W/DIV/, 500ms/DIV)
V. CONCLUSIONS
In this paper, a simple DC microgrid analytical method namely, virtual impedance method is introduced. With the control dynamics modeled as virtual impedance, a DC microgrid system can be easily modeled as S-domain circuits. Based on this method, parametric study can be performed in
[image:6.595.306.560.351.573.2]analysis and simulation, and verifies the effectiveness of the analytical method.
(a) Without DC power conditioning
(b) With DC power conditioning
Fig. 14. Dynamic response for DC power conditioning-3 (10V/DIV, 200W/DIV/, 500ms/DIV)
REFERENCES
[1] R.H. Lasseter, "Microgrids [2.distributed power generation]," IEEE Power Engineering Society Winter Meeting 2001, vol. 1, pp.146-149, 28 Jan-1 Feb. 2001.
[2] R. Kadri, J.P. Gaubert, and G. Champenois, "An improved maximum power point tracking for photovoltaic grid-Connected inverter based on voltage-oriented control," IEEE Trans. Ind. Electron., vol. 58, no. 1, pp. 66-75, Jan. 2011.
[3] B.N. Alajmi, K.H. Ahmed, S.J. Finney and B.W. Williams, "A Maximum Power Point Tracking Technique for Partially Shaded Photovoltaic Systems in Microgrids," IEEE Trans. Ind. Electron., vol. 60, no 4, pp.1596-1606, Apr. 2013
[4] E. Koutroulis, and K. Kalaitzakis, "Design of a maximum power tracking system for wind-energy-conversion applications," IEEE Trans. Ind. Electron., vol. 53, no. 2, pp. 486- 494, Apr. 2006
[5] M.J.,Jahromi, AI Maswood, T. King-Jet, "Design and Evaluation of a New Converter Control Strategy for Near-Shore Tidal Turbines," Industrial Electronics, IEEE Trans. Ind. Electron., vol. 60, no. 12, pp. 5648-5659, Dec. 2013
[6] A. Sannino, G. Postiglione, and M.H.J. Bollen, "Feasibility of a DC network for commercial facilities," IEEE Trans. Ind. Appl., vol. 39, no. 5, pp. 1499- 1507, Sept.-Oct. 2003
[7] Y. Ito, Y. Zhongqing, and H. Akagi, “DC microgrid based distribution power generation System”, in Proc. IPEMC, Xi’an, China, Aug. 2004, pp. 1740-1745.
[8] K. P. Logan, “Intelligent diagnostic requirements of future all-electric ship integrated power system”, IEEE Trans. Ind. Appl., vol. 43, no. 1, pp. 139–149, Jan. 2007.
[9] J. M. Guerrero, J. C. Vasquez, J. Matas, L. G. Vicuna, and M. Castilla, "Hierarchical control of droop-controlled AC and DC microgrids—A general approach toward standardization", IEEE Trans. Ind. Electron., vol. 58, no. 1, pp.158 -172, Jan. 2011
[10] J. Guerrero, M. Chandorkar, T. Lee, and P. Loh, “Advanced control architectures for intelligent microgrids—Part II: Power quality, energy storage, and AC/DC microgrids,” IEEE Trans. Ind. Electron., vol. 60, no. 4, pp. 1263–1275, Apr. 2013.
[11] D. Salomonsson, L. Soder, and A. Sannino, "An adaptive control system for a DC microgrid for data centers," IEEE Trans. Ind. Appl., vol. 44, no. 6, pp. 1910-1917, Nov.-Dec. 2008
[12] H. Kakigano, Y. Miura, and T. Ise, "Low-voltage bipolar-type DC microgrid for super high quality distribution," IEEE Trans. Power Electron., vol. 25, no. 12, pp. 3066-3075, Dec. 2010
[13] P. Karlsson, and J., Svensson, "DC bus voltage control for a distributed power system," IEEE Trans. Power Electron., vol. 18, no. 6, pp. 1405-1412, Nov. 2003
[14] J. Schonberger, R. Duke, S.D. Round, "DC-bus signaling: A distributed control strategy for a hybrid renewable nanogrid," IEEE Trans. Ind. Electron., Vol.53, No.5, pp.1453-1460, Oct. 2006
[15] D. Chen, L. Xu, and L. Yao , "DC Voltage Variation Based Autonomous Control of DC Microgrids," IEEE Trans. Power Del., vol.28, no.2, pp.637,648, April 2013
[16] T. Zhou, and B. Francois, "Energy management and power control of a hybrid active wind generator for distributed power generation and grid integration," IEEE Trans. Ind. Electron., vol. 58, no. 1, pp. 95-104, Jan. 2011
[17] W. Tang, and R.H. Lasseter, "An LVDC industrial power distribution system without central control unit," in Proc. IEEE 2000 Power Electronics Specialists Conference, PESC 00., Vol. 2, pp. 979-984 vol.2, 2000.
[18] L. Xu, and D. Chen, "Control and Operation of a DC Microgrid With Variable Generation and Energy Storage," IEEE Trans. Power Del., vol.26, no.4, pp.2513-2522, Oct. 2011
[19] D. Chen, and L. Xu, “Autonomous DC voltage control of a DC microgrid with multiple slack terminals,” IEEE Trans. Power Syst., vol. 27, no.4,pp. 1897-1905, Nov.2012
[20] X. Lu, K. Sun, J.M. Guerrero, J.C. Vasquez, L. Huang, "State-of-Charge Balance Using Adaptive Droop Control for Distributed Energy Storage Systems in DC Microgrid Applications," IEEE Trans. Ind. Electron., vol. 61, no.6, pp.2804-2815, June 2014
[21] M. Sechilariu, B. Wang, and F. Locment, "Building integrated photovoltaic system with energy storage and smart grid communication", IEEE Trans. Ind. Electron., vol. 60, no. 4, pp.1607 -1618, Apr. 2013
[22] H. Valderrama-Blavi, J. M. Bosque, F. Guinjoan, L. Marroyo, and L. MartÃ-nez-Salamero, "Power adaptor device for domestic dc microgrids based on commercial MPPT inverter", IEEE Trans. Ind. Electron., vol. 60, no. 3, pp.1191 -1203 2013
[23] D. Salomonsson, L. Soder, and A. Sannino "Protection of low-voltage DC microgrids", IEEE Trans. Power Del., vol. 24, no. 3, pp.1045 - 1053 , 2009.
[24] R. S. Balog, W. W. Weaver, and P. T. Krein, "The load as an energy asset in a distributed DC Smart Grid architecture," IEEE Tran. Smart Grid, vol 3, no.1, pp.253-260, Mar. 2012
[25] A.AA. Radwan, and Y.A.-RI Mohamed, "Linear Active Stabilization of Converter-Dominated DC Microgrids," IEEE Trans. Smart Grid, vol, 3, no.1, pp.203-216, Mar. 2012
[26] P. Magne, B. Nahid-Mobarakeh, and S. Pierfederci, "General active global stabilization of multi-loads DC-Power networks," IEEE Trans. Power Electron., vol 27, no.4, pp.1788-1798, Apr. 2012
[27] S. Anand, and B. Fernandes "Reduced order model and stability analysis of low voltage DC microgrid", IEEE Trans. Ind. Electron., vol. 60, no. 11, pp.5040 -5049, Nov. 2013
[28] D. Chen, L. Xu, and L. Yao, "DC network stability and dynamic analysis using virtual impedance method," in Proc. 38th Annual Conference of the IEEE Industrial Electronics Society (IECON 2012), pp.5625-5630.
[29] J. Hu, Y. He, L. Xu, and D. Zhi, "Predictive current control of grid-connected voltage source converters during network unbalance," IET Power Electronics, vol.3, no.5, pp.690-701, Sept. 2010.
[image:7.595.36.290.92.313.2]