MODELLING THE IMPACT OF MICRO GENERATION ON THE ELECTRICAL
DISTRIBUTION SYSTEM
Nick Kelly, Stuart Galloway, Ian Elders, Ryan Tumilty and Graeme Burt
University of Strathclyde, Institute for Energy and Environment, Glasgow, UK
ABSTRACT
In the UK and elsewhere there is considerable debate as to the future form of the electricity distribution system. The coming years will see a rise in the amount of micro-generation connected to the network at low voltages and the emergence of highly-distributed power systems (HDPS). However, there is considerable uncertainty as to the impact that this micro-generation will have on the quality of power supplied to our homes or to the stability of the electricity system as a whole. To address these engineering challenges the UK Engineering and Physical Sciences Research Council (EPSRC) is funding a three year research programme featuring a multi-disciplinary team from a variety of UK Universities: Supergen HDPS. This paper documents one piece of work emerging from the consortium, where a multi-tool approach is used to analyse the impact of micro-generation on the electricity system. This used a building simulation tool to produce electrical generation profiles for domestic cogeneration device models. These, along with profiles produced for other micro-generation technology models and electrical load profiles are then replicated and aggregated using a customised statistical approach. The profiles were then used as boundary conditions for a set of electrical load flow simulations on a model of a section of real network, where the number of micro-generators was varied according to different scenarios for the future of the UK electricity grid. The results indicate that a significant number of micro-generation devices can be accommodated before any power quality problems arise, however this is dependent upon maintaining a robust central grid.
INTRODUCTION
Previous studies have investigated the issues surrounding the connection of a large number of micro-generators in a small area of network such as a new build housing development (Smart et al 2006; Cranfield et al 2003), focusing on issues such as potential increases in fault levels, quality of voltage regulation and unbalance, and breaches of thermal constraints. The occurrence of maximum local power generation and minimum demand has been widely studied; however, if micro-generation levels increase
significantly in the coming decades, such a modelling approach could lead to large capital investment in security infrastructure across the network that may not be wholly justifiable. To provide the data needed for improved economic assessment, more realistic modelling of network performance is required using representative profiles for both demand and generation; this will provide a better understanding of the impact of micro-generation.
MODELLING APPROACH
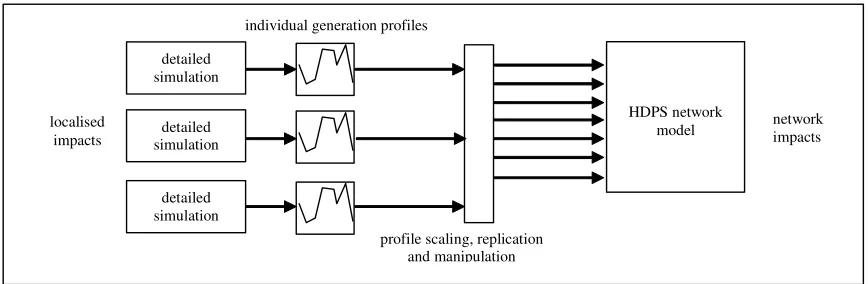
In the HDPS modelling approach described here, a representative sample of micro-generators is simulated explicitly using the ESP-r building simulation tool (Clarke, 2001); the output (power generation time series profiles) is then scaled and manipulated in order to represent a large population of diverse devices and provide appropriate boundary conditions suitable for input to a network simulation tool.
The practicality of the approach is demonstrated through its application to the analysis of a section of typical UK suburban 33kV and 11kV electricity distribution network, the objective being to assess any potential problems (e.g. unacceptable voltage deviations or persistent overloading of cables) that may result from widespread deployment of domestic-scale generation technologies. The following sections describe the components of the modular simulation approach in more detail.
Building Simulation Modelling
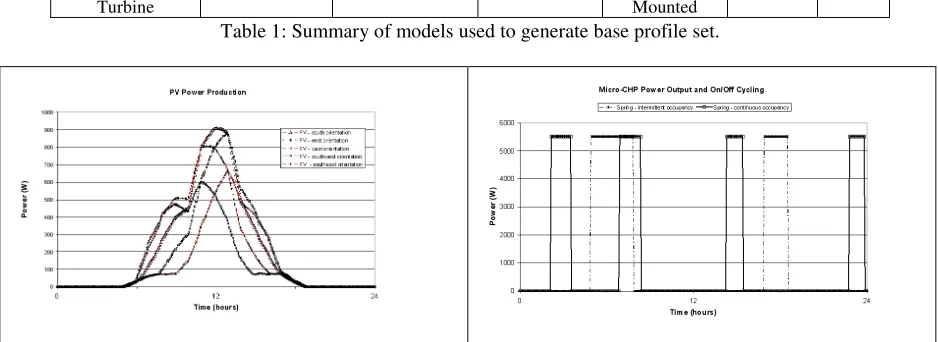
Table 1: Summary of models used to generate base profile set.
Figure 1: Simulated electrical from PV and micro-cogeneration.
ESP-r was used to produce power output profiles for micro- cogeneration, PV and micro-wind devices integrated into models of typical UK dwellings. The models used are summarised in table 1. As motioned previously, other studies have used high/low generation output by technology type, however this approach fails to provide sufficient diversity of performance. In this study, supply and profiles are manipulated both vertically (kW) and horizontally (time) where appropriate to account for the effects of such factors as micro-climatic variability and different occupancy characteristics (i.e. time of use of heating). The bounds on the variability are given in table 1. Note that these were obtained using the engineering judgement of the authors. Obtaining more robust values is an ongoing research issue for the HDPS consortium.
The base case profiles are all generated at a resolution of 5 mins over a one week simulation. Different weeks can be simulated to represent a different climatic periods of the year (summer, winter transition). Different combinations of generation type with dwelling type, occupancy and orientation are accounted for in the base cases resulting in 4 different CHP profiles, 14 different PV profiles with a further 6 different wind profiles being utilised. This gives a total of 24 base case profiles. In addition to the production of generation profiles, corresponding base case demand profiles are available for three different
levels of demand, termed high, medium and low; these can be matched to the different dwelling types and different occupancy characteristics shown in table 1. A total of 36 base case demand profiles are available.
Profile Replication and Manipulation
The base profiles account for the effects of climatic variation, geographic, locality, building characteristics and occupant behaviour. However to generate the thousands of profiles needed to populate a model of a section of electrical network would be computationally expensive. A pragmatic approach is to add diversity by replicating and manipulating this base set of profiles. To this end, a software tool has been developed, which selects a suitable base case profile and then produces variants, constrained by user-defined limits for magnitude and temporal variability. For example if a micro-cogeneration profile has limits for magnitude (kW) and time variation of 10% and 2 mins respectively, then the profile magnitude could be varied by up to +/- 10% and on/off times varied by +/-2 mins; the exact variation is generated based of a constrained random number with a flat probability profile across the interval defined by the limits. The resulting group of profiles then can then be passed to the electrical network modelling tool (aggregated if required) as boundary conditions.
Variation Range Generation
Type
Rated Power Dwelling Type
Occupancy Orientation
(mins) (kW) CHP-Stirling
microgenerator
1.2kW electrical
Detached/ Semi-detached
Continuous/ Intermittent
n/a +/-30 -0%
PV 1.02kW peak n/a n/a E,S,W,SW,
SE
+/-20 -0%
Micro Wind Turbine
1kW peak n/a n/a Roof
Mounted
[image:2.612.71.540.154.325.2]Figure 2: HDPS modelling approach using multiple tools. Demand profiles are manipulated in the same way. The
profile manipulation and replication process illustrated for generation in figure 2.
Modelling the Network
The network is modelled and simulated using load flow analysis software - in this case the PSS/E tool1, although others could be substituted. The model of the electricity distribution system is constructed so as to combine the goals of efficient simulation and the investigation of enough locations to be representative of the entire network. Thus, although the model extends from the interface between the 132kV sub-transmission system to the 415V low-voltage busbars, only one branch through the network (i.e. one 33kV substation and one 11kV distribution circuit fed from it) is fully modelled. All other loads are represented by ‘lumped equivalents’ at the appropriate locations.
A balanced three-phase simulation is assumed; therefore, analysis does not extend to individual dwellings. At the most detailed level of modelling, loads and generators are aggregated at the terminals of 11kV/415V transformers. The derived load and generation profiles are applied at relevant points in the network. The load flow solutions yields a time-series of network states, in the form of circuit power flows and bus bar voltages, which can be examined for violations of operational and statutory constraints.
SIMULATIONS
A number of authors have proposed scenarios for future developments in the electricity industry and in the wider energy sector in the UK (e.g. RCEP [2000]; Anderson et al, [2005]; Elders et al, [2006]). The scenarios considered in the work reported here are based closely on those produced by the Supergen HDPS consortium (Jardine, [2006]), where three scenarios have been developed to describe possible
1
a power flow simulation tool produced by Siemens commonly used in academia and by the utilities
future situations in electricity generation and use in Great Britain for the years up to 2050, with particular focus on issues such as: electricity demand and domestic energy demand; the balance between centralised and decentralised electricity generation; changes in the large centralised generation portfolio; and the level of deployment of different decentralised and micro-generation technologies.
The three scenarios can be summarised as follows. - Business as Usual (BAU) envisions a future in which current trends in technological progress, environmental awareness and policy continue to 2020. As a result, demand for electricity and domestic energy continues to grow, and large centralised generation remains much more important than decentralised plant. While there is limited movement towards adoption of domestic-scale generation – including both micro-CHP and renewables – the domestic sector remains reliant on centralised sources for the great majority of its electricity demand. - Low Carbon (LC) describes a future in which environmental concerns become increasingly strong and in which carbon reduction is a priority. As a result energy efficiency leads to a progressive reduction in electricity demand, led by the domestic sector. Decarbonisation of centralised electricity generation encourages increased deployment of electric heating in new dwellings, but this is offset by significant uptake of micro-CHP and roof-top renewable technologies. By 2050 under this scenario, households are net electricity exporters.
- Deep Green (DG) where reduction of carbon emissions is a priority. The costs of electricity generation from fossil fuel are assumed to be higher than in the LC scenario, therefore micro-CHP technologies see less deployment as a result of higher gas prices; conversely micro-wind and photovoltaic generation is more widely installed. As before, energy efficiency measures lead to a reduction in overall electricity demand, although there is increased interest in heating domestic properties using carbon-free electricity.
detailed simulation
profile scaling, replication and manipulation
HDPS network model detailed
simulation
detailed simulation localised
impacts
In this paper only the Business as Usual scenario and Deep Green scenario were considered as these give two extreme sets of conditions. Simulations were conducted for no embedded micro generation (i.e. the situation today), 2020 and a speculative simulation for 2050 featuring a significant increase in the quantity of embedded generation (discussed later).
The network used for the studies reported in this paper is typical of that to be found within a suburban area in the UK, and is connected to the transmission system using two circuits originating at a grid supply point (GSP) with a voltage transformation of 132/33kV. Distribution voltages of 33, 11 and 0.4kV are used with a predominately radial network topology. Circuits at 33kV use overhead lines, whereas the 11 and 0.4kV circuits are constructed using underground cables. On-load tap changers are installed on the transformers within the GSP and at primary substations (33/11kV) and off-load tap changing is possible at secondary substations (11/0.433kV). A line diagram is provided in figure 3 and shows the distribution from the GSP down to the 11kV level.
In order to investigate the effects of micro generation on conditions in the 11kV network, one of the 11kV circuits fed from substation C is modelled in more detail (figure 3). The network contains a mixture of industrial and residential loads; a proportion of the residential loads are assumed to be associated with the remaining four 11kV networks and are modelled as 'lumped' load and generation, representing the effects of the underlying micro generation and load on the 33kV network. Industrial loads are assumed to be constant.
Profile (Boundary Condition) Generation
The profiles generated for the modelling exercise reflect the local generation mix outlined in the scenarios, featuring micro-CHP, micro wind turbines and photovoltaics. The base micro-CHP profiles were generated using multiple simulations of a 1.2kWe Stirling engine unit supplying heat and power to a semi-detached and detached dwelling. Further, each dwelling model was simulated with two different
occupant characteristics: an intermittent profile representative of a working family and a continuous profile representative of retired occupants. The models have been adapted so that their levels of insulation, and consequently their heat demand reflect future improvements in building energy efficiency. Each building model also included a detailed model of the heating and associated control systems.
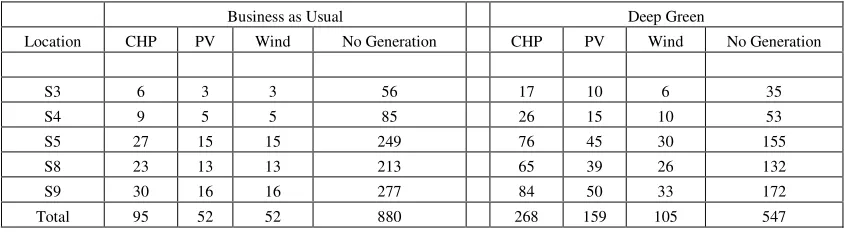
The PV profiles were generated using the model of the detached dwelling with a 1020kWp crystalline solar array attached to the roof. Multiple simulations were run with the array orientation incremented from East to West through South to account for differing roof orientations: East and West represent the extremes of what could be considered a viable PV installation. Finally, the micro-wind profiles were generated using a 1kWe turbine model attached to the roof of the detached dwelling. Table 2 provides information regarding the generation mix at each 11kV substation. A total of 199 generation profiles were created for the BAU scenario and 532 for the Deep Green Scenario. All were based on a transition climatic week. The proportion of households fed from each of the other 33kV substations having micro-generators was assumed to be the same as for substation C. Four further aggregate profiles, using the numbers of generators shown in the “total” row of Table 2, were produced to represent customers supplied at these locations. It should be noted that substations A, B, D and E were assumed to supply residential customers only; no fixed industrial load element was added to the load profiles for these sites.
An individual demand profile is generated for each customer at each bus before aggregation, generated from one of the 36 available base profiles.
For the 2050 scenario it is highly likely that new devices will have become available which could improve the performance of the micro-generation that can be deployed within an individual dwelling. For example, the greater electrical efficiency of fuel-cell CHP systems (Hoogers, 2003) over the engine-based systems modelled here would result in the installation
Business as Usual Deep Green
Location CHP PV Wind No Generation CHP PV Wind No Generation
S3 6 3 3 56 17 10 6 35
S4 9 5 5 85 26 15 10 53
S5 27 15 15 249 76 45 30 155
S8 23 13 13 213 65 39 26 132
S9 30 16 16 277 84 50 33 172
[image:4.612.95.520.69.185.2]Total 95 52 52 880 268 159 105 547
of a device of greater electrical output in order to satisfy the same thermal demand. Similarly, reductions in cost of renewable devices might allow a greater generation capacity to be affordably integrated into a building. Hence, to make an initial assessment of the impact of such development, a more crude analysis was conducted in which the generation output specified in each of the profiles discussed above was quadrupled prior to application in the network simulation; this does not fully substitute for a detailed scenario-based simulation of the operating characteristics of future devices, but it will provide a broad indication of the extent of any problems or benefits presented by their increased output.
RESULTS AND DISCUSSION
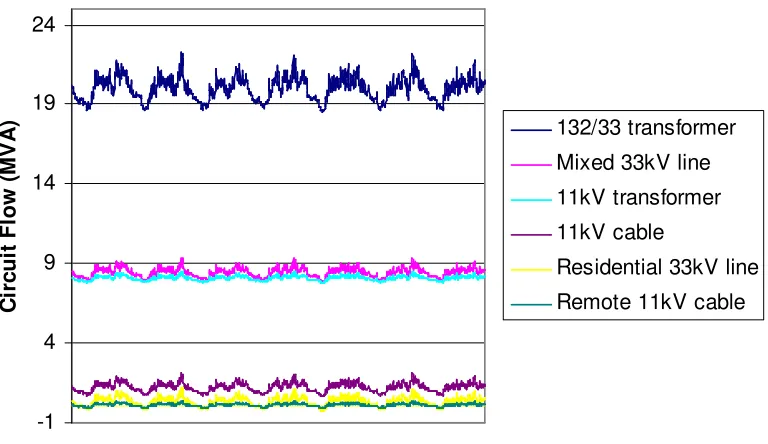
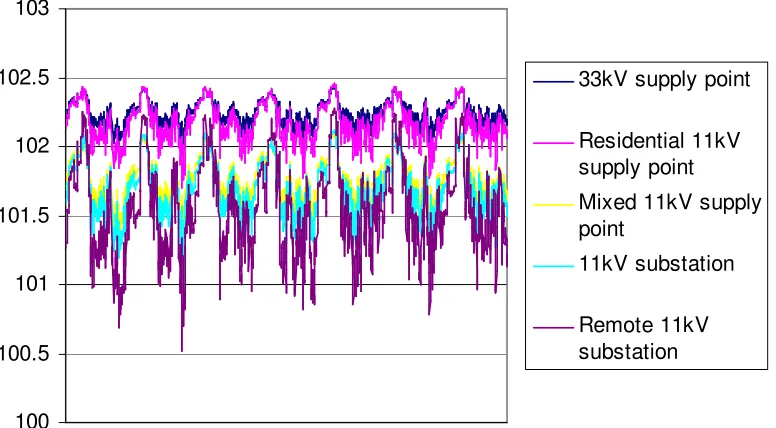
Analysis of the simulation results shows that for both the 2020 scenarios (BAU and DG) the addition of micro-generation results in power flows in the network being very slightly reduced compared to the no micro generation situation, indeed at some periods of the day there is a reversal of power flow in circuits serving purely residential load, so that a few tens of kilowatts are being exported from 11kV substations into the 33kV network (figures 4a and 4b).
Study of the network voltages shows two effects. Firstly, voltages at in the mixed industrial/residential portion of the 11kV network have reduced significantly due to automated control in the 33/11kV transformer to maintain the voltage within acceptable limits. Secondly, the voltage drop from the 11kV supply point C to the remote 11kV substation S9 has reduced significantly, particularly at times of peak generation. This may have implications for the correct configuration of control system to maintain acceptable voltages throughout the network.
Figures 5a and 5b show the results of the increasing the generation output to approximate the effects of future technological developments in 2050. The simulations show that the trends emerging from the 2020 scenarios become more pronounced. The increased generation under the 2050 “Low Carbon” scenario produces a situation in which power export from residential areas is the normal mode of network operation. Indeed the peak flows in residential network are towards the central electricity grid in this case. It is noticeable also that the general rise in network voltages identified the 2020 simulations has seen further increase, particularly at remote 11kV points such as S9 (shown in Figure 5b) and S5. This may be indicative of more significant rises in voltages in the underlying low-voltage network to which micro-generation is connected.
Overall, the results presented here do not identify any significant problems in the modelled network as a
result of the connection of significant volumes of micro-CHP and micro-renewable generation in residential properties. However, further investigation of the effects of micro generation on conditions in the low voltage network would be desirable.
CONCLUSIONS AND FURTHER WORK
This paper has presented an approach to analysing the effect on electricity network of increased deployment of different micro-generation technologies through the detailed modelling of individual dwellings and associated micro generation. Unlike traditional approaches to electricity network planning, which mainly consider extreme conditions such as minimum and maximum load and generation, the method described in this paper permits the analysis of network conditions through time, so that not only potential for problems can be identified, but their likelihood of occurrence can also be quantified.
The modelling approach was applied to a typical British suburban electricity network. While no particular problems arising from increased micro-generation have been identified, further studies, considering, for example urban and rural networks, different climatic periods, together with an examination of conditions in the low-voltage, single-phase part of the network would give a fuller picture of the impact of large-scale deployment of domestic scale generation, and permit policy in relation to its deployment and connection to the network to be better formulated. Finally it should be noted that the study does not fully consider wider aspects of the transition from an overwhelmingly centralised generation portfolio to a more decentralised future such as: a reduction in the volume of large central generation in operation, with consequent lessening of the rigidity with which conditions at the transmission/distribution interface are fixed.
ACKNOWLEDGEMENTS
Some of the detailed models used in this paper (Beausoleil-Morrison and Kelly [eds.] 2007) were developed by the International Energy Agency’s Energy Conservation in Building and Community Systems research Annex 42: The Simulation of Building- Integrated Fuel Cell and Other Cogeneration Systems (www.cogen-sim.net). The Authors acknowledge the valuable input of the Annex to this paper.
and the indirect or direct contributions of the other consortium members.
REFERENCES
Jardine C., 2006, Supergen HDPS Scenarios, Oxford: Environmental Change Institute ( http://www.supergen-hdps.org/public/sg3scenarios/)
Smart P, Dinning A, Maloyd A, Causebrook A, Cowdroy S, 2006, “Accommodating Distributed Generation”, Econnect project Report No: 1672, prepared for: The Department of Trade and Industry. Cranfield P, Eland J, Jackson K, Ingram S, Burdon I, 2003 ,Micro Generation Network Connection. DTI Report K/EL/00295/REP, URN03/357 DTI Sustainable Energy Programme
Clarke J A, 2001, Energy Simulation in Building Design, 2nd Ed., Butterworth-Heinemann.
Royal Commission on Environmental Pollution , 2000, Energy: The Changing Climate, London: HMSO. Anderson K, Shackley S, Mander S , Bows A, 2005, Decarbonising the UK: Energy for a Climate Conscious Future, Tyndall Centre for Climate Change Research Elders I, Ault G, Galloway S, McDonald J, Kohler J, Leach M, Lampaditou E, 2006.Electricity Network Scenarios for Great Britain in 2050, Electricity policy research group working paper 05/13.
Hoogers G (Ed.), 2003, Fuel Cell Technology Handbook, CRC Press, London. ISBN 0-8493-0877-1, pp 3-11 – 3-13.
11kV
11kV
11kV
11kV
11kV TO ADJACENT NETWORK TO ADJACENT
NETWORK 33kV
132kV TRANSMISSION
GSP PRIMARY
SUBSTATIONS
INDUSTRAL INSTALLATION
A
B
C
D
E 11kV
11kV
11kV
11kV
11kV TO ADJACENT NETWORK TO ADJACENT
NETWORK 33kV
132kV TRANSMISSION
GSP PRIMARY
SUBSTATIONS
INDUSTRAL INSTALLATION
A
B
C
D
E
S1 PRIMARY SUBSTATION C
S2 S3
S4
S5 S6
S8 S9 S7
INDUSTRIAL
INDUSTRIAL
SECONDARY SUBSTATIONS (11/0.433kV)
S1 PRIMARY SUBSTATION C
S2 S3
S4
S5 S6
S8 S9 S7
INDUSTRIAL
INDUSTRIAL
[image:6.612.94.522.262.412.2]SECONDARY SUBSTATIONS (11/0.433kV)