City, University of London Institutional Repository
Citation
: Cattani, G., Ferriani, S., Mariani, M. M. & Mengoli, S. (2013). Tackling the
"Galacticos" effect: team familiarity and the performance of star-studded projects. Industrial and Corporate Change, 22(6), pp. 1629-1662. doi: 10.1093/icc/dtt001This is the accepted version of the paper.
This version of the publication may differ from the final published
version.
Permanent repository link:
http://openaccess.city.ac.uk/19004/Link to published version
: http://dx.doi.org/10.1093/icc/dtt001
Copyright and reuse:
City Research Online aims to make research
outputs of City, University of London available to a wider audience.
Copyright and Moral Rights remain with the author(s) and/or copyright
holders. URLs from City Research Online may be freely distributed and
linked to.
1
Tackling the ‘Galácticos’ Effect:
Team Familiarity and the Performance of Star-Studded Project
Gino Cattani
Stern School of Business – NYU [email protected]
Simone Ferriani*
University of Bologna [email protected]
&
City University London
Marcello Mariani University of Bologna [email protected]
Stefano Mengoli University of Bologna [email protected]
Forthcoming in
Industrial and Corporate Change
2
Tackling the ‘Galácticos’ Effect:
Team Familiarity and the Performance of Star-Studded Projects
ABSTRACT
Findings on the performance implications of assembling star-studded teams have remained
rather mixed. We elaborate on the theoretical reasons for current inconclusive findings and
delineate more precise boundary conditions for studying the relationship between stars and
project level performance. Specifically, we argue that lack of scholarly attention to team
familiarity may account for empirical results’ observed inconsistency. Our findings show that
a history of past collaboration reduces the downsides of having too many stars within the
same team. Previous interactions enhance coordination efforts by reducing conflicts among
team members. We situate the analysis within the context of the Hollywood film industry
over the period 1992-2004. The theoretical implications of the results are discussed.
3
1. I
NTRODUCTIONStaffing a project team with the right combination of individual talents is one of the most
challenging tasks facing a manager or team leader. As people enter a new team, they carry
with them status and expectations about the roles that they will occupy and their influence
within the team. But these prior expectations may sometimes prove problematic, especially
when they clash with those of others (e.g., Overbeck, Correll and Park, 2005). Specifically,
what does it happen when several team members display high status?
This situation is epitomized by what – using a metaphor – we call the ‘Galácticos’
effect, namely, the case in which the arrival of too many star professionals results in very
disappointing team performance. When Florentino Perez was elected president of Real
Madrid in 2000, he introduced the famous Galáctico (Superstar) recruitment policy wherein
the club would sign a star player every year. Yet, despite the club’s star-studded line-up of
some of the world’s finest football players, Real Madrid did not win a single trophy in the
2003-04, 2004-05 and 2005-06 seasons, resulting in one of the worst series of results in the
club’s illustrious history: not since 1954, when Real Madrid ended a seven-year run without
silverware, had the club ever suffered such a poor spell. In spite of stars’ talents and
achievements, their prima donnas aspirations may take precedence over team goals and
jeopardize project performance.1
1
4
Two competing camps, however, seem to characterize the existing literature on the
performance implications of recruiting stars. While some scholars highlight the benefits
resulting from hiring stars (e.g., Elberse, 2007; Zucker and Darby, 1996, 2007), others
emphasize the dysfunctional dynamics often plaguing star-studded teams (e.g., De Vany and
Walls, 2004; Groysberg, Lee and Nanda, 2008; Groysberg and Lee, 2009; Overbeck et al.,
2005). Which of these two views best describes the actual performance of star-studded
project teams? Can these views be reconciled?
The present paper seeks to shed light on the theoretical foundations for current
mixed findings on hiring stars and delineate more precise boundary conditions for
understanding when the presence of stars is likely to have a positive or negative effect on
project team performance. First, we argue that a correct evaluation of the role of stars
should account for their impact on both the revenues and the costs – and, by implication,
the profits. Not only are stars enormously expensive, but star-studded project teams face
significant coordination challenges, as stars’ hubris and overconfidence may easily disrupt
collective efforts. Second, we suggest that lack of scholarly attention to prior experience
working together (i.e., team familiarity) might help explain empirical results’ observed
inconsistency. Focusing on talent alone could be misleading if one remains oblivious to the
growing body of literature that shows how team performance crucially depends on having
people (both stars and non-stars) with prior joint experience (e.g., Huckman, Staats and
Upton, 2009; Reagans, Argote and Brooks, 2005). Our findings show how team familiarity is
an important boundary condition for establishing when the presence of stars is beneficial or
detrimental as it moderates the relationship between stars and project performance.
The empirical setting is the Hollywood motion picture industry, which we traced
5
among stars, other team members and project (movie) performance. Given the
project-based character of the industry, professionals usually work on several projects at the same
time and over a relatively short time period (Whitley, 2006). While projects are typically
terminated upon completing a movie, ties to other professionals tend to last much longer as
they are reactivated when the very same professionals work on a new movie. It is indeed
rather customary that individuals end up working together in more than one movie, which
makes past collaboration a distinctive feature of this industry (Ferriani, Corrado and
Boschetti, 2005; Schwab and Miner, 2008; Ferriani, Cattani and Baden-Fuller, 2009). As
noted by Manning and Sydow (2011, 1370): “Project researchers […] have increasingly
studied the embeddedness of temporary projects in long-term organizational, relational and
institutional structures.” While in fact projects are temporary, ties among the parties
(individuals or organizations) involved may survive them: the same project-members often
cooperate repeatedly, even routinely. In addition, Hollywood is the birth place of the star
system and the industry still places an enormous importance on star power. As Walker
(1970: 13) explains, “Wherever films are made, stars are made too. Stardom is a characteristic
of film industries the world over. But it has always dominated American movies more than
those of any other country. Stars laid the basis of the Hollywood film industry.” Third, and
more pragmatically, due to the great demand for information about the feature-film industry,
rich data are available on all movies distributed by Hollywood every year and on the
professionals who have ever worked in one of these feature-length films.
The paper is organized as follows. In the next section (2), we present the theory and
the main hypothesis. We then describe the empirical setting, the data and the variables (3).
6
findings and check the robustness of the results (5), we conclude (6) with the contributions,
limitations and possible extensions of the present study.
2. T
HEORY2.1. Number of stars and project team performance
Is the recruitment of stars an appropriate solution for improving project performance? A
growing body of academic research seeks to address this question. For instance, studies on
scientists involved in R&D have found that scientists at the very top of the talent
distribution are far more productive than less ‘stellar’ colleagues and enjoy reputational
advantages which provide them with greater access to the resources (e.g., funds, grants) they
need to conduct their research, which fosters even greater accomplishments (Zucker and
Darby, 1996). Similarly, research on top managers suggests that being anointed as a star can
enable CEOs to translate their credibility into power as they deal with internal and external
constituencies (Wade et al., 2006). By having greater market visibility, stars usually garner a
disproportionate amount of media attention. This visibility in turn helps the team of which
stars are members to secure material and symbolic resources, elicit market attention and, by
implication, perform better. For example, Stinchcombe (1990) suggested that hiring a Nobel
Prize winner brings ceremonial benefits to a university. Similarly, as Pfeffer (1981: 22) noted,
“one of the important ways of generating external support … [is] through identification of
the organization with socially valued and accepted individuals.”
By contrast, research on group dynamics and social-psychology highlights
coordination costs that may arise from the overconfidence and hubris in professionals
anointed as stars, despite their productivity and signalling effects (Hayward and Hambrick,
7
personal performance relative to the other team members, rather than their team
performance relative to that of other teams (Overbeck et al., 2005). As a result, too many
group members might feel entitled to give directives, while too few might be willing to take
suggestions from others—thus jeopardizing the smooth functioning of the team. Similarly,
recent research on status emphasizes that the competitiveness that may stem from status
conflict is likely to restrict information sharing among group members. Because sharing
information is needed to “achieve optimal joint outcomes its restriction is likely detrimental
to group performance” (Bendersky and Hays, 2012: 326).
Another argument against the practice of assembling star-studded teams is the
‘winner-take-all’ compensation effect, that is, the ability of stars to reap most (if not all) of
the value they create by commanding high salaries or rewards (De Vany and Walls, 1999;
Ravid, 1999). Performers who are publicly recognized as stars often receive compensation
premiums that are higher than their marginal contributions would justify (Frank and Cook,
1995). With respect to our empirical setting stars may capture the excess of expected
revenues over what the film would earn with ordinary talent in the same role (Elberse 2007);
or, put it another way, star performers do well for themselves and their agents, but quite
often fail to deliver for the producer/studio that employ them. Several alternative lines of
research, therefore, indicate that star-studded teams are prone to dysfunctional dynamics
that may depress group performance. This brings us to the question of which of the two
views on star assembly and project performance is more accurate. In a recent attempt to pit
these views against each other empirically, Groysberg, Polzer and Elfenbein (2011) have
pointed out the possibility of an inverted U-shaped effect. Using evidence on Wall Street
research analysts, they show how groups benefit from star analysts up to a point after which
8
stars initially add to the visibility of the group and its ability to secure critical resources;
however, too many stars “may become a breeding ground for dysfunctional,
counterproductive and even vindictive behaviour, the antithesis of the behavioural
integration necessary for achieving high group effectiveness” (Groysberg et al., 2011: 726).
This work represents a first important step towards the reconciliation of competing
views on the performance implications of star-studded project teams. Yet a more precise test
of the proposed mechanisms for their findings would require including “a direct measure of
behaviour in terms of the amount and quality of time spent working together” (Groysberg et
al., 2011: 743). In what follows, we seek to elaborate on this intuition and illustrate how a
history of past collaboration among project team members is a critical boundary condition
for understanding whether the presence of stars is going to have a positive or negative effect
on project performance.
2.2. The moderating effect of team familiarity
While we remain agnostic about the intuition that more stars are better when it comes to
performance, the question we wish to explore here is whether specific combinations of very
talented individuals might alleviate some of the drawbacks usually associated to star-studded
teams and hence yield higher performance. Why should a given combination of stars be
better than others, even after accounting for individual differences in prior performance that
might affect the overall group effort? Why would the performance of two star-studded
teams vary dramatically despite a substantial similarity in terms of overall talents at play?
Previous research has shown how individual workers’ performance can be influenced
by their level of familiarity with organizational assets (e.g., capital equipment, technology,
firm-9
specific and therefore only limitedly portable. Explanations for firm-specific performance
typically revolve around “the potential complementarity between a worker and the human,
physical, or organizational assets held by a given firm” (Huckman and Pisano, 2006: 475). In
their study of cardiac surgeons’ performance across multiple hospitals, for instance,
Huckman and Pisano (2006) found the quality of a surgeon’s performance at a particular
hospital to improve significantly with the number of surgeries undertaken at that hospital.
But in those cases where the organization of work relies on independent contractors or
freelancers, who are free to move from project to project without being employed by a
stable organization, the context in which individuals skills are learned and deployed does not
necessarily coincide with the conventional notion of the ‘firm’ or the ‘organization.’ The
context embraces instead the broader web of relationships the individuals involved in a
project formed in previous collaborations (i.e., projects they worked on together). If
reactivated, these relationships “promote trust among the parties involved and function as
critical repositories of shared learned experiences and knowledge that can be retrieved as the
same actors work together on a new project” (Cattani, Ferriani, Fredriksen and Täube, 2010:
xviii; see also Jones, 1996). According to Starkey, Barnatt and Tempest (2000), who derive
their insights from research interviews in the UK television industry, continuity of
relationships among project members provides a context within which to develop the
individual cognitive schemata required to seamlessly integrate each other’s capabilities and
adjust individual contributions accordingly (Ferriani et al., 2005). As acclaimed director
Sydney Pollack pointed out, working with other professionals who are on the same
wavelength is perceived as “an emotional pleasure” (quoted in Jones and DeFillippi, 1996:
97), to the point that “when you find people you can work with you never want to give them
10
These considerations, we argue, hold important implications for the case in which
multiple stars end up working on a project with other team members with whom they had
already worked in the past. As we noted earlier, when stars enter a new group they also carry
high expectations about their roles and status. Differences in these expectations may prove
problematic to reconcile, especially when new members expect to have higher status than
other group members. In fact, for a group to succeed, individual members must be able to
subjugate their own personal needs and desires to maximize the collective good. A history of
prior interactions helps resolve such differences by sustaining social integration. Accordingly,
we expect familiarity among star-studded team members to mitigate disputes over people’s
relative status position in their team’s social hierarchy and so broadening information sharing
(Bendersky and Hays, 2012). By sorting status aspirations, star-studded project team
members will also attain “greater satisfaction on average, due to their similarity on affiliative
dimensions, and perceived similarity as a result of complementarity on dominance
dimensions” (Overbeck et al., 2005: 193). In this sense team familiarity is distinct from the
cumulative experience of its members in performing a certain task. Experience working
together is valuable because it facilitates the diffusion and recombination of distinct but
complementary skills and knowledge, hence fostering a more accurate and shared sense of
who knows what on the team (Reagans et al., 2005; Huckman et al., 2009). Indeed, as
experimental research has shown (Moreland and Myaskovsky, 2000), individuals involved in
stable collaborations “develop transactive memory systems, in which members understand
one another’s capabilities and can more easily coordinate their actions” (Edmondson,
Bohmer and Pisano, 2001: 689).
Taken together, these arguments suggest that the impact of stars on project team
11
when stars work with other team members with whom they have no familiarity, status
sorting and information sharing are very problematic. It is in fact under these conditions that
interaction uncertainty is highest, resulting in low propensity towards speaking up and
discussing openly. However, as team familiarity increases team members become more
positively disposed towards one another and interaction uncertainty diminishes. By reducing
the pitfalls of power and status conflict, and facilitating information and knowledge
exchange, as well as fostering social integration through the creation of mutual trust, we
expect past collaboration to temper the downsides of assembling star-studded projects and
lower coordination costs. Indeed, distinguishing between high and low levels of team
familiarity provides a more nuanced understanding of when assembling star-studded teams is
going to have a positive or negative impact on project team performance. Accordingly, we
hypothesize:
Team familiarity moderates the relationship between number of star professionals and project
performance; the number of star professionals in a team is positively (negatively) related to project
performance for high (low) levels of team familiarity.
3. E
MPIRICALS
ETTING ANDM
ETHODOLOGY3.1. Research setting
The Hollywood motion picture industry is an instructive setting in which to analyze the
impact of having stars on project performance. First, stars have always played a critical role in
the movie industry which, not surprisingly, is regarded by many observers as the epitome of
the star system (Elberse, 2007). 2 Second, every year top talent is identified and celebrated by
12
the industry through ritualized and highly visible events promoted by influential
organizations that bestow awards on those seen as having made significant contributions to
the field (Cattani and Ferriani, 2008). Detailed movie revenue data are also available, so
allowing one to rank professionals’ star-status not only against the awards they received, but
also the commercial success of the projects in which they were involved over their career.
Finally, like in other contexts (e.g., consulting, advertising, construction, etc.) where the
organization of work relies extensively on project teams that employ the services of
specialized professionals, completing a project involves at the same time a high degree of
experimentation, and the complex task of combining professionals and coordinating their
efforts. As Baker and Faulkner (1991: 287) pointed out, “there must be a great deal of
mutual coordination between those who supervise the transformation of ‘raw materials’ and
those who provide the expertise and talent for this process. Thus coordination of role
players is a pressing problem.” Film professionals may respond to these coordination
problems by establishing enduring collaborations with trusted partners (Ferriani et al., 2005,
2009; Zuckerman, 2004). Indeed, this is an industry that allows one to study the “dual
matching of projects, economic returns to projects and their participants, and subsequent
rehiring and renewal of ties on new project organizations” (Faulkner and Anderson, 1987:
881). For all these reasons, Hollywood star professionals appear to be an ideal test case.
13 3.2. Data
Our data consist of the entire population of crewmembers who worked in at least one of the
2,297 movies distributed in the United States by Hollywood major studios – i.e., the seven
historical majors (Universal, Paramount, Warner Bros, Columbia-Tristar, Disney, 20th
Century Fox and Metro-Goldwyn-Mayer) and Dreamworks – and their subsidiaries over the
period 1992-2004. We focused on these studios because they dominate the industry either
directly, through their financial power, or indirectly, through distribution control. Over the
last decade, movies released by these companies have consistently accounted for an average
90% of total US box-office income. Since our interest is in feature films made and
distributed by Hollywood, we did not include documentaries, foreign-made films, short
films, and compilation screen classics. Using the Internet Movie Database (www.imdb.com),
for each movie in the sample we collected information on the following crewmembers:
producer, director, lead actor/actress, and cinematographer. We selected these roles because
they are all simultaneously engaged in the production phase (“principal photography”)—i.e.,
the phase in which, explains Clevè (1994: 11), “the film is actually shot.”3 The producer is at
the core of “the film’s financial, managerial and commercial networks: as such it supervises
all its financial and administrative aspects” (Hadida, 2010: 48), and he is usually involved
throuought the making of a movie form inception to distribution (Delmestri et al., 2005;
Ferriani et al., 2009). The director is also responsible for the artistic quality of a movie and
typically works closely with the producer (e.g., movie outline, casting, etc.). Specifically, s/he
plays a critical role in coordinating the efforts of other crewmembers, solving possible
14
conflicts and facilitating internal cohesion and communication. Lead actors/actresses
“embody and enact the vision of the director” (Hadida, 2010: 48) and historically have been
the most visible exponents of the Hollywood star system (Walker, 1970). Finally, the
cinematographer is responsible for creating much of the visual look of the film and to some
extent “has possibly the most important role in a film shoot after the director” (Caldwell,
2011: 43). Do to their crucial role, industry commentators have indeed sometimes described
top cinematographers as a “new kind of star” (Grover, 1975). Our selection resulted in a
total of 35,825 crewmembers distributed across these roles.
3.3. Dependent variables
Our first dependent variable captures movie revenues, which we measured in terms of
domestic (i.e., US-based) box office receipts. While the advent of new technologies – television,
VCR, cable and DVD – has expanded the number of viable revenue sources, box office
receipts remain “the most important benchmark when considering a film, as these ancillary
revenues tend to correlate highly to the movie’s performance during its theatrical exhibition
period” (Sorenson and Waguespack, 2006: 14). Our second dependent variable is movie
budget. Budget data only refer to the “negative costs,” that is, the cost of a project through
the production of a finished negative, without including the costs of prints, distribution and
capitalized interests. We collected data on box office and budget from the Internet Movie
Database (IMDB).4 Our third dependent variable is domestic (US-based)
profitability, which
we measured as return on invested capital the ratio between movie box office receipts and
budget. This is a measure of profitability with values above 1 indicating an increasingly
profitable movie (the lower bound 0 corresponds to the ‘theoretical’ case in which the movie
15
failed to generate any box office receipts). Focusing on the return on investment rather than
just revenues is important because most studies have found that “budgets are a main driver
of revenues. Thus, it is easy to produce movies that gross a lot of money – just put in a lot of
money. However, that may not be a profit-maximizing strategy” (Ravid, 2005: 37). Also, the
involvement of star professionals calls for the investment of a large amount of financial
resources in the form of production budgets (Hadida, 2010). This indicator has also
important caveats that it is important to acknowledge. First, our profitability variable is not a
measure of accounting profits. Rather, it tries to measure if the movie provides a good return
on investment. The calculation of accounting profit is complex, even if all relevant costs and
revenue sources were available, and may be of dubious value even if it were to be
announced. Hollywood accounting practices have often been criticized for their lack of
transparency (Ross and Ikawa, 1997).5 Second, in addition to their salary, sometimes stars
also receive a percentage of the movie revenues; as a result, there is practically no way to get
information about compensation packages, which are “one of the best-kept secrets in
Hollywood” (Gumbel et al., 1998). Thus, true profits are extremely hard to identify. Third,
budget data for all films are not available from this (IMDB) or any other source. Information
on missing budgets is very hard to find as studios are usually reticent when it comes to
discussing how much a film costs (especially when a movie fared poorly at the box-office).
These limitations notwithstanding, we believe our rate of return measure represents a
reasonable proxy for economic profits for various reasons. Industry publications indicate
that domestic box office receipts should approximate the negative cost for a movie to break
16
even. Second, the appropriateness of the metric is premised on two basic assumptions, both
of which seem plausible: a) the revenues available to the producer/production company
(after exhibitors’ cut) are a constant proportion of gross revenues. Because agreements with
theatres tend to be standardized (Vogel, 2007), this is not an unreasonable assumption; b)
the costs, including advertising and distribution costs, are a constant proportion of the
negative cost (Ravid and Basuroy, 2004). As distribution agreements tend to be standardized
across movies, this is also a reasonable assumption. If these assumptions hold, then the
metric we use is a proxy of the ‘true’ return on investment that can be obtained by
multiplying the box office of any particular movie by an unknown (but common) constant.
Given that the bias is the same for each movie, any cross-sectional comparison among
movies should not be affected by a common cross-sectional bias. Third, to account for
missing budget data (budget information is available for 1,158 out of 2,297 movies in our
sample), we re-ran the models by applying multivariate imputation through chained
equations (Van Buuren, Boshuizen and Knook, 1999).
We adjusted box office receipts and budget values using a price deflator based on the
consumer price index (CPI) per year, with 2004 as the baseline year. Since movie box office,
budget distributions, and the ratio between the two variables are highly skewed, in the
analysis we expressed both values after applying a natural logarithmic transformation. We
also estimated the full models where the dependent variable is movie box office, movie
budget, and the profitability index, respectively, using a Box-Cox transformation. This
transformation is a useful method to alleviate heteroscedasticity when the distribution of the
dependent variable is not a priori known and it is based on the observed distribution (Draper
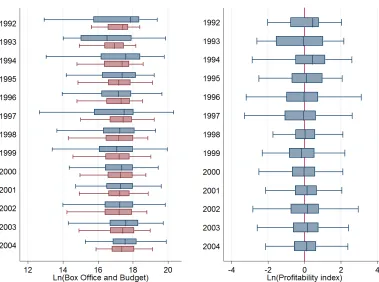
and Sminth, 1981).6 Figure 1 shows graphically the frequency distribution of the (log of the)
17
profitability index split by year. For each year, the distribution is depicted through a box-plot
whose central line is the median value.7 Note that in order to be profitable a movie must
have a value of the index higher then 0 (as the ln(1) = 0), highlighted by a vertical line in
Figure 1. The maximum and minimum in the boxes represent the 75th and the 25th percentile
of the distribution, respectively. The median value changes significantly over time: it is
positive in 1992, 1994, 1995, 1998, 2001-2004; in all of the aforementioned years more than
half of the movies had a positive (ln) profitability index. If the box is wider on the left (right)
hand side it means that the distribution is left (right) tailed like in the case of 1992 and 1993.
The range of the (ln) profitability index fluctuates over time, 1996, 1997, and 2002 are the
years when the profitability is most disperse.
3.4. Independent variable
In order to estimate the moderating effect of team familiarity (i.e., past collaborations) on
the relationship between stars and project profitability, we first created the variable Number of
Star Professionals. Movie professionals can be characterized as stars when they have critically
acclaimed skills, possess personality traits that appeal to the movie-going audience, attract a
lot of free publicity and have the ability to secure investment (Elberse, 2007). Several
approaches have been used to measure stars ranging from stars’ market value published by
Variety trade magazine, to star power as reported in The Hollywood Reporter’s Star Power
Survey, in which executives and other insiders rank talent. This paper builds on Ravid’s
(1999) approach where stars are classified based on their previous participation to top
grossing movies. A star’s historical box office record is a valued source of information for
studio executives (Chisholm, 2004). Being associated “to commercially successful films
18
defines one’s status and role relationships within the industry” (Jones, 1996: 66). Following
this criterion, we looked at each individual professional’s commercial reputation based on
his/her historical economic performance. Specifically, we computed the cumulative number
of ‘top 10 box office’ movies in which each professional (producer, director, actor/actress
and cinematographer) worked in the prior years to the focal one. In other words, after
identifying the top 10 box office movies for any given year, we computed the cumulative
number of top 10 movies in which each professional was involved. We identified as a star a
professional who performed in at least 2 top grossing movies over the selected 4-year time
window. The choice of the cutoff values (2 top-grossing movies over a 4-year window) was
motivated by the need to have restrictive enough criteria to isolate truly outstanding
performers, but without making them so extreme to almost eliminate variability in the data.
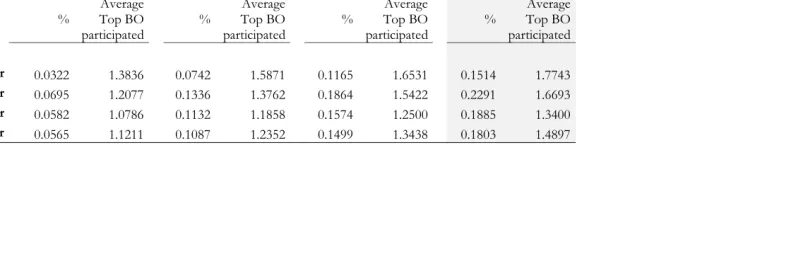
Figure 2 gives some insights into our choice showing the cumulative percentage of
movies as a function of the number of star professionals participating in the movie
depending on the event window from 1 to 4 years. Each graph also discriminates results
depending on the cutoff of top-grossing movies (BO) used to classify a crewmember as a
star (from 1 to 4 for each graph). So, for example, considering the thick line (which describes
the cumulative percentage of movies in which star professionals are defined as those having
participated in at least one top grossing movie over a 4 year time window), approximately
only 15% of movies did not include star professionals. The cumulative frequency
distribution goes up to more than 50% when considering movies with at least one
professional classified as star and to more than 65% when considering also movies with at
least two stars, etc. Table 1 gives statistics split by role about the participation of
crewmembers on top grossing movies in the previous rolling window. For instance, the last
19
directors tend to be involved in movies for which the average top box office (BO) is higher
(1.77). As explained later in the paper, (see the robustness checks section) we performed
various sensitivity analyses to test the robustness of our findings against these alternative
criteria. In addition, we emphasize that the choice of relatively short time-windows (from 1
to 4 years) is consistent with the tendency of film industry decision-makers to overly rely on
recent performance, a practice well epitomized by Hollywood’s oft-quoted maxim: “You’re
only as good as your last credit” (Faulkner and Anderson, 1987: 906). Data on top grossing
movies came from the IMDB online database.
We created the Familiarity variable using the measure developed by Reagans et al.
(2005). Familiarity among project team members is a function of the number of times they
worked together in the past. Considering a movie is released at time t, we took into account
past collaborations in movies released in the previous four years, i.e., from t-4 to t-1
included. We also used a 2-year and a 3-year time window but the results did not change
appreciably. For each pair of professionals (whether stars or non-stars) on the same project
team, we calculated the number of times the pair worked together in previous movies during
the chosen time window. We then summed this value, RKij, across pairs on the team and
divided the sum by all possible number of pairs to capture professional-specific experience
working together as follows:
] 2 / ) 1 ( [ 1 1 − ⋅ =
∑
=∑
= N N RK y Familiarit N j ij N iwhere N is team size and RKij is the number of times that professional i worked with
professional j. The variable measures the average number of times project team members
worked together in the last 4 years—e.g., if professionals collaborated in the 4 years before
20
increases to 2.8 Finally, to estimate the hypothesized moderating influence of familiarity we
created the two-way interaction between Number of Star Professionals and Familiarity
(Familiarity*Number of Star Professionals).
3.5. Controls
We included several control variables at the individual, team and project (movie) levels in the
final model specification to rule out competing result interpretations. Previous research (e.g.,
Eliashberg and Shugan, 1997; Basuroy, Chatterjee and Ravid, 2003; Zuckerman and
Tai-Young, 2003) has shown how critics’ reviews affect a movie’s yearly box office returns and
profitability: moviegoers might be more inclined to watch movies based on the critical
acclaim they receive. Accordingly, we included a measure of critical reception in the model.
We created this variable using data from a well-known online public source
“www.rottentomatoes.com,” which rates all movies distributed in the US. The meta-score is
a weighted average of reviews from national critics and publications for each movie. For
each movie review, the critic’s score is converted to a 0-10 point scale. In those cases when a
critic does not provide a numeric score the internal staff converts the reviewer’s general
impression into a score based on that critic’s word choice, tone, and authoritativeness. The
individual scores are then averaged to produce an overall critical acceptance rating. Because
8 We checked the robustness of our results by re-estimating the model with an alternative measure for collaboration. Following Borgatti and Jones (1996), we created a measure of collaboration from a measure of non-collaboration. Formally, the adjusted collaboration index ξ’ is computed as:
tae largest vi the of size tae largest vi the of size 1 1 ' ' − − − = − =
∑
∑
working notworking dummy dummy η ζ21
the same list of critics is used to evaluate each movie, the scores are consistent and the risk
of bias mitigated. We thus created the variable Critical Reception by using the meta-score value.
Although sequels tend to be more expensive and sometimes generate lower revenues
than original films, they may still outperform the average film especially when they capitalize
on a successful formula. Following previous studies (e.g., Ravid, 1999), we therefore created
a dummy variable Sequel that takes on the value 1 if a movie is a sequel and 0 otherwise. The
distribution and marketing strategy adopted for a particular movie might have a significant
impact on commercial success (De Vany and Walls, 2004; Eliashberg, Elberse and Leenders,
2006). We thus created the variable Opening Theatres measuring the logarithm of the number
of theatres on which each movie was initially released. Movies that are adaptations of a
previous story (e.g., books, novels, comic strips, or TV shows) may be more likely to appeal
to the audience than movies that rely on entirely new scripts because the public is already
familiar with the story (Litman and Kohl, 1989)—though they may also prove more
expensive because of the need to secure copyrights. We thus created the dummy variable
Adapted Script that takes on the value 1 if a movie is based on prior material and 0 otherwise.
The release date of a motion picture provides some indication of its box-office potential.
The summer season (Memorial Day to Labor Day) and several holidays (New Year’s Day,
Memorial Day, Independence Day, Thanksgiving, and Christmas) are widely regarded to be the best
periods to release a new high-caliber movie because consumers have more free time and,
therefore, are more likely to attend movies (Radas and Shugan, 1998; Moul and Shugan,
2005). We thus created a dummy – Release Date – which takes on the value 1 if a movie was
released during the summer or the weeks including holydays, otherwise 0.
Another important factor is the rating assigned by the Motion Picture Association of
22
graphic sequences, violence, and harsh language in a movie. While we have no reasons to
expect differently rated movies to cost differently, prior research suggests that features
produced for mature audiences (R and NC-17) perform worse at the box office (Ravid
1999). Since movies rated G, PG, and PG-13 have greater audience potential, and mall
owners sometimes contractually prohibit theatres from showing NC-17 films, studios often
exert pressure on producers and directors to ensure their films receive a rating aligned with
their market aspirations. Accordingly, we created the dummy variable Rating that takes on the
value 1 if a movie falls in the P, G, or PG-13 category and 0 otherwise. The likelihood of a
movie faring well at the box office might also depend on its genre. Family or action movies
for example are more likely to appeal to a broader audience and generate more box office
than horror or war movies. Also, certain special effects laden genres such science fiction,
fantasy, adventure or action tend to absorb more financial resources. We controlled for this
possibility by entering dummies for movie genre (Genre). We identified 17 genres (action,
adventure, animation, comedy, crime, documentary, drama, family, fantasy, foreign, horror,
musical, mystery, romance, sci-fi, thriller, and western). When a film was classified into more
than one genre, we used the leading categorization. Since we had no a priori expectations
about the existence of a time trend over the study period, we included year dummies into the
model to control for the effect of all unobserved factors (e.g., macro-economic trends,
changes in taste or fashion, and other factors that might affect the movie industry).
4.
M
ODEL AND ESTIMATIONWe followed two estimation strategies for modeling the data. First, we estimated a robust (to
23
Yi = θ + αFSi+ ΣγxXi + εi
where Y is the logarithm transform of movie Box Office, Budget, and Profitability Index,
respectively; FS represents the interaction effect between familiarity and stars, and X refers
to a vector of control variables γs are the coefficients of control variables. In these models,
standard errors are computed using Huber-White sandwich correct estimators robust to
outliers. We use the logarithmic transformations to reduce the significant (right) skewness of
the response variables. In the robustness analysis, we also use the Box-Cox procedure to
remove any ex-ante imposed logarithmic transformation of the endogenous variables by
relaxing the linear regression model assumptions and letting the transformation be chosen
according to the observed data (e.g., Draper and Smith, 1981; Delmestri et al., 2005). The
Box-Cox model is defined as:
r− 1
λ ≡ N β
x
; σ λ ≠ 0
log r ≡ N βx; σ λ = 0
The model includes the lognormal distribution (λ = 0) and the normal distribution (λ = 1)
as particular cases, respectively.
5. R
ESULTSTable 2 shows summary statistics for the variables of interest. The sample includes the 1,158
movies for which we had all relevant information (i.e., data on both revenues and budget) to
24
office ranges from a minimum of 5.032 million dollars (Duets) to a maximum of 670 million
dollars (Titanic); the deflated budget ranges from a minimum of 8.022 thousand dollars
(Blood, Guts, Bullets and Octane) to a maximum of 220 million dollars (Titanic). A quick
comparison of the median and mean values for the dependent variables (deflated box office
and profitability index) also reveals that the frequency distributions are asymmetric and right
tailed. These numbers indicate that, on average, movie’s box-office receipts are twice the
budget. Yet this result seems to be strongly driven by the presence of left outliers as the
appreciably lower profitability at the median (1.06) suggests. With respect to the independent
variables, the number of star professionals in a given movie ranges from 0 to 9 in absolute
value – i.e., 0 to 1 (all crew members in the selected roles are stars) as a percentage of the
crew.9 On average, 1 out 24 movies has a crewmember classified as star. The number of star
professionals with previous collaborations ranges from a minimum of 0 to a maximum of 12
(with at least 75 percent of the movies displaying no collaborations). As to the familiarity
index, the average value is 0.144 with a maximum value of 0.95. The critics’ score and
number of screens range from 1.70 to 9.50 and from 1 to 4,163, respectively. A comparison
of the mean and median values suggests that the frequency distribution is right tailed. Finally,
the dummies Sequel and Original Script indicate that only a relatively small proportion of the
movies are sequels (10 percent of the sample), while about 36 percent of the sample movies
are based upon adapted material.
Table 3 presents the Spearman’s rank correlation values, which are highly significant
in several cases. We opted for a non–parametric correlation statistics instead of the most
common Pearson correlation coefficients due to the uncertain assumption about the
particular nature of the underlying relationship (linear correlation) among variables. We
25
checked all models for the existence of multicollinearity by computing the variance inflation
factors (VIFs) and found multicollinearity not to be a severe problem (highest VIF values are
around 2). The results from the regression models are reported in Tables 4 to 9, respectively.
Although the coefficients are not displayed because of space limitations, all models include
dummies for movie rating, movie genre and year.
5.1. OLS regression estimates
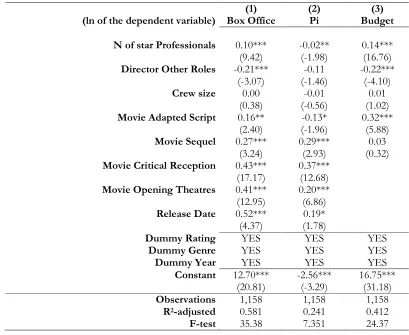
Table 4 presents the OLS results for the baseline models with the controls only. Models 1
and 2 present the estimates of the correlates of movie box office and movie profitability,
respectively. They include the same variables. Model 3 estimates the correlates of Movie
Budget and differs from the previous models because it lacks controls for critical reception,
number of theatres and release and. Critical reception is temporally subsequent to budgetary
decisions and endogenously affected by it (Simonton 2004). The number of theatres is also
decided after (or near to) movie completion (note that our budgetary information refers to
the negative costs). Finally, while release dates are sometimes decided many months before
filming, we found it difficult to imagine why it might influence the negative costs.
Starting from Model 1, as the number of star professionals working on the same
movie increases, the very same movie is more likely to fare well at the box office, as
indicated by the positive and statistically significant coefficient of the variable Number of Star
Professionals. This result is consistent with the Hollywood industry concept of ‘bankable stars’
– i.e., stars that can make money for the studio. On the other hand, the negative and
statistically significant coefficient of the variable in the model estimating movie profitability
(Model 2) suggests that stars might prove very costly, as confirmed by the positive and
26
can even outweigh their positive effect on box office. A director performing multiple roles in
the same movie (Dummy Director Other Roles) reduces box office receipts but has also a
negative effect on movie budge resulting in no effect on the profitability index. The number
of professionals working in principal photography (Crew Size) has no impact on the response
variables. Also, critics’ favourable reviews (Critical Reception) enhance movies’ box office
(Model 1) and profitability (Model 2). The dummy variable indicating whether a movie is a
sequel (Movie Sequel) was statistically significant across all models, thus confirming the
conventional wisdom according to which if a movie fared well, one should then invest more
money and try to leverage the “winning formula” as much as possible. Similarly, the number
of opening screens (Opening Theatres), which reflects the distribution and marketing effort for
that particular movie, increases both movie box office and profitability. Movies that rely on
adaptations of existing material (Adapted Script) have a positive impact on box office receipts
(Model 1), but are less profitable (Model 2) than movies based on original scripts because
they are more costly to make (Model 3). Finally, movies released during the Holidays and in
the summer (Release Date) tend to fare better both in terms of box office and overall
profitability.
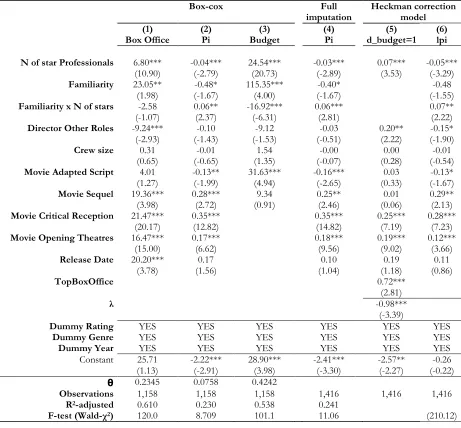
Models 1, 2 and 3 in Table 5 present the regression results for the full model after
including the interaction effect of theoretical interest Familiarity*Number of Star Professionals.
Focusing first on the influence of familiarity alone, Model 1 suggests that a history of
repeated interactions among key crew members enhances the revenues but has no effect on
movie profitability (Model 2) due to its negative effect on budget (Model 3). This finding
seems particularly intriguing as it suggests a possibility that Sorenson and Waguespack (2006)
already hinted at, i.e., the extra costs production companies are willing to incur in order to
27
movie budget) more than offset the revenues generated by such teams (significant and
positive effect of familiarity on movie revenues), thus resulting in no impact on the bottom
line (lack of significant effect on movie profitability). These are the effects of team familiarity
when there are no stars in the team. The situation looks very different when familiarity
works in tandem with the presence of stars. For illustration purposes, Figure 3 depicts the
profitability index as a function of familiarity and number of star professionals in percentage
based on the results in Table 5 (Model 2). Taking as an example one of the most recurrent
movies (i.e., a comedy rated PG-13) in year 2004, an increase in the familiarity index from 0
(minimum) to 50% does not significantly enhance the profitability index when there are no
stars in the team. But for a movie with five stars the same increase in familiarity boosts
movie profitability from approximately -2% (-0.0208) to 15% (0.146). This multiplier effect
of familiarity increases with the number of star professionals. Stated differently, as familiarity
increases the negative effect of the number of star professionals gets smaller and eventually
becomes positive at a high familiarity level, thus corroborating our hypothesis.
5.2. Robustness checks
To test the robustness of the analyses, we estimated additional models. First, we checked
whether the results were sensitive to the time-window chosen to identify a star by re-running
the analyses using a time-window of 1, 2 and 3 years, respectively. We found the coefficient
estimates of the key variables (i.e., Number of Star Professionals, Familiarity and the interaction
term between them) to be consistent with those presented earlier (with a 4-year time
window), the only major difference being that the interaction terms is still positive but no
longer significant with a very short 1-year window. Second, we re-estimated the final model
28
professional can be seen as a star. A high number of awards/nominations in a professional’s
career may indeed indicate an exceptional talent and the ability to deliver outstanding
performance. Unlike Ravid’s (1999) measure that looks only at Academy Awards, which tend
to be highly correlated to movie box office, we collected data on awards and nominations
from the following professional societies: Academy of Motion Picture Arts and Sciences, the
various Guilds, the Independent Feature Project/West societies, the Hollywood Foreign
Press Association, the National Board of Review, the National Society of Film Critics, the
New York Film Critics Circle, the Los Angeles Film Critics Association, the Broadcast Film
Critics Association, the Chicago Film Critics Association, and the Boston Society of Film
Critics. The selected awards are widely recognized as highly prestigious and reflect the
judgments of hundreds of experts from the worlds of film practice and critics whose task is
to identify and reward exceptional achievements in film-making. Including a broader range
of awards allows us to measure a professional’s artistic reputation more precisely. The
primary data sources were Tom O’Neil’s (2003) Movie Awards and the official web sites of
each award-granting organization. To ensure consistency with the other criterion, we chose a
cutoff of at least 2 awards/nominations over the 4-year time window. As reported in Table
6, the results of this additional analysis are consistent with those we obtained using a
professional’s commercial success as a basis for measuring stardom.10 Third, we split the
sample by budget size to ascertain the consistency of the effect of the variables of theoretical
interest in small and big budget movies. We thus re-run the analysis by including a dummy
variable Big Budget that is equal to 1 if the movie budget was higher than the median movie
29
budget for that particular year, 0 otherwise. Then, we interacted this dummy with the
variables of interest, i.e., Number of Stars, Familiarity, and Familiarity x Number of Stars.
Finally, using movie box office (Box Office) and profitability (Pi) as dependent variables, we
estimated the main models. Interestingly enough, the analysis revealed that all the main
effects (including the interaction term) are stronger for big budget movies than small budget
movies. Thus, while this extra evidence does not alter the fundamental interpretation of our
findings it does suggest that big budget movies are particularly important in driving our
previous results, thus further clarifying the relationship between familiarity and team
performance in the presence of stars. These additional analyses are available upon request
from the authors.
Table 7 reports the results when we used the Box-Cox procedure to remove the
ex-ante imposed logarithmic transformation of the endogenous variables and choose the best
approximation to the normal distribution implied from the data (Draper and Smith, 1981;
Delmestri et al., 2005). Using maximum likelihood estimation, we find the parameter λ to be
0.23 in the model where the dependent variable is movie Box Office (Model 1), 0.08 in the
model where the dependent variable is pi (Model 2), and 0.42 in the model where the
dependent variable is budget (Model 3). This approach produces qualitatively similar results
so confirming the previous conclusions.
For many of the movies in our sample budget data are missing. We thus used
multivariate imputation by chained equations as described by van Buuren, Boshuizen and
Knook (1999). In particular, we performed univariate imputation of missing data using
multiple regression combined with random draws from the conditional distribution of the
missing observations, given the observed data and covariates, and by prediction matching.
30
are consistent in sign with those discussed earlier for the full model without correcting for
missing data (Model 3 of Table 5). The number of star professionals continues to have a
strongly significant negative impact on movie profitability, and the familiarity index too is
negative, albeit only moderately significant. However, when interacted with the number of
stars, the familiarity index becomes positive and highly significant. Finally, to test whether
budget data were missing at random we also used a Heckman self-selection model. In model
5 (Table 7) we report results for the first step logit regression where the dependent variable
is equal to 1 in case budget data were available and 0 otherwise. The significance of the
lambda coefficient at the bottom of the model suggests that the selection bias is not at
random. However, the fact that we have missing data does not seem to drive our previous
conclusions because the coefficient of the variable of interest (Familiarity*Number of Star
Professionals) remains significant in the second regression (Model 6). These additional analyses
confirm that our earlier results are reliable despite the sample limitations.
6. D
ISCUSSION ANDC
ONCLUSIONSA recent front cover story of The Economist titled “The search for talent” displays a beautiful
pearl, one that is fixed in its shining splendour (The Economist, October, 2006). This image
nicely captures the assumption that seems to be often implicit in HR practices obsessed with
the attraction of top talents and celebrated professionals. Certainly, having talented
individuals is important. But focusing on individuals alone without ever questioning that
assumption may also lead to unwanted consequences. Particularly when star players must
interact regularly with other individuals, their performance may not be simply factored
31
metaphorically termed as the ‘Galácticos effect’, i.e., a situation in which the arrival of too
many stars leads to very disappointing team performance.
Our study is an attempt to unpack the ‘Galácticos’ effect and thereby contribute to
the organizational literature by delving more deeply into the performance implications of
recruiting stars. Despite a growing body of research concerned with the impact of recruiting
stars, findings have remained rather mixed due to the difficulty of deriving compelling
theoretical arguments for adjudicating why and under what conditions the costs of hiring
stars should be higher/lower than the revenues they are expected to generate. In addressing
this puzzle we argued that the experience stars and other team members have working
together is critical for clarifying some of the results’ observed inconsistency. Using data on
Hollywood feature films, we found that signing star professionals to a movie project has a
positive impact on box office revenues but also a positive effect on budget resulting in a net
negative effect on profitability. This suggests that as the number of stars in the team goes up,
the increasing costs, including the costs of coordinating their work, more than offset the
revenues they contribute to generating. Although this result seems consistent with previous
studies finding negative (Ravid, 1999) or no impact (Delmestri et al., 2005) of stars on
commercial performance, it is hard to invoke compelling theoretical arguments explaining
why we should consistently expect to observe such an outcome. On the basis of theory alone,
benefits as well as downsides can be associated to star-studded project teams—which
explains why empirical evidence supports both camps (Elberse, 2007). Different
considerations hold when star-studded team members worked together in the past.
Specifically, the results show how team familiarity tempers the negative implications of
having stars within the same team, thus enhancing movie profitability. As the familiarity
32
point when the effect becomes positive. Interestingly, the effect of familiarity on movie
profitability by itself is not statistically significant, a result that echoes evidence provided in
the context of the Italian feature film industry by Delmestri and colleagues (2005). It is
instead the combined effect of stars and familiarity that really boosts profitability. For
example, moving from a movie with no familiarity among crewmembers to a movie with an
average familiarity (0.172, see Table 2) enhances the profitability of a comedy/PG-13/2004
movie, all things being equal, by 4%, 8% and 11% when 3, 6, and 9 star professionals work
on it, respectively. Moreover, if one increases familiarity to the average plus one standard
deviation (0.172+0.143=0.172), these figures go up by 8%, 15% and 21%, respectively. Our
evidence suggest that star performance is not fully portable across project teams (Groysberg
et al., 2008) but is relation-specific: it depends on the level of familiarity that stars develop
with other project team members. While received explanations tend to revolve around the
idea of coordination benefits and routines for interaction (Alvarez and Svejenova, 2002), we
offered more star-specific theoretical explanations for why this is the case by looking at how
team familiarity helps deal with and possibly overcome status sorting issues common to
star-studded teams (Overback et al., 2005).
The study has several implications for organizational theory and project management
research. Theoretically-grounded predictions about the performance implications of
recruiting stars requires one to account for the stars’ attitude towards working together with
other stars and non-star team members. We suggest that lack of scholarly attention to prior
joint experience working experience might explain the lack of decisive findings. Despite a
large body of research discussing the costs and benefits accruing to teams whose members
collaborated in the past (Katz, 1982; Gruenfeld et al., 1996; Delmestri et al., 2005), only a few
33
collaboration with other team members. By highlighting the importance of project teams’
relational antecedents the study adds to the literature on team assembly mechanisms and
performance (Guimerà et al., 2005). Especially in contexts (e.g., filmmaking, consulting,
advertising, etc.) where teams disband upon completing a project, the possibility of building
and cultivating relationships among team members over an extended period of time is not an
option: a star-studded project team, in fact, has to function smoothly immediately after being
assembled. Hiring stars with prior experience working with other (stars and non-stars) team
members is critical for attenuating coordination problems and enhance the functioning of
the team. Overall, the results provide cautionary information for executives responsible for
assembling project teams and human resource strategists more in general. Given that stars
per se do not appear to have unequivocally beneficial effects on profitability, the argument
that organizations should be willing to pay exorbitant levels of compensation to attract and
retain stars that have performed well in the past may be somewhat misplaced. Organizations
with many stars are not necessarily better than organizations with fewer stars if such stars
have not developed some familiarity with other team members. Without sharing a common
vision a collection of individuals evolves into a group where collective performance may
remain an elusive dream. Before building a successful team that includes stars, project and
human resources managers should therefore carry out a careful analysis of each stars’
existing professional/personal linkages in order to select individuals who, besides their
expertise and competence, display a genuine attitude to build long-term relationships with
their peers (whether stars or not).
The study suffers from obvious limitations that however represent avenues for
future research. First, due to the structure of many deals in the industry and the
34
some information asymmetry to be able to generate ad hoc figures for budget data. Thus,
while profitability at the movie level is a more fine-grained performance measure than
box-office receipts, we are aware that profit calculations are hard to make in the film industry
and, admittedly, we have a crude proxy. Second, we measured past collaborations directly
but without providing any in-depth characterization of them. Additional quantitative and
qualitative data about familiarity within star-studded teams should therefore shed light on
those particular features that might increase the likelihood that certain relationships among
professionals will temper the negative impact of an increasing number of star professionals
on team performance. Last, questions about the generalizability of our findings can only be
answered by examining other contexts. The freelancers to whom our study is most relevant
are those who must interact regularly with other people in an organization. As such, our
findings might be especially relevant to freelance consultants and in general professionals in
project-industries who, unlike professionals completing projects independently, typically
35
R
EFERENCESAlvarez, J. and Svejenova, S. (2002). ‘Symbiotic Careers in Movie Making: Pedro and Agustin
Almodovar,’ in Peiperl, A. M. and Anand, N. (eds), Career Creativity: Explorations in the
Remaking of Work. Oxford: Oxford University Press.
Baker, W. E. and Faulkner, R. R. (1991). ‘Role as Resource in the Hollywood Film Industry,’
American Journal of Sociology, 97 (September), 279–309.
Basuroy, S., Chatterjee, S. and Ravid, S. A. (2003). ‘How Critical Are Critical Reviews? The
Box Office Effects of Film Critics, Star Power, and Budgets,’ Journal of Marketing, 67
(October), 103–117.
Bendersky, C. and Hays, N. A.(2012).‘Status conflict in groups,’ Organization Science, 23 (2),
323-340.
Borgatti, S. P. and Jones, C. (1996). ‘A Measure of Past Collaboration,’ Connections, 19 (1),
58-60.
Caldwell, T. (2011). The Film Analysis Handbook, Insight Publications.
Cattani, G. and Ferriani, S. (2008). ‘A Core/Periphery Perspective on Individual Creative
Performance: Social Networks and Cinematic Achievements in the Hollywood Film
Industry,’ Organization Science, 19 (6), 824-844.
Cattani, G., Ferriani, S., Fredriksen, L. and Täube, F. (2011). ‘Project-based Organizing and
Strategic Management. A Long-term Research Agenda on Temporary Organizational
Forms,’ in G. Cattani, S. Ferriani, L. Frederiksen and F. Täube (eds), Project-based Organizing.
Advances in Strategic Management, xv-xxxix. London, UK: Emerald Group Publishing
Limited.
Chisholm, D. (2004). ‘Two-Part Share Contracts, Risk, and the Life Cycle of Stars: Some
Empirical Results from Motion Picture Contracts,’ Journal of Cultural Economics, 28
(February), 37-56.
Clevè, B. (1994). Film Production Management. Boston, Focal Press.
Daniels, B., Leedy, D. and Sills, S. D. (2006). Movie Money: Understanding Hollywood’s (Creative)
Accounting Practices. Silman-James Press.
Delmestri, G., Montanari, F. and Usai, A. (2005). ‘Reputation and Strength of Ties in
Predicting Commercial Success and Artistic Merit of Independents in the Feature Film