International Journal of Innovative Technology and Exploring Engineering (IJITEE) ISSN: 2278-3075,Volume-8, Issue-10S, August 2019
Abstract: A controller for maximum power point tracking (MPPT) based on fuzzy logic was developed to connect the solar panels and three phase grid through an inverter. MPPT controller traces the maximum power and then feeds this power to the three phase grid irrespective of the changes in solar irradiations. The input and output variables for the fuzzy logic controller were selected in order to vary the inverter firing angle to track the maximum power from the solar panels. The proposed system using fuzzy logic controller was built using MATLAB Simulink /Power System Block (PSB) set. A DSP controller has been embedded with program for firing of the thyristors used in the inverter with appropriate pulses. Hardware of the entire system was fabricated in the laboratory and the outputs from the PV array of 90 volts, 11 amperes are exhibited. Both the hardware and simulation outputs have been compared which are in close agreement to validate the suggested system.
Index Terms: Line commutated inverter, photovoltaic cell, SEPIC converter, Maximum Power Point Tracking.
I. INTRODUCTION
The use of renewable energy plays a major part in meeting the energy demand of any country. Because of this, presently the world is looking forward to replace the fossil fuels with renewable energy sources. Among many available renewable energy sources such as solar energy, wind energy, biomass energy, fuel energy etc., solar energy is one of the most convenient and popular form of renewable energy. The utilization of solar energy will be very important in India because of availability of the abundant solar energy. Major advantage of solar energy is that it is maintenance free and environmental friendly. Major drawback is the high installation cost of the system. Photovoltaic systems have a structure which contains solar cells, connection, protection and storage components and also some additional components. Because of variable irradiation throughout the day, the solar cell will not produce a constant and maximum power throughout the day. For the purpose of extracting the maximum power from the photovoltaic array, there is a need
Revised Manuscript Received on July 08, 2019.
T. Shanthi, Assistant Professor, Electrical and Electronics Engineering DepartmentKumaraguruCollege of Technology, Coimbatore - 641 049, Tamil Nadu, India.
S. U. Prabha, Professor and Head, Electrical and Electronics Engineering Department, Sri Ramakrishna Engineering College, Coimbatore – 641 022, Tamil Nadu, India.
for maximum power point tracker (MPPT) [1]. This tracker is designed for controlling the power electronic interfaces between solar array and load.
Numerous methods were presented for implementing MPPT [2]. The perturb and observe (P&O) method calculates the dP/dV in order to identify the maximum power point (MPP). This method is relatively simple to implement but under rapidly varying irradiance conditions it cannot track the true MPP [3,4]. In the incremental conductance method MPP is tracked rapidly and also under varying irradiance conditions it shows better results but it has more complexity in the algorithm, which makes use of the calculation of dI/dV and also cost is high [5,6]. In the constant voltage method [7], 76% of open circuit voltage is used as the voltage at maximum power point (MPP), and in the current method [8] 75% of the short circuit current is used as the MPP current. These methods are simple, but accuracy of tracking MPPs is not good. In [8], a single-stage PV generation system with ripple correlation control is proposed, but the tracking capability of this technique is low because tracking steps are needed as large around the MPP. Most recently, hybrid MPPT for partially shaded photovoltaic arrays has been reported by hadi m. el-helw, et al in [9]. This new MPPT algorithm combines perturb and observe artificial neural network (ANN) technique. Fuzzy logic control (FLC) approach of MPPT for PV systems also has been reported in [10,11]. In [12], Ahmad H.ElKhateb, et al proposed that FLC approach shows fast convergence in tracking true MPP. The above literature studies states that the fuzzy logic controller provides better tracking performance than with the other conventional tracking techniques. This shows the better performance while connected with isolated loads. This paper proposes a MPPT using fuzzy logic controller (FLC) for the solar panel with a SEPIC converter and natural-commutated inverter. The SCRs have natural commutation property [13]
which is utilized here.
II. PROPOSED SCHEME
The proposed system in Fig. 1. , consists of solar PV arrays, SEPIC converter, the fuzzy logic controller and a full-bridge SCR inverter. The solar panel receives the solar radiation and converts this to dc
electrical power. This dc power is given to the SEPIC converter
MPPT Controller Based on Fuzzy Logic for
Photovoltaic Systems using
Line-Commutated Inverter and Sepic
Converter
and then to the thyristor bridge inverter and then to the utility grid. The SEPIC converter steps up the voltage from the solar panels and feeds the inverter. The ac power at the inverter output is supplied to the three-phase grid.
[image:2.595.319.555.174.313.2]The actual power is measured at the inverter output and the reference power is computed using open-circuit voltage Voc and the short-circuit current Isc. The Pact and Pref are given to the FLC. Corresponding to the variations in atmospheric temperature and irradiation values, the Voc and Isc also varies respectively. The firing angle of the line-commutated inverter is adjusted based on the difference between the Pact and Pref such that the maximum power will be supplied to the grid. The voltage level at the output of the PV array is stepped up using the SEPIC converter in order to match with the power of the grid. This makes the system to operate properly to feed the maximum power.
Fig. 1. PV array connected with grid.
A. Model of The PV Array
Among the various models given for PV array in the literature [14], a simple and efficient model given in [15,16] has been chosen for this proposed scheme.
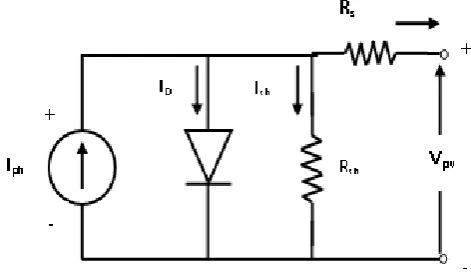
Mathematical equation to represent the PV cell is given by Eq. (1):
sh D D ph pv
R V I I
I
(1)
The characteristics of the diode is given by
) 1 ( /
0
V V A
D I e D T
I
(2) Voltage of the diode is given by
S PV PV
D V I R
V
(3)
Photovoltaic current Iph is expressed by
)) (
( SC 1 ref
ph I K T T
I
(4)
Here I0 is the dark current, VT – thermal voltage of PV modules and is equal to kT/q, q is the charge of an electron which has the value of 1.6 x 10⁻¹⁹ Coulombs, k is the
Boltzman constant of value 1.38 x 10⁻²³ J/K, T is the junction temperature in Kelvin, A is the ideality factor based on manufacturing of PV cells, ISC is short-circuit current at standard test condition of 1000 W/m2 and 250C, K1 is the coefficient of the short-circuit current of the cell, TRef is the reference cell temperature, is the solar irradiance in W/m2
. Fig. 2 shows the electrical equivalent of photovoltaic cell. This PV model is utilized for simulation of the proposed scheme.
Fig. 2. Electrical Equivalent of PV cell
B. SEPIC Converter
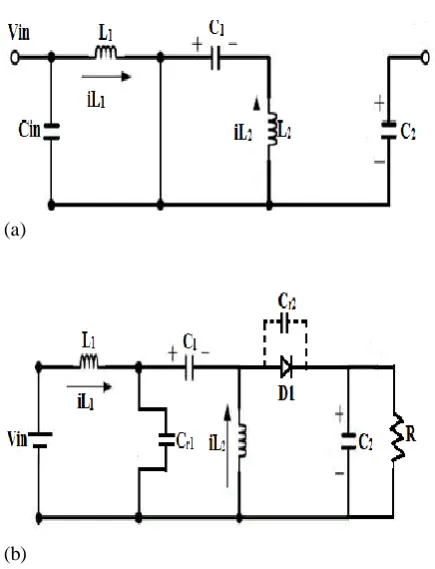
The power circuit of the SEPIC converter is given in Fig. 3. A SEPIC is a single-ended primary inductor converter. It is a DC-DC converter. It consists of boost stage followed by a buck-boost stage. This converter produces the output which has the same polarity as the input. This means the output polarity and input polarity are same. Also this converter has true shutdown property. These are the major advantages of this converter. The output voltage will be less than, or greater than, or equal to its input voltage. This converter is broadly utilized in applications involving battery operation. By adjusting the converter duty ratio, the output voltage is varied. MOSFET control switch is used in this system. Advantage of MOSFET is that it has much higher input impedance, less voltage drop and minimum switching losses. This SEPIC has four energy storage elements namely two inductors and two capacitors. The energy is transferred from input to output using these elements. The boost stage involves inductor L1 and MOSFET; whereas the buck-boost stage involves inductor L2.
Fig. 4(a) and (b) represents the electrical equivalent of the SEPIC converter during ON and OFF conditions respectively. The duty cycle of the SEPIC converter is given by
f wd out in
f wd out
V V V
V V D
(5)
[image:2.595.59.272.258.425.2]International Journal of Innovative Technology and Exploring Engineering (IJITEE) ISSN: 2278-3075,Volume-8, Issue-10S, August 2019
Fig. 3. Power circuit of SEPIC converter
(a)
[image:3.595.311.538.48.223.2](b)
Fig 4. SEPIC converter equivalent circuit when (a) Switch is ON (b) Switch is OFF
C. Analysis of Inverter
Fig. 5 shows the power circuit of the three-phase full bridge inverter. By adjusting the firing angle, this circuit can be operated as a rectifier or as an inverter. In this system, the converter acts as an inverter. Also the normal firing sequence of the thyristors is (1 2), (2 3), (3 4), (4 5), (5 6), and (6 1). When the firing angle is greater than 90 degree, the circuit works as an inverter. A separate synchronization circuit is not needed for synchronizing the ac output with the utility grid. The use of SCRs in the circuit makes this as possible. The average dc voltage is given by
6 / 5 6 / sin 3 / 2 12
V td t
Vdc m
(6) cos 3 3 m dc V V (7)
Fig. 5.Power circuit of line commutated inverter integrated with grid
(i) Harmonics
kth harmonic current in phase-R has the rms value as given by
3 2
2 2
1 2 2
k Sin I k b a
IRk k k dc
(8) The fundamental current has the rms value as
dc dc
R I I
I 1 6 0.7797
(9)
R-phase current in rms is
dc dc
dc
R I d t I I
I 0.8165
3 2 )
( 2
2 (5 /6) 1/2 )
6 / (
2
(10)Total harmonic distortion (THD) is
1 2 / 1 2 1 2 ) ( I I I
THD rms
3108 . 0 ) ( 1 2 / 1 2 1 2 R R R I I I (11) Therefore
THD = 31.08 %.
This value gives the THD for the line-commutated inverter.
III. FUZZY LOGIC CONTROLLER
Generally the control method is a point to point control which has conclusion either be true or false. But the system would not be accurate at all the time; it may sometimes fail depending on the situations. So the system which is not accurate and clear and in order
[image:3.595.55.273.190.475.2]system may arise due to non-linearity of the system characteristics and lack of information about the problem or due to receipt of information from more than one source about the problem which is conflicting. The parameter variations in the system due to atmospheric changes cannot be accurately detected by the classical controllers, because they have the fixed-gain for the feedback. Further, there is a complexity in determining the mathematical model of the system and controller tuning. For nonlinear control applications, the fuzzy logic controller is used. This fuzzy system does not require the exact mathematical model of the plant. This is well suited for low-cost implementations. Such systems can be easily upgraded by the addition of new rules to improve the performance. Fig. 6 shows the block diagram of fuzzy logic control scheme. It consists of three parts: fuzzification, fuzzy inference system and defuzzification as described below:
Fig. 6 Fuzzy logic controller
A. Fuzzification
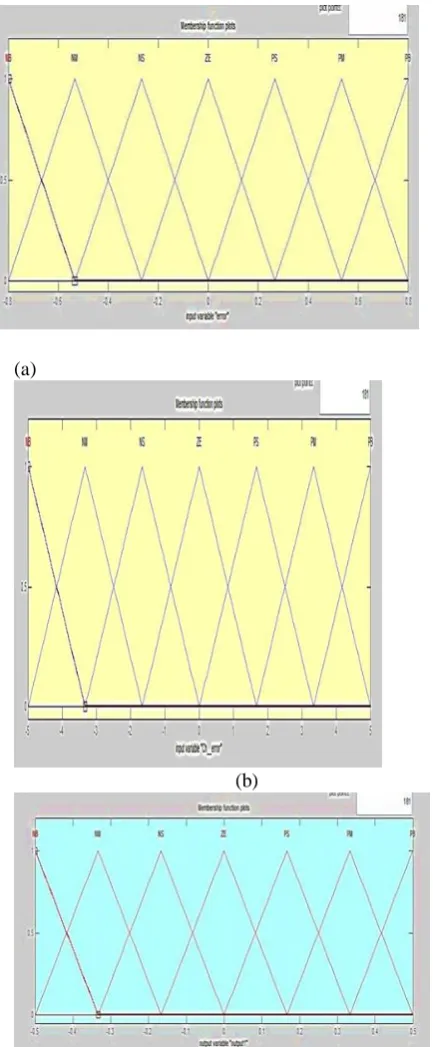
Fuzzification process transforms the crisp values into fuzzy values. Every crisp input will be processed by the Fuzzy Inference System. Each of these inputs have their own group of membership functions (MF). The input and output membership functions are designed. The fuzzy subsets such as nb (negative big), nm (negative medium), ns (negative small), ze (zero), ps (positive small), pm (positive medium), and pb (positive big) are used to assign the values of MF (membership function) to the variables. The input variables are e and de, where e is the difference between Pref and Pact; de is the difference in error. The difference in firing angle, d is the output variable. The membership function selected is triangular (trimf). For the input variables e, de and the output variable d, the MFs are shown in Figs. 7 (a), (b) and (c) respectively. From the previous knowledge of the parameters measured, the range of MFs are decided. From the results of the system in open loop configuration, it is found that the deviation of the grid power with respect to the reference power is between -50 W and 50 W. de is set between -1 and 1W and d is set between -45 and 45. The reference maximum power and is calculated using Eq. (12).
Pref = K1.Voc x K2.Isc (12)
where K1=0.76; K2=0.8; [13]
Thus the maximum power of the PV array is given by
Eq.(12).
The input variables are given by
Error e(k) = Pref - Pact (13)
Change in Error de(k)=e(k)-e(k-1)(14)
At the maximum power point of the PV array, the error will be zero.
(a)
(b)
[image:4.595.56.262.271.374.2](c)
International Journal of Innovative Technology and Exploring Engineering (IJITEE) ISSN: 2278-3075,Volume-8, Issue-10S, August 2019
B. Fuzzy Inference System
[image:5.595.314.528.453.629.2]The rule base and implication are the two main functions of inference engine. The fuzzified inputs are given to this and after that the rule base is enhanced; By using the fuzzy implication method, the output fuzzy sets are found. The rule base is shown in Table 1.
Table 1 Rule Base
e/ de NB NM NS ZE PS PM PB
NS NB NB NB NB NM NS ZE
NM NB NB NB NM NS ZE PS
NB NB NB NM NS ZE PS PM
ZE NB NM NS ZE PS PM PB
PS M N NS ZE PS PM PB PB
PM NS ZE PS PM PB PB PB
PB ZE PS PM PB PB PB PB
The variables are e, de and d. The MIN–MAX method is employed.
C. Process of defuzzification
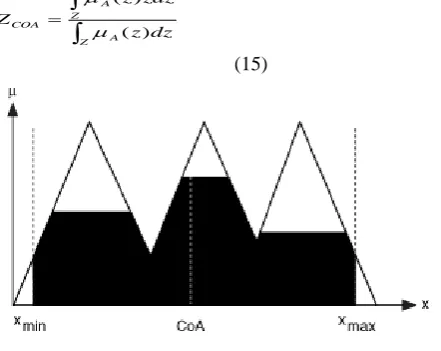
When the fuzzy implication is over, location of fuzzy region for the output is done. The purpose of defuzzification process is to obtain the crisp value of the desired output. In the proposed system, centroid of area method is utilized for defuzzification process. In this method, the actual change in the firing angle delay is computed using Eq. (15). Fig. 8 illustrates the CoA( Center of Area) defuzzification method in which x is the value of the linguistic variable, the range for these variables is xmin and xmax., μ is the degree of membership. The shaded portion gives the area of the membership functions.
Z A
Z A
COA
dz z
zdz z Z
) (
) (
[image:5.595.61.282.597.772.2](15)
Fig. 8. Centroid of area defuzzification method
IV. SIMULATION
This system uses the solar PV array with the rating of 90 Volts, 11 Amperes. The individual panels has the rating of 17 V, 3.4 A.. The grid power is measured by sensing the grid voltage and grid current. This power and the grid reference power for the corresponding Voc and Iscare then compared. The difference between these two is taken as the error and correspondingly the inverter firing angle is also varied to give the maximum power to the utility grid. This difference and the previous value of firing angle are added each time and the inverter switches are triggered consequently.
The model of PV array was constructed in MATLAB Simulink/Power System Block set with a controlled current source (Id), a current source (Isc) and other basic building blocks. Also the SEPIC converter and the three-phase inverter circuit were modelled using MATLAB/PSB. Already built PV model is properly connected through the dc link with the SEPIC converter, and the output is given to the inverter. The output from the inverter is then connected to the three-phase grid. Fig. 9 shows the variation of firing angle with respect to the grid power.
It is evident from the results that the error reduces and finally attains zero. Therefore the difference between the two powers is minimized to nil value. The firing angle delay, is raised to attain the MPP and after that does not vary.
Fig. 9. Firing angle Vs grid active power
V. HARDWARE IMPLEMENTATION
The prototype of the system has solar panels of 90 Volts, 11 Amperes, a SEPIC converter, dc link inductance, an inverter circuit, and a controller for firing pulse generation. The DSP controller TMS 320F2812 is used to generate the firing pulses. The SEPIC
constructed in the laboratory. To avoid the reverse flow of power from grid to PV array, a blocking diode is in series connection with PV array and power electronic interface. The maximum power is derived from the PV array using the designed MPPT controller.
The SCRs are fired with the pulses related to the maximum power which are obtained from the simulation. The firing sequence of SCRs is (5,6), (6,1), (1,2), (2,3), (3,4), (4,5) and is more than 90. The program has been embedded with the DSP controller for firing pulse generation related to maximum power.
Table 2 shows the comparison of the experimental and simulation results of the system.
From the comparison chart, the results are very close to each other which validates the proposed scheme.
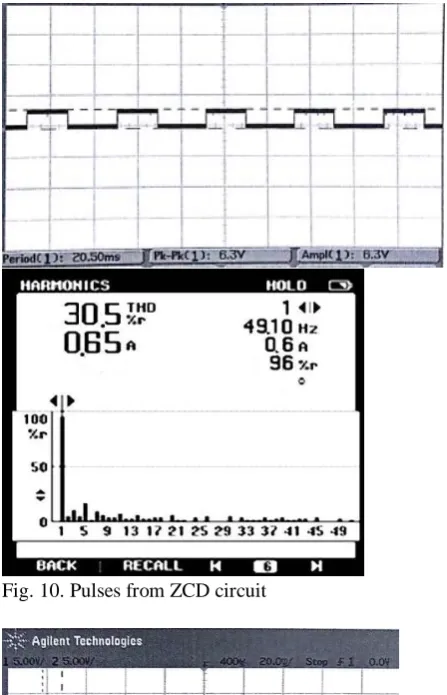
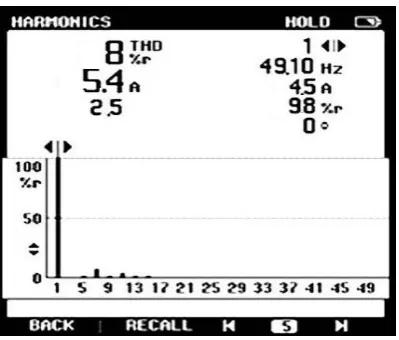
The pulses from the ZCD circuit is shown in Fig. 10 and the pulses to the inverter is shown in Fig. 11. The DC current waveforms are shown in Fig. 12. The waveforms of grid voltage are shown in Fig. 13. The total harmonic distortion (THD) is observed for the grid current. Fig. 14 and Fig. 15 represents this current with and without filter. The THD without filter is 30.5%. By using the filter the THD of the grid current reduces to 8%.
Table 2 Hardware and Simulation Results
Quantities Simulati
on
Experime nt
DC current, Idc (A)
7.5 8
DC link voltage, Vdc
(V) 400.5 400
Current in grid, Inm
(A) 5.2 5.6
Real power to the grid,
Pml (W) 142 145
Firing angle
corresponding to maximum power
[image:6.595.59.530.41.715.2]160 152
[image:6.595.314.538.49.397.2]Fig. 10. Pulses from ZCD circuit
Fig. 11.Pulses to the inverter
[image:6.595.63.523.370.690.2]International Journal of Innovative Technology and Exploring Engineering (IJITEE) ISSN: 2278-3075,Volume-8, Issue-10S, August 2019
[image:7.595.57.257.305.475.2]Fig. 13. Grid voltage - Experimental
Fig. 14. Grid current THD without filter
Fig. 15. Grid current THD with filter
VI. CONCLUSION
An interface for connecting solar panels with the grid through a SEPIC converter and inverter has been developed. Simulation has been carried out for this system with fuzzy logic controller. The results from the experimental set-up and simulation are observed and compared. From the comparison, the observation is that the results from the simulation and the experimental results are closely matching, which confirms the accuracy of the system. Therefore, this method is more efficient for tracking the peak power and feed to the grid. The complexity of the circuit is reduced with the use of SCRs. However, the presence of an inverter creates certain amount of harmonics in the grid current. These harmonics are eliminated by using a capacitor bank. From the THD measurement of the waveforms of grid current 30.5% of THD is observed. The THD in the grid current waveform closely agrees with the calculated value (31.08%).
REFERENCES
1. Ohnishi T, Takata S. ,’Comparisons of maximum power tracking strategy of solar cell output and control characteristics using step up/down chopper circuit’, Transactions of IEEJ, 1992,112-D(3), 250–257.
2. NurAtharahKamarzaman, Chee Wei Tan, ‘A comprehensive review of maximum power point tracking algorithms for photovoltaic systems’, Renewable and Sustainable Energy Reviews, 2014, 37, 585–598. 3. Koutroulis E, Kalaitzakis K, Voulgaris NC., ‘Development of a
microcontroller based, photovoltaic maximum power point tracking control system’, IEEE Transactions on Power Electronics, 2001, 16, (1), pp. 46–54.
4. JiradaGosumbonggot,‘Maximum Power Point Tracking Method using Perturb and Observe Algorithm for small scale DC voltage converter’, Procedia Computer Science(Elsevier), 2016, 86, pp. 421 – 424. 5. BidyadharSubudhi, RaseswariPradhan.,‘A Comparative Study on
Maximum Power Point Tracking Techniques for Photovoltaic Power Systems’, IEEE Transactions on sustainable energy, 2013, 4, (1), pp. 89. 6. T.Shanthi.,‘Incremental Conductance Method of Maximum Power Point Tracking for Photovoltaic Array with Single Switch DC/DC Converter’, Journal of Advanced Research in Dynamical and Control Systems, 2017, 9, Sp-16, pp. 1181-1191.
7. K. K. Kumar., R. Bhaskar., and H. Koti., ‘Implementation of MPPT algorithm for solar photovoltaic cell by comparing short-circuit method and incremental conductance method’,Procedia Technology, 2014, 12, pp. 705–715.
8. Casadei D, et al.,‘Single-phase single stage photovoltaic generation system based on a ripple correlation control maximum power point tracking’, IEEE Transactions on Energy Conversion, 2006, 21, pp. 562-568. 9. Hadi m. el-helw, Ahmed magdy1, and Mostafa i. marei., ‘A Hybrid
Maximum Power Point Tracking Technique for Partially Shaded Photovoltaic Arrays’, IEEE Access, 2017, 5, pp. 11900–11908. 10. Ahmad El Khateb, JeyrajSelvaraj, and Mohammad Nasir Uddin.,
‘Fuzzy-Logic Based SEPIC Converter for Maximum Power Point Tracking’, IEEE Transactions on Industry Applications,2014, 50, (4), pp. 2349-2358.
11. T.Shanthi., J.MohanaPriya., ‘Standalone Hybrid Power Generation Using Photovoltaic/Wind/Fuel Cell’, International Journal of Applied Engineering Research, 2015, 10, (20), pp.18612-18616.
12. Ahmad H.ElKhateb, NasrudinAbd Rahim, JeyrajSelvaraj.,‘Fuzzy Logic Control approaches of a maximum power point employing SEPIC converter for standalone photovoltaic system’, Procedia Environmental Sciences (Elsevier), 2013, 17, pp. 529 - 536.
13. T. Shanthi,, N. AmmasaiGounden., ‘Power electronic interface for grid-connected PV array using boost converter and line-commutated inverter with MPPT’, IEEE Conference proceedings International Conference on Intelligent and Advanced Systems, Nov.2007, pp.882-886.
14. Rodrigues EMG, et al., ‘Simulation of a solar cell considering single diode equivalent circuit model’, International conference on renewable energies and power, May 2011, 1, (9), pp. 369 - 373.
15. W. Xiao, F. F. Edwin, G. Spaguolo, and J. Jatskevich,, ‘Efficient Approaches for Modeling and Simulating Photovoltaic Power Systems’, IEEE Journal of Photovoltaics, 2013, 3, (1), pp. 500-508.
16. T.Shanthi., A.S.Vanmukhil., ‘ANFIS controller based MPPT Control of Photovoltaic Generation System’, Research Journal of Applied Sciences, 2013, 8, (7), pp.375-382
AUTHORSPROFILE
T. Shanthi, Assistant Professor, Electrical and Electronics Engineering DepartmentKumaraguruCollege of Technology, Coimbatore - 641 049, Tamil Nadu, India.