International Journal of Innovative Technology and Exploring Engineering (IJITEE) ISSN: 2278-3075, Volume-8 Issue-6S, April 2019
Abstract: As a low- cost sensor, the C-core Hall sensor finds its application in wide area. The magnetic field strength at Hall element is the important parameter of the interest in C-core current sensors. The main objective of this paper is to calculate the B field at the centre of the air gap. Open loop current sensor using FEA tool for mid-range sensing applications with C-core using hall sensing technology is designed.
Keywords: C-core, Current sensor, Hall-Effect, 2D, Magnetic field.
I. INTRODUCTION
There are different ways magnetic sensing technologies are available nowadays. The name of the few technologies such as Hall Effect, Anisotropic Magneto Resistive , Magneto Resistive.Hall-effect magnetic detector are essential in voltage isolation from the current path and the Hall element integration. Magnetic field analysis is the key element which has to be done for sensing the current. In such case C-type core is mainly used along with the hall sensor. Various schemes are adopted for field analysis are Magnetic circuit analysis,physics based modelling, FEM simulation and Lab experiments. This paper deals with the FEA based analysis of current sensor. The model designed which contains a C-core surrounding on the conductor. Hall sensor is placed at the air gap where the current need to be sensed [2]. B- Field at the hall sensor is calculated by two
A current transformer is censorious component in a power system. Since, it is a series connected component, a breakdown or fault occur in the CT may affect major areas in the grid. Under transient condition the accurate evaluation and analysis are improved by performance and reliability of Current Transformer. During a short-circuit condition, considerable amount of mechanical forces occur in conductor of CT, due to the passage of a large current passes through the primary winding. These forces leads to separate the conductors of both primary and secondary.
For evaluating purpose, Current Transformer behavior under steady state condition and transient conditions such as short-circuit, inrush,high burden, etc., the density of current and its constituent parts must be known. Undertransient conditions the CT is fed by primary currents while current at the secondary is not known. The proposed article describes analysis and modeling, of steady state and transient phenomena (like saturation of CT in short-circuit and high voltage during high burden conditions).
Revised Manuscript Received on April 15, 2019.
K.P.Viveka, Assistant Engineer, Tamilnadu Electricity Board, Chennai
S.Prakash, Professor, Bharath Institute of Higher Education and Research, Chennai
Such analysis is anticipated to get a specific calculation of short circuit current and windings are focused in transient conditions. In this article, Investigation has been done based on Finite Element Method using 2D simulation techniques. Hall Effect Technology
The Hall voltage signal output is linearly proportional tosloping component of the flux density passing through the sensing element [4].Lorentz forces created the Hall Effect, which act on charges moving through the magnetic field. FL=q(VxB)
ℎ𝑎 𝑙 𝑙 = Output Hall Effect Voltage
B = Magnetic Field created by Magnet or Current-carryingConductor
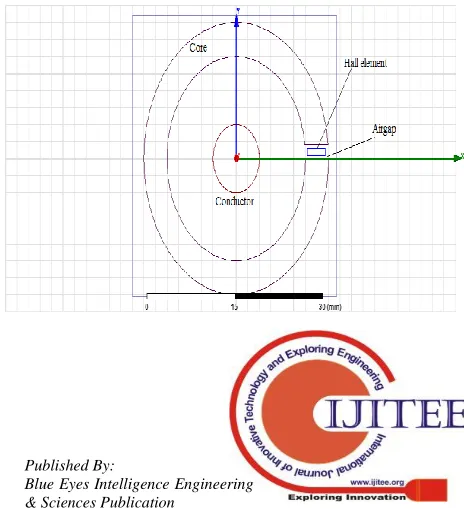
[image:1.596.311.543.576.831.2]2D Model of Current Sensor under study
Fig. 1 current sensor at open loop in 2 dimension The Fig1 shows the current sensor at open loop condition with 2 dimension. The symmetry is axis in open loop current sensor, hence the 2D design is easy and results produced are also accurate compare to other design.
Finite Element Analysis of Current Transformer in
Power System
In Fig 2b the meshing used in FEA design. Number of elements in hall element is taken such that the accurate output results are obtained.Exactly at the centre of the airgapHall sensor is placed.
Fig. 2 Mesh plot
Fig. 3 Line integral calculation ofB Field
Fig. 4 Point integral calculation of B Field Calculation of B-field
In general the magnetic field lines are formed around conductor which carrythe current.It can be calculated with the expression.
𝜇 𝐼
2𝜋 𝑅
Where μ is the free space permeability, I is the current around the conductor and, r is the distance from the current conductor centre point.
FEM Analysis Flowchart
II. SIMULATION RESULT Shaded Plot
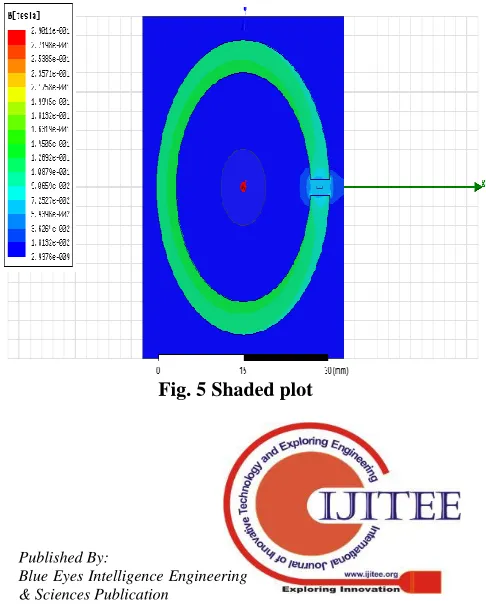
[image:2.596.52.286.101.468.2]The shaded plot displays the model outline, or the outline of a slice through the model and a field. The field values are represented by a range of colors. The field point at the least area of North Pole yields B value as positive. Similarly, the field point at the least area of South Pole yields B value as negative. The magnitude of B Field at the center of the Hall sensor is analyzed.
[image:2.596.314.557.530.835.2]International Journal of Innovative Technology and Exploring Engineering (IJITEE) ISSN: 2278-3075, Volume-8 Issue-6S, April 2019
Arrow Plot
[image:3.596.316.545.75.218.2]The arrow plot displays the model surface, or the outline of a slice through the model and a grid of arrows. The direction and length of the arrows represent the field plotted direction and magnitude. The Fig 5 shows the magnetic field direction over the hall sensor which indicates the presence of perpendicular field.
Fig. 6 Arrow plot near Hallsensor Flux Plot
[image:3.596.55.283.142.288.2]To obtain the flux path in the single plane with the help of the field results in the 2D planeare known as flux plot. The outer region of core near to conductor has less intense flux lines compared to the inner region.
Fig. 7 Flux plot
[image:3.596.312.543.258.400.2]Circuit diagram for transient state condition
Fig. 8 Fig. 9
Fig 8. The primary coil representations as circuit in FE tool with current source, the sinusoidal current applied is 1200 A.
Fig 9. The secondary coil representation as circuit in FE tool with open circuit condition (very high value is connected).
Flux linkage waveform under open circuit condition
Fig. 10
In fig 10.The primary flux linkage for the applied current of 1200 A. It is varying between + 0.275 Wb.
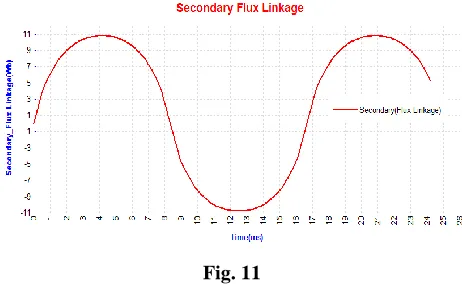
Fig. 11
In fig 11.The induced flux linkage predicted at secondary coil. It is varying between + 10.8 Wb.
Voltage waveform under open circuit condition
In Fig11 the open circuit induced voltage at the secondary of the CT is varying between +8000 Volta to – 8000 Volts for the sinusoidal input current value of 1200Amps.
Simulation Result for open circuit
[image:3.596.55.286.381.543.2]In Fig.13 the value of B predicted at 12.5 ms where the primary flux linkage is maximum. Here the B-field also maximum with the value of 1.25 Tesla.
[image:3.596.317.542.557.837.2] [image:3.596.51.289.568.690.2]In Fig.14 the B-field value at 15.9 ms is 0.62 Tesla, which is at half value flux linkage position.
Fig. 14
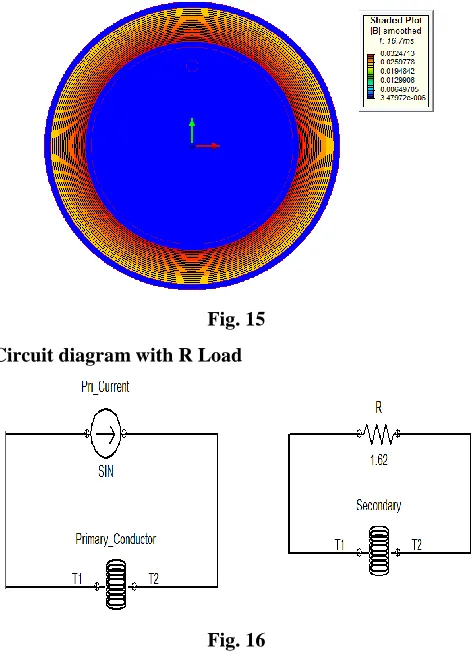
[image:4.596.75.276.83.253.2]In Fig.15 the value of B –field predicted at 16.7 ms, which is closer to the zero value of linkage. It is around 0.03 Tesla.
[image:4.596.307.550.214.391.2]Fig. 15 Circuit diagram with R Load
Fig. 16
[image:4.596.51.288.292.619.2]In the Fig.16, the circuit is connected with the R load in order to see the current, Voltage and flux linkage waveform for the primary and secondary are shown below.
Fig. 17 Current waveform
[image:4.596.306.540.468.657.2]From the Fig. 17 the expected current value of 5 A is induced in the secondary of the CT
Fig. 18 Voltage waveform
In Fig.18The open circuit induced voltage at the secondary of the CT is varying between +8000 Volts to – 8000 Volts for the sinusoidal input current value of 1200 Amps.
Fig. 19 Flux linkage waveform
[image:4.596.54.292.669.781.2]International Journal of Innovative Technology and Exploring Engineering (IJITEE) ISSN: 2278-3075, Volume-8 Issue-6S, April 2019
[image:5.596.312.544.52.271.2]Circuit diagram with RL Load
Fig. 20
[image:5.596.49.293.56.191.2]In the Fig.20, the circuit is connected with the RL load in order to see the current, Voltage and flux linkage waveform for the primary and secondary are shown below.
[image:5.596.50.282.237.744.2]Fig. 21 Current waveform for RL Circuit
Fig. 22Flux Linkage waveform for RL Circuit
Fig. 23Voltage Waveform for RL Circuit
Table shows the perpendicular B field at the centre of the Hall sensor. The perpendicular B field calculated for various current values at a point and on a line at the centre of the hall. The results show that both methods have same values with difference in decimals.
Table. 2(a) B Field at the point Vs Current References Current (Amps) B-Field (Gauss)
0 0
10 65.60987
20 131.2285
30 196.8617
40 262.5175
50 328.2036
60 393.9275
70 459.6971
80 525.5201
90 591.4043
100 657.3580
Table. 2 (b) B-Field in a line Vscurrent
Current (Amps) B-Field (Gauss)
0 0
10 65.62565
20 131.2606
30 196.9014
40 262.5911
50 328.2819
60 394.0077
70 459.78
80 525.6385
90 591.5388
[image:5.596.53.280.246.479.2] [image:5.596.304.549.382.544.2] [image:5.596.50.281.496.745.2]III. CONCLUSION
The values calculated in a centre line and at the centre point are same. Thus FEA tools determines that both the method are producing the same output for calculating B field in two different methods.The applications for linear Hall-effect sensor in open-loop current sensing continue to develop and expand. Presently, the devices available are far superior to any earlier linear and advancements in design, processing, packaging, testing, etc. are incessant andrelentless.
REFERENCES
1. P. Rafajdus, P. Bracinik, V. Hrabovcova, J. Saitz, L. Kankula, “Current Transformer Analysis under Transient Conditions,” XIX International Conference on Electrical Machines - ICEM 2010, Rome
2. G.Sangeetha,S. S.Sherine& Prakash, “Online Monitoring of Higher Rated Alternator using”Automated Generator Capability Curve administer”, International Conference on Recent Trends in Electrical,Control and Communication, IEEE Xplore,Jan 28, 2019. 3. S. Prakash & K.Sakthivel, “Efficient Transformerless Mosfet Inverter
for Grid-Tied Photovoltic System”, International Journal of Pure and Applied Mathematics, Volume 119 No. 12 2018, 7787-7796.
4. M. Tumay, R. R. S. Simpson, H. El-Khatroushi, "Dynamic model of a current transformer," International Journal of Electrical Engineering Education 37/3, pp. 268-276