International Journal of Innovative Technology and Exploring Engineering (IJITEE) ISSN: 2278-3075,Volume-8 Issue-12, October 2019
Abstract: Sufficient reactive power requires to maintain system terminal voltages. Reactive power is an important ancillary service requires to be provided locally. Reactive power management involves two main important parts economical reactive power procurement and economical reactive power dispatch which also satisfy technical constraints. Main centering of this work is to dispatch reactive power by considering it as important optimization problem of power system. ORPD is solved as single objective function and multi objective function. Two main objective functions (1) Minimization of real power loss and (2) Diminution of L-index are considered and problem is tested for different IEEE bus systems and results were compared for SPEA and NSGA-II techniques.
Keywords :Genetic Algorithm (GA), Particle Swarm Optimization (PSO) and Differential Evolution (DE), Strength Pareto Evolutionary Algorithm (SPEA), Non-Dominated Sorting Genetic Algorithm -II (NSGA-II) )..
I. INTRODUCTION
Reactive power management means to procure economic reactive power and dispatch it optimally. Many researcher has calculated procurement cost for reactive power from different reactive power sources like synchronous generator, Synchronous condensers, Capacitors and FACTS devices. And total cost is minimized by considering reactive power transmission charges (RPTC). Reallocation of reactive power generation enhances voltage stability which can be achieved by changing generator voltages, transformer tap settings, and switchable reactive power sources in system.By providing reactive power need locally and by rearranging of reactive power supply in the system, losses can be minimized. ORPD problem can be solved by optimizing various functions like system cost minimization, improving the voltage stability, losses minimization.[1] The reactive power dispatch problem can be resolved optimally by Non-Linear Programming technique which has many limitations as long execution time, insecure convergence properties, and algorithmic complexness. While in, the gradient-based methods gives local minima and the solution obtained will not be the optimal one. And in sensitivity analysis method, the linear objective function is used and constraints are around an operating point[2-5]. In the third type of method -Heuristic methods have been implemented to get impressive optimal solution in the problem space [4].
Power flow optimization is main problem of interest in
Revised Manuscript Received on September 05, 2019.
Vishnu Patel, Research Scholar, R.K.University,Rajkot,Gujarat India, . Email: [email protected],Mo. No. 8925298492
Assistant Professor,U.V.Patel College Of Engineering,Ganpat University,Kherwa,Mehsana, Gujarat
Dr. Rajesh M. Patel, Electrical department, Marwadi University, Rajkot, India. Email: [email protected]
power system and it can be subdivided into two sub problems, active power and imaginary Power Dispatch [6]. Reactive power support is necessary to hold voltage stability and reliability of the system. Hence it is important to optimize reactive power need of system which is very challenging task for system engineers to perform. The active power can be controlled by bus voltage angles and reactive powers can be controlled by voltage magnitude [7]. Reactive power can be controlled by changing excitation of generator, by setting taps of transformer, and using reactive power sources like capacitor and FACTS.
A. Reactive Power Optimization Selecting a Template RPD issue is optimization problem and tried to solve using various classic method and several evolutionary computing based optimization techniques. These techniques include Artificial Bee Colony (ABC), Differential Evolution (DE), Genetic Algorithm (GA), Particle Swarm Optimization Maintaining the Integrity of the Specifications.(PSO) and Teaching Learning based optimization (TLBO) etc. [8]. Artificial Bee Colony is an optimization algorithm basis on honey bee swarm intelligence. Genetic algorithm is natural genetic and selection mechanism-based optimization method while Differential Evolution algorithm is population basis algorithm which creates off-springs from parent providing divergent operator. The Particle Swarm Optimization contains a realistic and energetic technique for universal optimized solution of particular problem. This evolutionary technique are widely used to reduce the difficulties of classical methods. Evolutionary algorithms have been implemented to environmental and economic power dispatch problem with impressive success.
Optimal RPD can be handled as single-objective or multi objective in single objective optimization problem [9]. Many researchers have solved ORPD problem by considering different objective functions like active power loss minimization, reactive loss diminution, betterment of voltage profile, minimization of system cost and improvement of voltage security as single objective optimization or as multiobjective optimization. In [10], conventional interior method is compared with PSO and the result of both algorithms are compared for different IEEE standard bus systems. While In [11], Minimization of the losses is used as objective function and results are compared for SARGA and evolutionary programming for both IEEE 14 & 30 bus system. .
Zita A. Vale [12] has compared results using Genetic Algorithm and Linear programming method for IEEE 14 bus system. W.N.W Abdullah applied Genetic Algorithm on IEEE 14 and IEEE 30 bus systems to minimize the losses and results have compared [13].
Reactive Power Management through Dispatch
Analysis using Evolutionary Algorithms
The voltage profile improvement is main goal of Chao-Rong Chen and to achieve it simple Genetic Algorithm and modified Genetic Algorithm are used [14].
Various voltage stability indexes are used to analyze system stability. These indexes show closeness of the system to voltage postration. D. Devaraja has used L-indices to determine the voltage stability by applying GA on IEEE 30 bus and 75 bus system[15]. The Optimal Power Flow has been evaluated by P. Aruna Jeyanthy [16] using GA and PSO and tested on IEEE 30 bus system.
Many researchers have interpreted optimal RPD issue as a multi objective problem and variety of objective functions are considered in various research papers like loss minimization, improve voltage profile, minimize the system cost and improve voltage stability. M.A.Abido [18] introduced the multi objective optimal RPD and optimized active power loss and voltage stability. SPEA is used to solve the RPD issue and algorithm was applied on Wale hale 6 bus system and IEEE 30 bus system. In another paper [19] he introduced the novel multi objective evolutionary algorithm for a OPF where a fuel cost minimization and stability index of voltage improvement are objective functions. The problem is solved by using SPEA and applied on IEEE 30-bus and show that results obtained by proposed multi objective approach. Are superior than single objective optimization approach.
In this paper, two objective functions -real power loss minimization and Lindex minimization are considered and problem has been evaluated by taking alternator bus voltage, transformer taps and capacitors banks volt as control variable. The equality constraints consist the power flow equations. While, Inequality constraints contains the reactive power limits of alternators, bus voltage limits, and transformer tap position limits. SPEA and NSGA II used to optimize the goal for IEEE30 bus and IEEE 57 bus system.
II. MULTIOBJECTIVEOPTIMIZATION Multi objective problem can be developed as,
Min/M Max f(x)=[ x), x),…., x)]
Subjct to gj(x)≤0 Where,j=1,2,3,….,j x)=0 , where k=1,2,3,…,k
Where x), x),…., x) are the objective function to maximize or minimize particular values. Basically, in multi objective optimization, efforts are made to find the set of trade-off optimal solution by considering all objective to be important. Then, single best solution is selected from higher-level qualitative consideration. In a multi objective optimization algorithm compatible Pareto fronts are identified in the objective space for specific objective function. Following objectives can be achieved in a multi objective optimization:
1. The final best Pareto set is true pareto set and is subset of the Pareto optimal set.
2. In best-known Pareto set, solutions should be unvaryingly spreaded out and PF provide the decision maker to get true picture of trade-offs.
3. Best-known PF is to be capture the whole expansion of the PF. This requires finding out the solutions at the end of the objective function space.
III.PROBLEMFORMULATION
A.Formulation of objective function
Real Power Loss Minimization:
Reduction in active power loss enhances reactive power flow capacity of transmission line. Reactive power optimization problem also considers active power losses minimization of transmission line and is calculated as follows: - [11-19]
F1= Min (Ploss)
(1) Where, is sending end bus Voltage and represents receiving end Voltage; = conductance of line m; = phase angle of line m.
Voltage Stability Index ( ) Minimization: - A system experiences voltage instability when there is a fluctuation in load demand. Voltage drop problem is merely due to shortage of reactive power. Abundant numbers of Voltage stability indexes are used to improve the voltage stability. To improve voltage stability, voltage stability margin need to increase and system should be away from the voltage collapse point [18-19].
For multi bus system, Current vector can be given by following equations.
= *
= (2) Where, , , Generator and load bus voltages; , Generator and load bus current
L-indices = (3)
Where, obtain from the matrix .
= - .(4) Hence objective function is minimization of , that is,
f2 = Min ( B. Problem Constraints
Equality constraints: - Power flow equation,
(5)
(6) Where, & are the generator real and reactive power
load bus real power; & are the load bus active and reactive power; is transfer conductance; is susceptance.
Inequality Constraints:-
Generation Constraints:- Generated voltage and reactive power output are restricted within their limits.
(7) (8)
Switchable VAR sources constraints:- Its compensation are restricted within its boundaries:
(9) Transformer Constraints:- Tap setting of transformer are restricted within limits.
International Journal of Innovative Technology and Exploring Engineering (IJITEE) ISSN: 2278-3075,Volume-8 Issue-12, October 2019
Load bus voltage:- It is a state variable. Its consist load bus voltage constraints.
(11)
. IVPROPOSEDMETHODOLOGY
A. Overview
Classical methods possess many difficulties which can be eliminated by Evolutionary Algorithms efficiently and is summarized as follows:
1. Multiple Pareto-optimal solutions can be achieved by applying an algorithm many times.
2. All classical methods need basic understanding of particular problem require to be solved.
3. Performance of individual objective optimizer decides the range of solutions .
Shape of pareto optimal front effects results of some algorithms. Generally, multiobjective optimizations seeks to maintain diversified population of non-dominated solutions in a view to achieve pareto optimal front.
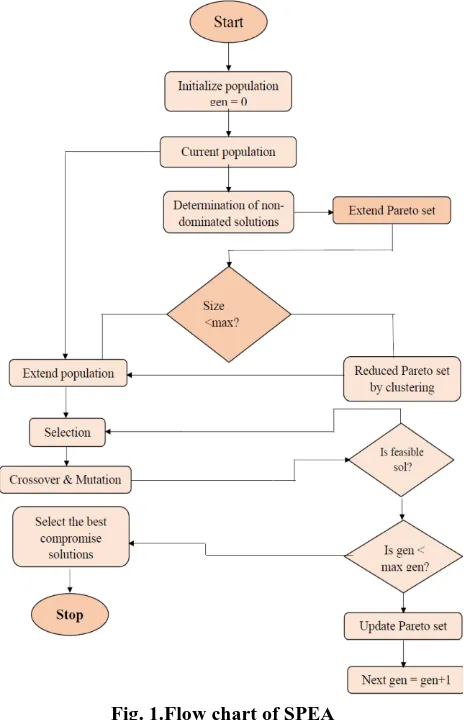
B.Strength Pareto Evolutionary Algorithm (SPEA) SPEA is multi objective optimization technique to search multiple Pareto optimal results. In this technique to get new non-dominated solutions, individual based upon number of pareto points are developed and fitness values are assigned for each individuals. Many other multi objective EAs, solved out the diversity problem using fitness and distance Metric is used to define neighborhood where population is uniformly scattered about near optimal set. Generally, algorithm is described in the following steps.
Step 1:-Initialization
Select random initial population within reliable range. Step 2: - External Update
The Pareto sets located outside sre updating as.
(a) Hunt population of non-dominated individuals and transcript into external Pareto set.
(b) Remove all controlled solutions from the set and find out new non dominated individuals of external Pareto set. (c) Externally stored individuals are more than specified max. size then using clustering decrease the set.
Step 3:- Selection
Selection is made based on competing pool between members of pool depend upon fitness function f ( ) of initial population and fitness function f( ) of offspring population.
Best solution is selected using decision rule form numbers of individuals and new offspring for new generation will be created.
Step 4:- Crossover and Mutation
The new population is formulated based on crossover and mutation operation.
Crossover: -
Linear combination of two chromosome are create two new children:
=a* +(1- a)* (12) = a* +(1- a).* (13) Where a is random weighting in interval [0,1].
As shown in equation (12) & (13) Two existing chromosome are taken from the population and create new offspring. Select random position in two chromosome and swap this location which create new children.
Mutation:- After crossover, mutation is applied to each child individually to maintain genetic diversity between different generations. At initial state level change one or more gene values in a parent with a small probability. Change the randomly select string and bit position and changing from 0 or 1. This operation may change solution entirely from the previous solution.
Step 6: - Group of Pareto optimal is much more than the pre specified values of individuals thus problem is solved by decreased no. of set of non-dominated solutions.
[image:3.595.315.547.265.625.2]Useless pareto results should be detonate from nonsubjective space and get a final value. If all PFs are constant, basically it is not possible and require for all non-dominated solutions should be kept in main storage.
Fig. 1.Flow chart of SPEA
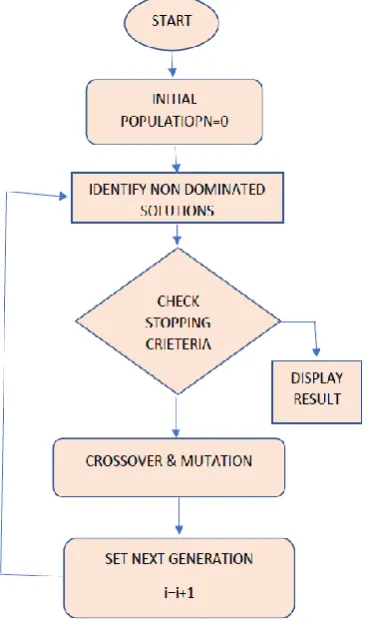
Fig. 2 Flow chart of NSGA-II
MOGA is more efficient than NSGA and it is more sensitive to sharing factor value.
Steps of NSGA-II are:
Step 1: Select random initial population.
Step 2: Fix fitness value of each population based on value of objective function.
Step 3: Check the stopping criteria then stop and display the final value.
Step 4: Crossover: Select two chromosomes randomly and using crossover operator, create new offspring.
Step 5: Mutation: From the initial population randomly select one parent solution to create a single offspring. Step 6: N solutions are selected from generated population depending upon their fitness function and back to step 2.
V. RESULTANDDISCUSSION
The suggested methods are checked on various standard IEEE bus systems like IEEE 14, IEEE 30 and IEEE 57 bus system. Here the program was written on MATLAB R2015. Results of the control variables available from from optimizations are shown below:
A.Control variables before and after Optimization using SPEA and NSGA-II
Table I :- Control Variables after and before Optimization
System Control
Parameter
Before Optimization
After Optimization
SPEA NSGA-II
IEEE 14 bus system
VG1
1.06 1.062 1.061
VG2 1.045 1.0458 1.042
VG3
1.01 1.046 1.026
VG4 1.07 1.077 1.072
VG5
1.09 1.0949 1.0924
T1
0.978 0.9914 0.979
T2
0.969 0.985 0.973
T3
0.932 0.987 0.957
IEEE 30 bus system
VG1 1.06 1.06 1.06
VG2
1.045 1.0535 1.0493
VG3 1.01 1.0236 1.0201
VG4
1.01 1.0421 1.0444
VG5 1.082 1.089 1.0821
VG6
1.071 1.0722 1.0691
T1
0.978 0.9783 0.9781
T2
0.969 0.9731 0.971
T3
0.932 0.936 0.933
T4 0.968 0.972 0.969
IEEE 57 bus system
VG1 1.06 1.062 1.059
VG2 1.045 1.046 1.039
VG3 1.01 1.0146 1.0136
VG4 1.07 1.071 1.0691
VG5 1.01 1.011 1.0122
VG6 0.985 1.0379 0.9679
VG7 0.98 0.9878 0.982
VG8 1.005 1.0333 1.0123
VG9 0.98 1.0351 1.0217
VG10 1.015 1.0267 1.0211
T1 0.97 1.0046 0.9369
T2 0.978 1.0536 1.0353
T3 1.043 1.0435 1.0357
T4
1.043 1.0439 1.0421
T5 0.967 1.0094 0.9692
T6 0.975 1.0128 1.0087
International Journal of Innovative Technology and Exploring Engineering (IJITEE) ISSN: 2278-3075,Volume-8 Issue-12, October 2019
[image:5.595.306.545.62.501.2]Table 1 shows the values of voltages for IEEE 14, 30 and 57 bus system before and after optimization using SPEA and NSGA II both techniques. While Table 2 represents best suitable solution for IEEE 30 bus system as loss minimization and Lindex minimization using SPEA technique. Figure 4 represents the best optimum solution for this two fitness function using SPEA.
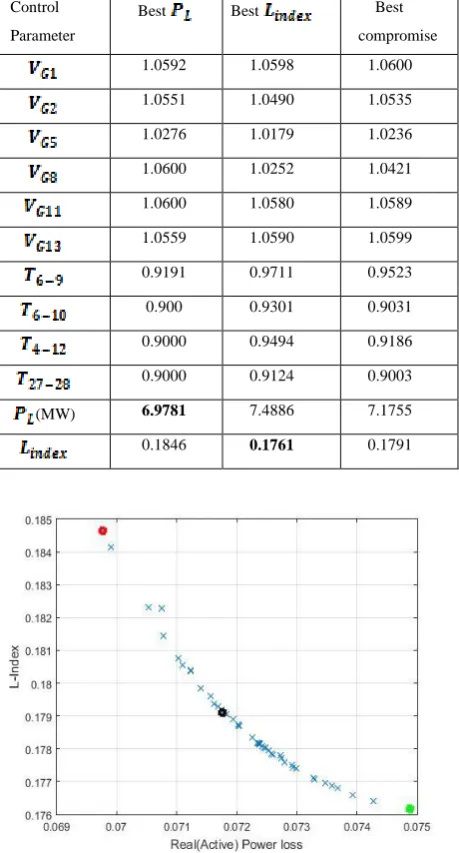
Table II:- Best compromise solution using SPEA Control
Parameter
Best Best Best
compromise
1.0592 1.0598 1.0600
1.0551 1.0490 1.0535
1.0276 1.0179 1.0236
1.0600 1.0252 1.0421
1.0600 1.0580 1.0589
1.0559 1.0590 1.0599
0.9191 0.9711 0.9523
0.900 0.9301 0.9031
0.9000 0.9494 0.9186
0.9000 0.9124 0.9003
(MW) 6.9781 7.4886 7.1755
0.1846 0.1761 0.1791
[image:5.595.309.549.64.498.2]Fig. 4 Best compromise solution using SPEA Table 3 shows the results of best compromising solution for IEEE30 bus system using NSGA II while figure 5 represents optimized results.
Table III :- Best compromise solution using NSGA-II Control
Variable
Best Best Best
compromise
1.0455 1.0599 1.0593
1.0575 1.0453 1.0493
1.0274 1.0128 1.0201
1.0552 1.0118 1.0444
1.0548 1.0461 1.0511
1.0549 1.0546 1.0591
0.9379 1.0155 0.9787
0.9963 1.0053 1.0082
0.9218 1.0386 0.9830
0.9318 0.9697 0.9265
(MW) 7.4659 8.1968 7.6211
0.1945 0.1771 0.1827
Fig. 5:- Best compromise solution using NSGAII B.Optimize the objective function using SPEA and NSGA-II
method
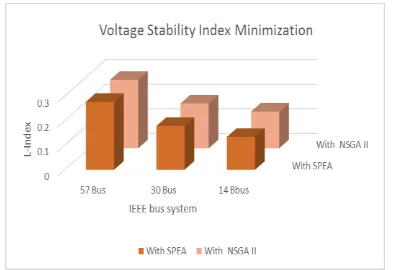
Fig 6 shows power loss comparison for all three bus system for both SPEA and NSGA II techniques. Fig.7 represents values of voltage stability index (Lindex) for IEEE 14,30 & 57 bus system with SPEA and NSGA II technique.
[image:5.595.54.284.147.574.2] [image:5.595.309.548.593.716.2]Fig. 7 Comparison of L-index using SPEA and NSGA-II Voltage profile of control variables
[image:6.595.63.277.263.385.2]Fig. 8 , Fig.9 and Fig 10 show voltage profile results before and after optimization using SPEA & NSGA II for IEEE 14 bus system , IEEE 30 bus system and IEEE 57 bus system respectively.
Fig.8 :-Voltage profile after and before using of SPEA and NSGA II method
Fig.9 Voltage profile using SPEA and NSGA-II method For 30 bus system
Fig. 10 Voltage profile using SPEA and NSGA-II method For 57 bus system
VI. CONCLUSION
This paper carried out the Reactive Power Dispatch problem solved by two main objective functions and it is carried out by two different techniques. MATLAB program is developed and optimized the real power loss and voltage stability index using Strength Pareto Evolutionary Algorithm (SPEA) and Non-Dominated Sorting Genetic Algorithm-II (NSGA-II). Results have been compared for IEEE 14,30 and 57 bus system. Result shows that SPEA is better for solving the Reactive Power Dispatch problem.
REFERENCES
1. K.R. C. Mamandur and R. D. Chenoweth, "Optimal Control of Reactive Power Flow for Improvements in Voltage profiles and for Real Power Loss Minimization," IEEE Trans. on Power Apparatus and Systems,Vol. PAS-100, No. 7, 1981, pp. 3185-3193.
2. K.Iba, "Reactive Power Optimization by Genetic Algorithm," IEEE Trans. on Power Systems, Vol. 9, No. 2, 1994, pp. 685-692.
3. L. L. Lai and J. T. Ma, " Application of Evolutionary Programming to Reactive Power Planning-Comparison with Nonlinear Programming Approach," IEEE Trans. on Power ystems, Vol. 12, No. 1, 1997, pp. 198-206.
4. Y.T. Hsiao and H. D. Chiang, "Applying Network Window Schema and a Simulated Annealing Technique to Optimal VAR Planning in Large- Scale Power systems," Electric Power Systems Research, 22, 2000, pp. 1-8.
5. D.Gan, Z. Qu, and H. Cai, "Large-Scale VAR Optimization and Planning by Tabu Search," Electric Power Systems Research,39,1996,pp.195-204.
6. Saied Salamat Sharif, “Optimal Reactive Power Flow Problem”, Msc Iran University of Science and Technology, Sept.1987.
7. Chao-Rong Chen, Hang-Sheng Lee, Wenta Tsai “Optimal Reactive Power Planning Using Genetic Algorithm”, in proceedings of the Systems, Man and Cybernetics, IEEE International Conference, vol. 6, pp. 5275-5279, Oct. 2006.
8. A.A. Abou Ela, M.A. Abido, S.R. Spea “Differential evolution algorithm for optimal reactive power dispatch”, International Journal of Electric Power Systems Research, vol. 30, pp. 435-441, Oct. 2008. 9. Congyu Zhang, Minyou Chen and Ciyong Luo “A Multi-objective
Optimization Method for Power System Reactive Power Dispatch”, in proceedings of the Intelligent Control and Automation (WCICA), 28th World Congress, pp. 6-10, July2010.
10. M. Varadarajan, K.S. Swarup “Differential evolutionary algorithm for optimal reactive power dispatch”, International Journal of Electrical Power and Energy Systems, vol. 30, pp. 435–441, Oct. 2008. 11. P.Subbaraj, P.N. Rajnarayanan “Optimal reactive power dispatch using
self-adaptive real coded genetic algorithm”, International Journal of Electric Power Systems Research , vol. 79, pp. 374–381, February 2009. 12. Zita A. Vale, Carlos Ramos,
[image:6.595.64.274.420.609.2]International Journal of Innovative Technology and Exploring Engineering (IJITEE) ISSN: 2278-3075,Volume-8 Issue-12, October 2019
Author-1 P hoto
Khodr “ Reactive power compensation by EPSO technique.” System Man and Cybernetics (SMC), 2010 IEEE international Conference,pp. 1512-1518
13. W.N.W Abdullah, H. Saibon A.A.M Zain, K.L. Lo “Genetic Algorithm for Optimal Reactive Power Dispatch”, in proceedings of the Energy Management and Power Delivery, International Conference, vol. 1, pp. 160-164, march 1998.
14. Chao-Rong Chen, Ching-Yin Lee, Yen-Fung Hsu, Hai-Wen Chao “Optimal Reactive Power Dispatch of Power Systems Using a Modified Genetic Algorithm”, in proceedings of the Power System Technology, International Conference , vol. 2, pp. 1266-1269, Nov 2004
15. D.Devaraja, J. Preetha Roselyn “Genetic algorithm based reactive power dispatch for voltage stability improvement”, International Journal of Electrical Power and Energy Systems, vol. 32, pp. 1151–1156, Dec 2010
16. P.Aruna Jeyanthy and Dr. D. Devaraj “Optimal Reactive Power Dispatch for Voltage Stability Enhancement Using Real Coded Genetic Algorithm”, International Journal of Computer and Electrical Engineering, vol. 2, pp. 1793-8163, August, 2010.
17. R.Suresh and N. Kumarappan “ Genetic Algorithm based Reactive power Optimization under Deregulation” International Conference on Information and communication technology in Electrical Science 2007, pp.150-155
18. M.A.Abido “multi objective optimal reactive power (VAR) dispatch problem using strength pareto evolutionary algorithm” Evolutionary Computation. CEC. IEEE Congress on 2006, pp. 730-736
19. M.A.Abido “Multi objective optimal power flow using Strength Pareto Evolutionary Algorithm.” Universities Power Engineering Conference 2004
AUTHORSPROFILE
Vishnu Patel was born on July 20,1977 in Upera,India.He received his B.E. degree from
Government Engineering College, Modasa and M.E. from L.D. Engineering College in 2009.He is currently working as assistant professor in U.V .Patel College of Engineering, Ganpat University, Kherwa, Gujarat. He has 17 years experience and his research area include Power system voltage stability enhancement, reactive power dispatch, and optimization problem solutions using genetic algorithm and different evolutionary techniques. which contains their education details, their publications, research work, membership, achievements, with photo that will be maximum 200-400 words.