This is a repository copy of Mapping rail wear transitions.
White Rose Research Online URL for this paper:
http://eprints.whiterose.ac.uk/879/
Book Section:
Lewis, R. and Olofsson, U. (2003) Mapping rail wear transitions. In: Ekberg, A., Kabo, E.
and Ringsberg, J., (eds.) 6th International Conference on Contact Mechanics and Wear of
Rail/Wheel Systems : CM2003. CHARMEC , Gothenburg , pp. 165-174. ISBN
9163139286
[email protected] https://eprints.whiterose.ac.uk/ Reuse
Unless indicated otherwise, fulltext items are protected by copyright with all rights reserved. The copyright exception in section 29 of the Copyright, Designs and Patents Act 1988 allows the making of a single copy solely for the purpose of non-commercial research or private study within the limits of fair dealing. The publisher or other rights-holder may allow further reproduction and re-use of this version - refer to the White Rose Research Online record for this item. Where records identify the publisher as the copyright holder, users can verify any specific terms of use on the publisher’s website.
Takedown
If you consider content in White Rose Research Online to be in breach of UK law, please notify us by
6th International Conference on Contact Mechanics and Wear of Rail/Wheel Systems (CM2003) in Gothenburg, Sweden June 10–13, 2003
MAPPING RAIL WEAR TRANSITIONS
R. Lewis1 and U. Olofsson2
1
The University of Sheffield, Department of Mechanical Engineering,
Mappin Street, Sheffield, S1 3JD, UK
2
Royal Institute of Technology, Department of Machine Design,
SE 100 44 Stockholm, SWEDEN
[email protected], [email protected]
Abstract
This paper outlines work carried out to produce maps of rail material wear coefficients taken from laboratory tests run on twin disc and pin-on-disc machines as well as those derived from measurements taken in the field. Wear transitions are identified using the maps and defined in terms of slip and contact pressure. Wear regimes are related to expected wheel/rail contact conditions and contact points (rail head/wheel tread and rail gauge/wheel flange). Surface and sub-surface morphologies are discussed and comparisons are made between field and laboratory data.
INTRODUCTION
In a wheel/rail contact, both rolling and sliding occur in the contact area. On straight track, the wheel tread is in contact with the rail head, but in curves the wheel flange may be in contact with the gauge corner of the rail. Flanging results in a large sliding motion in the contact. The contact area can be divided into stick (no slip) and slip regions. With increasing tangential load, the slip region increases and the stick region decreases, resulting in a rolling and sliding contact. When the tangential load reaches its saturation value the stick region disappears and the entire contact area is in a state of pure sliding. In curves, especially, there can be a large sliding component on the contact patch at the rail head (gauge corner).
Due to this sliding, wear occurs in the contact under the poorly lubricated condition that is typical of wheel/rail contact. It has been observed during sliding wear that an increase of the severity of loading (normal load, sliding velocity, or bulk temperature) leads at some stage to a sudden change in the wear rate (volume loss per sliding distance). The simplest classification of the types of wear exhibiting these different wear rates is
mild wear and severe wear. Mild wear results in a
smooth surface that often is smoother than the original surface, with minimal plastic deformation and oxide wear debris. Severe wear results in a rough surface that is usually rougher than the original surface, with extensive plastic deformation and flake-like metallic wear debris [1, 2]. Both mild wear and severe wear have
been identified on track during field studies [3]. It was found that mild wear dominated at the rail head, but at the rail edge severe wear was clearly occurring. For pure sliding wear tests, such changes in wear mechanism result in jumps in wear rate when the severity of the contact conditions is increased (for example, by increasing the contact pressure, sliding velocity, or bulk material temperature) for any pair of materials [4]. By plotting wear maps of wear rate against contact pressure and sliding velocity, the various territories associated with different wear mechanisms and the transitions from mild to severe wear can be identified. In sliding wear maps produced by Lim and Ashby [4], up to seven wear regimens were apparent.
A different approach for considering wheel/rail wear data has been used by Bolton and Clayton [5]. This approach involves plotting wear rate in µg mass loss/m rolled/mm2 contact area against Tγ/A, where T is the tractive force (normal force multiplied by coefficient of friction), γ is the slip and A is the contact area. Three wear regimes were identified during twin disc testing of rail materials, mild, severe and catastrophic.
Likely wheel/rail contact conditions at a particular point on a track can be predicted using a number of different numerical techniques such as finite element analysis and multi-body dynamics simulations [6]. Once determined these can be used to identify the appropriate operating conditions for experimental studies of rail material wear. The aim of this work is to draw together available experimental data on rail wear, produce tools in the form of wear maps and relate the wear maps to a likely range of contact conditions for the wheel/rail contact.
RAIL WEAR DATA
A large amount of data relating to rail material wear has been generated during experimental studies carried out over the last two decades (for example see [5, 7, 8, 9,
10]). Data from these studies and more recent
investigations using current wheel and rail materials [3] were used in this work.
The data resulted from tests run on a range of equipment, from pin-on-disc and twin disc machines to full-scale wheel/rail test-rigs. Various material
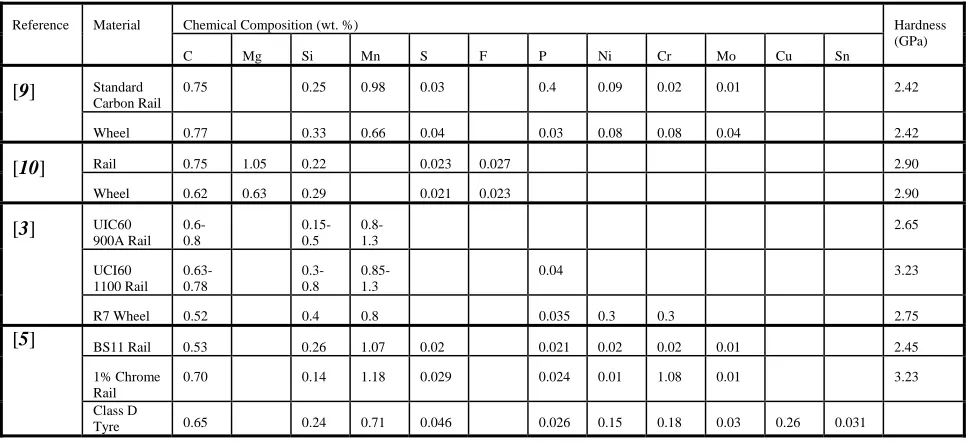
combinations and contact geometries were utilised as well as different test conditions (contact pressure and slip). Presentation of data and completeness of data also varied. Chemical composition and hardness of the rail materials used in the tests, where available, is shown in
table 1.
WEAR TRANSITIONS
In order to present the data in a way that would allow a direct comparison, the approach first adopted by Bolton and Clayton [5] was used. As outlined above, this involves plotting wear rate against Tγ/A. This approach has been used in much of the subsequent work on wheel and rail wear, but when different approaches had been taken, data was converted (if sufficient information about test conditions and specimen geometry was available) to enable it to be plotted using the parameters outlined above.
Three wear regimes have been identified during twin disc testing of rail materials [5]. These were referred to as Type I (mild), Type II (severe) and Type III (catastrophic), as illustrated in figure 1 using data for BS11 rail versus Class D tyre material taken from [5]. Each regime is defined in terms of wear rate, disc contact surface appearance, metallographic features of disc sections and wear debris. As can be seen, at the transition between each regime a distinct change in wear
rate occurs. Mild to severe wear results from contact conditions most likely to occur in the wheel tread/rail head contact and severe to catastrophic wear in the wheel flange/rail gauge corner contact.
Similar trends in wear rate have been seen in subsequent twin disc testing, as shown in figure 2. While it is clear that for each particular material combination the magnitude of wear and the location of the transitions between regimes are different the general trends are similar and the same regimes exist. It is evident from the data presented in figure 2 that wear rates are gradually reducing. The wear rate for UIC60 900A rail steel being up to an order of magnitude lower than that of BS11.
A further wear mode, designated heavy wear, has also been identified within the severe regime [10]. The total wheel and rail wear rate data shown in figure 3 illustrates that this regime, characterised by a peak in the wear rate, exists for varying material combinations. It should be noted, however, that the significance of this peak is determined largely by the range of operating conditions under consideration. Obviously if the range extends into the catastrophic regime then the peak seen in the heavy regime is relatively small.
Work has shown that, within the severe wear regime (where wear rate is proportional to Tγ/A), small-scale twin disc test results can be related to those from full-scale tests [11], as shown in figure 4.
Chemical Composition (wt. %) Reference Material
C Mg Si Mn S F P Ni Cr Mo Cu Sn
Hardness (GPa)
Standard Carbon Rail
0.75 0.25 0.98 0.03 0.4 0.09 0.02 0.01 2.42
[9]
Wheel 0.77 0.33 0.66 0.04 0.03 0.08 0.08 0.04 2.42
Rail 0.75 1.05 0.22 0.023 0.027 2.90
[10]
Wheel 0.62 0.63 0.29 0.021 0.023 2.90
UIC60 900A Rail
0.6-0.8
0.15-0.5
0.8-1.3
2.65
UCI60 1100 Rail
0.63-0.78
0.3-0.8
0.85-1.3
0.04 3.23
[3]
R7 Wheel 0.52 0.4 0.8 0.035 0.3 0.3 2.75
BS11 Rail 0.53 0.26 1.07 0.02 0.021 0.02 0.02 0.01 2.45
1% Chrome Rail
0.70 0.14 1.18 0.029 0.024 0.01 1.08 0.01 3.23
[5]
Class D
[image:3.595.56.539.459.681.2]Tyre 0.65 0.24 0.71 0.046 0.026 0.15 0.18 0.03 0.26 0.031
1 10 100 1000 10000 100000
0 20 40 60 80 100 120
Tγ/A (N/mm2)
W
e
a
r R
a
te
(
g
/m/mm
2 ) Type II, Severe
Type I, Mild
[image:4.595.149.452.96.277.2]Type III, Catastrophic
figure 1 Wear regimes identified during twin disc testing of BS11 rail material versus Class D tyre material [5]
0.01 0.1 1 10 100 1000 10000 100000
0 50 100 150 200
Tγ/A (N/mm2)
W
e
a
r R
a
te
(
g/
m
/m
m
2 )
UIC60 900A vs R8T BS11 vs Class D [5]
[image:4.595.139.462.319.498.2]Standard Carbon Rail [9]
figure 2 Wear rates resulting from twin disc testing for a number of different material combinations
0 20 40 60 80 100
0 30 60 90 120 150
pγ (N/mm2)
W
e
a
r R
a
te
(
g/
m
/m
m
) Standard Carbon Rail [9]
Standard Rail [10] UIC60 900A
[image:4.595.156.440.544.701.2]0 100 200 300 400 500 600
0 5 10 15 20 25 30 35
Tγ/A (N/mm2)
W
e
a
r R
a
te
(
g
/m/
mm
2 )
Full scale flange contact
Small scale Amsler Full scale
tread contact
[image:5.595.137.460.95.307.2]High rail field wear
figure 4 Comparison of rail wear data from small and full-scale laboratory tests and the field [11]
The full-scale results are in good agreement. Both show a linear relationship with a small difference in slope. It was thought that the difference in slope was due to underestimated slip values which would reduce values of the Tγ/A parameter. The spread of contact conditions for each flange contact represents a variation in the friction coefficient. The same applies to the field results where the rail is seeing a random distribution of wheel profiles. It is encouraging that, despite the mentioned deficiencies, the field and full-scale results are of the same order as those for the small-scale tests.
The Tγ/A method of plotting data clearly allows for comparison of twin disc test data with full-scale test and field data, although very limited data is available from the latter.
WEAR COEFFICIENT MAPS
While using the Tγ/A method for plotting wear rate data enables wear transitions to be identified easily and comparisons of different material combinations to be made it does help in fully understanding how the individual contributions of different parameters such as contact pressure and slip affect wear rate.
In order to allow a more complete analysis of the affect of individual parameters a mapping method was required for plotting wear data. It was decided that the most appropriate technique would be that developed by
Lim and Ashby [4] for mapping sliding wear mechanisms.
Wear coefficients were calculated from the rail steel wear data using Archard's equation [12]:
HNs h
K = (1)
where K is the wear coefficient, h is the wear depth, N is
the normal load, s is the sliding distance and H is the
material hardness.
Wear coefficients were then plotted against contact pressure and sliding speed in the contact. Two types of plot were constructed; contour maps and 3D point graphs. Obviously the accuracy of the contour map is limited by the amount of data available. The accompanying 3D graphs give an indication of where data is lacking on a particular map. Transitions based on those outlined above were marked on the contour plots.
Figure 5 illustrates data from twin disc testing
0.00 0.05 0.10 0.15 0.20 400 600 800 1000 1200 CATASTROPHIC S E V E R E -C A T A S T R O P H IC T R A N S IT IO N S E V E R E MILD
Sliding Speed (m/s)
C o nt ac t Pr es s u re ( M P a )
437.5 -- 500.0 375.0 -- 437.5 312.5 -- 375.0 250.0 -- 312.5 187.5 -- 250.0 125.0 -- 187.5 62.50 -- 125.0 0 -- 62.50
1200 1000 800 600 400 0.00 0.05 0.10 0.150.20 0.250.30 0 100 200 300 400 500 W e ar C o ef fi c ien t ( x 1 0 -4 )
Sliding Spe
ed (m /s) Conta
ct Pressure
(MPa)
0.00 0.01 0.02 0.03 0.04 0.05 0.06 0.07 0.08 400 600 800 1000 1200 SEVERE-CATASTROPHIC TRANSITION SEVERE MILD
Sliding Velocity (m/s)
C o n tac t Pr es s u re ( M Pa )
14.00 -- 16.00 12.00 -- 14.00 10.00 -- 12.00 8.000 -- 10.00 6.000 -- 8.000 4.000 -- 6.000 2.000 -- 4.000 0 -- 2.000
1200 1000 800 600 400 0.00 0.02 0.04 0.06 0.08 0 2 4 6 8 10 12 14 16 18 W e a r C o e ffic ie n t (x 1 0 -4 ) Sliding Velo
city ( m/s) Conta
ct Pressure
[image:6.595.77.515.102.413.2](MPa)
figure 5 Wear coefficient maps for BS11 rail material versus Class D tyre material (data from [5])
Figure 6 shows data from twin disc tests run at
FAST using a standard carbon rail (details in [9]). Again the upper plots show the full range of data available, while the lower plots focus on the mild to severe wear regimes where more data is available.
The data for UIC60 900A rail versus R7 wheel material, shown in figure 7, resulted from both twin
disc and disc tests (details in [3]). The pin-on-disc tests were carried out to simulate the higher sliding velocities encountered on tight curves. Such data was only available for this particular material combination. As can be seen a wear regime beyond catastrophic was apparent, where wear rates reduced to levels seen in the severe regime. A similar trend has been seen in ball bearing steels [4].
It is interesting to note that at low sliding velocities, the levels of the wear coefficients from the pin-on-disc tests and the two-roller tests are similar. The results show that the wear coefficient depends on the sliding velocity. The same tendency can be seen in the full-scale tests performed at Älvsjö test track [3]. The wear rate is higher at the rail edge (high sliding velocity) compared with wear rate at the rail head (low sliding velocity).
Wear magnitudes for UIC60 900A rail material versus R8T wheel material (shown in figure 8) were
0.00 0.02 0.04 0.06 0.08 0.10 0.12 0.14 0.16 500 600 700 800 900 1000 1100 1200 1300 S E V E R E - C A T A S T R O P H IC T R A N S IT IO N SEVERE MILD CATASTROPHIC
Sliding Speed (m/s)
C o nt ac t P res s ur e ( M P a)
393.8 -- 450.0 337.5 -- 393.8 281.3 -- 337.5 225.0 -- 281.3 168.8 -- 225.0 112.5 -- 168.8 56.25 -- 112.5 0 -- 56.25
1200 1000 800 600 400 0.00 0.04 0.08 0.12 0.16 0 100 200 300 400 W e a r C o e ffic ie n t (x 1 0 -4 ) Sliding Velo
city ( m/s) Conta
ct Pressure
(MPa)
0.00 0.01 0.02 0.03 0.04 0.05 0.06 0.07 0.08 600 700 800 900 1000 1100 1200 1300 SEVERE - CATASTROPHIC TRANSITION SEVERE MILD
Sliding Speed (m/s)
C o nt ac t P res s u re ( M Pa)
11.38 -- 13.00 9.750 -- 11.38 8.125 -- 9.750 6.500 -- 8.125 4.875 -- 6.500 3.250 -- 4.875 1.625 -- 3.250 0 -- 1.625
1200 1000 800 600 0.00 0.02 0.04 0.06 0.08 0 2 4 6 8 10 12 14 W e a r Co e ffi c ie n t (x 1 0 -4 ) Sliding Spe
ed (m /s) Conta
ct Pressure
(MPa)
figure 6 Wear coefficient maps for standard carbon rail material and an unspecified wheel material (data from [9])
DISCUSSION
The aim of the work described was to produce tools in the form of maps of rail material wear data for identifying and displaying wear regimes and transitions. For this purpose wear data was collected from small-scale and full-scale laboratory tests as well as measurements taken in the field.
Data for a range of wheel/rail material
combinations has been presented using two methods; wear rate versus Tγ/A plots and wear maps showing
wear rates versus contact pressure and sliding speed. These have highlighted that a number of rail steel wear regimes and transitions exist. The maps allow these to be analysed in terms of different contact parameters.
The Tγ/A plots have revealed that trends in wear
rate as the severity of the wheel/rail contact varies are
similar for a range of rail steels. They have also shown that over the last two decades wear rail steel wear rates have reduced by up to an order of magnitude. This in theory sounds positive, although it has been shown that decreasing wear may adversely affect crack growth in rails (wear would normally act to truncate cracks) leading to greater incidence of fatigue failures [13, 14].
0.0 0.1 0.2 0.3 0.4 0.5 0.6 0.7 0.8 0.9 700 800 900 1000 1100 1200 1300 1400 SEVERE MILD S EV E RE - C AT AS
T
RO PH IC T RA NS ITIO
N
CATASTROPHIC
Sliding Velocity (m/s)
C ont ac t P res s ur e (M P a)
30.63 -- 35.00 26.25 -- 30.63 21.88 -- 26.25 17.50 -- 21.88 13.13 -- 17.50 8.750 -- 13.13 4.375 -- 8.750 0 -- 4.375
1400 1200 1000 800 600 0.0 0.2 0.4 0.6 0.81.0 0 5 10 15 20 25 30 35 40 W ear C oef fi c ient ( x 10 -4 ) Slidin g Velo
city ( m/s) Conta
ct Pre
ssure (MP
a)
0.01 0.02 0.03 0.04 0.05 0.06 700 800 900 1000 1100 1200 1300 1400 SE VE RE -CA TA ST RO PH IC TR AN SIT ION SEVERE MILD
Sliding Speed (m/s)
C o nt a c t P res s u re ( M Pa)
[image:8.595.81.511.100.411.2]14.00 -- 16.00 12.00 -- 14.00 10.00 -- 12.00 8.000 -- 10.00 6.000 -- 8.000 4.000 -- 6.000 2.000 -- 4.000 0 -- 2.000
figure 7 Wear coefficient maps for UIC60 900A rail material versus R7 wheel material (data from [3])
1800 1600 1400 1200 1000 800 0.00 0.05 0.10 0.15 0.20 0 10 20 30 40 50
Wea
r C
o
ef
fi
c
ien
t (
x
1
0
-4)
Sl
idi
ng
S
pe
ed
(m
/s)
Conta
ct Pre
ssure
(MP
a)
[image:8.595.161.435.472.716.2]Relating expected pressure and slip in the wheel/rail contact at certain points on a track route, particularly low radius curves, to the amount of wear likely to occur under such conditions, is very important. It can help in determining:
• more efficient maintenance schedules on
particular routes
• where different track profiles may be needed to reduce the severity of the wheel/rail contact • where application of lubrication may be
necessary to reduce wear problems
• improving data input to simulation techniques used to predict rail profile change
The data used in constructing the wear maps, however, is somewhat limited, which restricts their usefulness. The maps really represent a starting point and while initially they may only be useful in focussing areas in which to carry out further testing will
nonetheless be very useful. It has been noted that the challenge is to extend maps such as these from the basis of empirical observation to that of theory calibrated against experiment [4].
It is clear, from studying the literature, that while rail steel wear regimes have been defined well in terms of wear rate, metallographic features and wear debris, it is not understood what mechanisms are leading to the changes in wear rate that occur. Recent work on wear of railway wheel steel [15] is beginning to address this issue, but again further work is required in this area.
Also, in previous work on wear of rail steel no attempt has been made to correlate wear data to wheel/rail contact conditions. The wheel/rail contact conditions illustrated in figure 9 resulted from a study
using GENSYS train dynamic modelling software [6]. As can be seen a clear difference exists between the rail head/wheel tread and the rail gauge/wheel flange contacts. The two points highlighted show results from Medyna simulations of the Älsvjö test track [16] for the first and second wheelsets, which provide a measure of corroboration.
To study how the wear regimes identified above fit in with the wheel/rail contact conditions shown in
figure 9 the wear map of UIC60 900A rail steel versus
R7 wheel steel has been overlaid, as shown in figure 10.
This indicates that the rail head/wheel tread contact will experience mild to severe wear and the rail gauge/wheel flange contact will experience severe to catastrophic wear. This backs up previous suppositions regarding the wear regimes that the rail head/wheel tread and rail gauge/wheel flange contacts fall into.
Surface topography measurements at the Älvsjö test track [3] identified mild wear as the dominating mechanism at the rail head, but at the rail edge a more severe or catastrophic wear was occurring. For the pin-on-disc tests, a change in surface appearance was also noted. For the tests at low sliding velocity a smooth surface was observed, but at higher sliding speeds, the surface had a rougher appearance similar to that found at the rail edge for the full-scale tests.
0.0 0.2 0.4 0.6 0.8 1.0
0 500 1000 1500 2000 2500
Second Wheel, High Rail First Wheel, High Rail Rail Head/Wheel Tread
Rail Gauge/Wheel Flange
C
o
nt
ac
t P
res
s
u
re
(
M
P
a
)
[image:9.595.113.480.472.713.2]Sliding velocity (m/s)
Also the ranking of the wear rate agrees reasonably well between full-scale test and laboratory tests. In the full-scale tests the wear measured at the rail edge was six times higher than that at the rail head. In the pin-on-disc and twin disc tests the wear rate in the mild/severe regime was four times higher than that in the catastrophic regime.
Figure 11 shows the wear data points collected for
various rail materials in terms of the contact
conditions. It can be seen that there is a large amount of wear test data for conditions typical of a rail head/wheel tread contact, but very little for the rail gauge/wheel flange contact.
0.0 0.2 0.4 0.6 0.8 1.0
0 500 1000 1500 2000 2500
UIC60 900A vs R7 Wear Map
Severe Mild
Severe - Catastrophic Transition
Catastrophic
Rail Head/Wheel Tread
Rail Gauge/Wheel Flange
C
o
nt
ac
t P
res
s
u
re
(
M
P
a
)
Sliding Velocity (m/s)
figure 10 UIC60 900A rail steel wear map plotted over wheel/rail contact conditions derived from GENSYS simulations [6]
0.0 0.2 0.4 0.6 0.8 1.0
0 500 1000 1500 2000 2500
Rail Head/Wheel Tread Rail Gauge/Wheel Flange
BS11 vs CID 900A vs R7 FAST data 900A vs R8T Cr1% vs CID
Contact P
ressure (M
P
a
)
Sliding Velocity (m/s)
[image:10.595.116.481.484.728.2]This clearly identifies an area that needs to be addressed in future research. Especially as axle loads are increasing and rolling stock is being used on track with low radius curves as well as the high radius curves on high speed lines, which means it is likely that the severity of the wheel/rail contact conditions will rise.
Increasing the wear data available will also improve the accuracy and applicability of the wear maps.
CONCLUSIONS
• In this paper available experimental data on rail wear have been collected and presented in form of wear maps. Up to five wear regimes and
transitions have been identified.
• Rail steel wear rates have reduced by up to an order of magnitude for the severe wear regime in the last 20 years. For the mild wear regime it is hard to detect any change for the wheel/rail material combinations studied.
• By combining the wear maps with multi-body
simulations the likely wear rates and wear regimes for rail head/wheel tread and rail gauge/wheel flange contacts can be predicted.
• Gaps have been identified in current knowledge
both in terms of rail steel wear data and wear mechanisms that provide a focus for new research in this area.
Acknowledgments
The authors would like to acknowledge the Royal Academy of Engineering for the provision of an International Travel Grant allowing Dr Lewis to visit KTH and collaborate with Dr Olofsson on this work.
References
1. WILLIAMS JA, Wear modelling: analytical, computing and mapping: a continuum mechanics approach, Wear, 1999, vol 225–229, pp 1–17, 1999
2. ARCHARD JF&HIRST W, Wear of metals under
unlubricated conditions, Proceedings of The Royal Society, London, Part A, vol 236, pp 3–55, 1956
3. OLOFSSON U.&TELLISKIVI T, Wear, friction and
plastic deformation of two rail steels - full scale test and laboratory study, Wear, vol 254, pp
80-93, 2003
4. LIM,SC&ASHBY MF, Wear mechanism maps,
Acta Metallica, vol 35, pp 1-24, 1987
5. BOLTON PJ&CLAYTON P, Rolling-siding wear
damage in rail and tyre steels, Wear, vol 93, pp
145-165, 1984
6. JENDEL,T, Prediction of wheel profile wear –
methodology and verification, Licentiate Thesis,
TRITA-FKT 2000:9, Royal Institute of Technology, Stockholm, Sweden, 2000
7. CLAYTON P, Tribological aspects of wheel-rail
contact: a review of recent experimental results, Wear, vol 191, pp 170-183, 1996
8. KRAUSE H&POLL G, Wear of wheel-rail surfaces,
Wear vol 113, pp 103-22, 1986
9. DANKS D&CLAYTON P, Comparison of the wear
process for eutectoid rail steels: field and laboratory tests, Wear, vol 120, pp 233-250, 1987
10.ZAKHAROV S,KOMAROVSKY I&ZHAROV I, Wheel
flange/rail head wear simulation, Wear, vol 215,
pp 18-24, 1998
11.MCEWEN IJ&HARVEY RF, Full-scale
wheel-on-rail wear testing: comparisons with service wear and a developing theoretical predictive method, Lubrication Engineering, vol 41, No 2, pp 80-88,
1985
12.ARCHARD JF, Contact and rubbing of flat
surfaces, Journal of Applied Physics, vol 24, pp
981-988, 1953
13.OLOFSSON U&NILSSON R, Surface cracks and
wear of rail: a full-scale test and laboratory study, Proceedings of the IMechE Part F: Journal of Rail and Rapid Transit, vol 216, pp 249-264,
2002
14.KAPOOR A.,FLETCHER DI&FRANKLIN FJ, The
role of wear in enhancing rail life, in press, Proceedings of the 29th Leeds-Lyon Symposium on Tribology, Leeds, 3-6 September, 2002
15.LEWIS R,DWYER-JOYCE RS&KAPOOR A, Wear
mechanisms in railway wheel steels, in press, 2003
16.KNOTHE K,THEILER A&GUNEY S, Investigation of
contact stresses on the wheel/rail-system at steady state curving, Proceedings of the 16th IAVSD
![figure 1 Wear regimes identified during twin disc testing of BS11 rail material versus Class D tyre material [5]](https://thumb-us.123doks.com/thumbv2/123dok_us/8092286.231766/4.595.156.440.544.701/figure-regimes-identified-testing-material-versus-class-material.webp)
![figure 4 Comparison of rail wear data from small and full-scale laboratory tests and the field [11]](https://thumb-us.123doks.com/thumbv2/123dok_us/8092286.231766/5.595.137.460.95.307/figure-comparison-rail-small-scale-laboratory-tests-field.webp)
![figure 5 Wear coefficient maps for BS11 rail material versus Class D tyre material (data from [5])](https://thumb-us.123doks.com/thumbv2/123dok_us/8092286.231766/6.595.77.515.102.413/figure-wear-coefficient-maps-material-versus-class-material.webp)
![figure 7 Wear coefficient maps for UIC60 900A rail material versus R7 wheel material (data from [3])](https://thumb-us.123doks.com/thumbv2/123dok_us/8092286.231766/8.595.161.435.472.716/figure-wear-coefficient-maps-material-versus-wheel-material.webp)
![figure 9 Wheel/rail contact conditions on the Stockholm local railway network derived from GENSYS simulations [6] (also shown are results from Medyna simulations of the Älsvjö test track [16] for the first and second wheelsets)](https://thumb-us.123doks.com/thumbv2/123dok_us/8092286.231766/9.595.113.480.472.713/contact-conditions-stockholm-simulations-medyna-simulations-alsvjo-wheelsets.webp)

