Abstract— Performance of storage system has great impact on overall performance of I/O intensive systems. Data distribution across storage devices affects storage performance directly. Data migration can degrade system performance. This paper focuses on data placement issue in heterogeneous tiers of storage devices storing YouTube videos. In addition to storage capability and current workload, our data placement algorithm also takes into account future workload. Future workload is estimated from video’s characteristics. Workload in all storage tiers is dynamically adjusted to achieve balance at all times. Four data placement algorithms were used to distribute 16,314 videos across 3-tier storage system in the experiment. The proposed algorithm resulted in a more balance workload distribution compared to round robin and random algorithms.
Index Terms— data placement, heterogeneous storage system, YouTube, short videos
I. INTRODUCTION
System performance, reliability and availability depend on those of storage system. Storage issues have been studied and solutions to various areas of storage system have been proposed. Solutions related to storage device and its organization include RAID, Network Attached Storage (NAS), Storage Area Network (SAN) and Object-Based Storage (OBS) [7].
Storage system in an organization expands. As it grows, the organization demands more storage space and faster storage response. Organization purchases new storage system while the old storage system is still in function. It is normal to find many generations of storage devices, each may come from different vendors, in a certain organization. Those devices can have different capacity and capability. They can be arranged into a number of storage tiers according to their performance. Workload distribution in heterogeneous storage environment has become a new challenge, especially in an I/O intensive system. SCADDAR (SCAling Disks for Data Arranged Randomly) focuses on scalable storage architectures where disks are added to or removed from storage system. It minimizes data re-distribution after disk scaling by using Remap functions to determine location of media blocks from their original locations [10]. CRUSH function proposed in [11] facilitates a decentralized scalable data distribution in large-scale distributed object-based storage system.
1 W. Jaiphakdee is in Computer Engineering Program, Faculty of Engineering, King Mongkut's Institute of Technology, Ladkrabang, Bangkok, Thailand (e-mail: [email protected]).
2 C. Srinilta is with the School of Computer Engineering and Information Science, Faculty of Engineering, King Mongkut’s Institute of Technology Ladkrabang, Bangkok, Thailand (phone: +66-2-739-2400 ext 127; e-mail: [email protected]).
There are many video sharing websites available at present. Among those, YouTube [1] stands out as the fast growing site in terms of number of video titles, uploaders and viewers. Everyday, a large number of short made-by-consumer videos are published and viewed. To achieve the best service performance, storage and retrieval of short videos should not be handled the same way as that of commercial two-hour videos. This is simply because they are published and viewed in different manner.
This paper mainly addresses data placement issue in a short video sharing system having heterogeneous tiers of storage devices. A data placement algorithm that is aware of storage diversity and video characteristics is proposed. The goal is to give just right amount of workload to each storage tier in order to keep data migration at the minimum, if not none.
The paper is organized as follows. Section II describes background related to data placement and YouTube video sharing system. Section III explains characteristics of YouTube videos and the proposed data placement algorithm. Section IV discusses experiment and results. Finally, section V concludes the paper.
II. BACKGROUND AND RELATED WORK A. Data placement
Data placement is fundamental to storage workload distribution because when data is requested, workload goes to the device where the data is stored. If data is distributed well, storage workload is automatically balanced. LH-based algorithms used hashing mechanism in its data distribution [2]. A pseudo random number generated by a hash function was expected to result in a uniform distribution. Data placement was determined only by using the hash function. The algorithm did not pay attention to workload characteristics. Lee et. al. aimed to minimize response time. They proposed an online assignmentalgorithm for real-time environment where file access rate was known in advance [3]. Scheuermann et. al. got around the data distribution problem with a dynamic method that tracked the change of load [4]. The method focused on balancing the heat (access rate) of disks using temperature (ratio between heat and block size) as a criterion.
Some research groups considered blocking probability when distributing data. Feng et. al. proposed an adaptive object placement algorithm that minimized blocking probability [5]. They also presented a method to track parameters of workload. Tang et. al. introduced a static genetic algorithm and a heuristic bin-packing algorithm for offline data placement in video-on-demand system [8], [9].
Dynamic Load Balancing of Short Videos in
Heterogeneous Storage Environment
B. YouTube
Founded in early 2005, YouTube has been continuously gaining acceptance worldwide. YouTube is also considered as one of the fastest-growing websites today. As of January 31, 2010, YouTube ranks third in web traffic among all websites in the internet by Alexa’s traffic rank [12]. YouTube provides video sharing service of short videos (duration less than 10 minutes). At YouTube, registered users can upload and share short videos that they created. YouTube provides subscription facility to registered users. Subscribers will be notified when the user they subscribe to publishes new video. YouTube currently categorizes videos into 15 categories. Uploaders choose category for their videos. Each video is associated with tags describing the content of the video. Tags are given by video uploader at the time the video is uploaded. YouTube provides video search service. YouTube suggests other videos that may interest the viewer. YouTube collects viewing statistics; for example, number of views of each video. Certain information about a video can be queried using YouTube API.
Cheng et. al. carried out a systematic in-depth measurement study YouTube videos statistics [6]. They observed access pattern, growth trend, length and active life span of YouTube videos. They found that YouTube videos were significantly different from traditional streaming videos in every aspect that they observed.
III. OUR APPROACH A. YouTube datasets
Each YouTube video has a metadata providing video’s descriptive and statistical information; e.g., ID, category, title, uploader, length and cumulative number of views. Table I explains metadata of YouTube video in greater detail [13]. Metadata of a certain YouTube video can be obtained via YouTube API.
TABLEI
DESCRIPTIONOFYOUTUBE VIDEOMETADATA
Field Description
Video ID A unique id which is 11 digit composing 0-9, a-z, A-Z, - and _
Title Short text describing a video
Description Text including information about the content of the video
Uploader Name of the registered user who uploads video
Category
Category of a video. Selected by user when upload. 12 categories available defined by YouTube (2007): Autos & Vehicles, Comedy, Entertainment, Film & Animation, Gadgets & Games, Howto & Style, Music, News & Politics, People & Blogs, Pets & Animals, Sports and Travel & Events
Published date Date when uploader uploads and publishes video
Video length Video duration in seconds
Number of views Cumulative number of views of the video
Rating Average number of stars given by viewers (5 being the highest/best rating, 1 being the worst) Number of
comments Number of comments that a video is given Related videos List of videos that are related to the video
YouTube datasets used in our experiments were obtained from http://netsg.cs.sfu.ca/youtubedata/ [6]. There are two datasets collected from YouTube between February and May 2007. Details of each dataset are given in the next two paragraphs.
Dataset A Data in dataset A was collected during an 85-day period from February 22 to May 18, 2007. There were 130,000 unique video titles in this dataset. Number of views of each video was recorded almost everyday. Crawler was used in data collection process. The crawler started crawling from video titles in “Recent Featured”, “Most Viewed”, “Top Rated” and “Most Discussed” lists on YouTube website, followed by their “related videos” down to the depth of four. Dataset B Data in dataset B was number of views of 16,314 unique video titles. Number of views was collected every week for six weeks starting from March 5 to April 16, 2007.
[image:2.595.306.549.264.423.2]
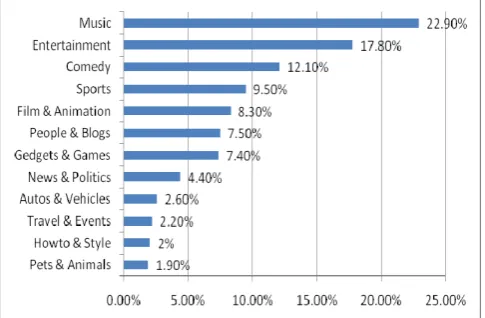
Fig. 1 Video distribution by category (Dataset A)
YouTube videos were categorized into 12 categories in 2007. Distribution of videos in Dataset A is illustrated in Figure 1. “Music” was the largest category. 22.90% of videos fell into “Music” category. “Pet & Animal” was the smallest category. Only 1.90% of the videos were in “Pet & Animal” category. The difference in terms of number of video titles of these two categories was more than 10 times.
B. Number of views
TABLEII
NUMBER OF VIEWS BY CATEGORY (DATASET A)
Category Number of views
MAX MIN AVERAGE
MEDIA N
Autos & Vehicles 176.05 115.50 131.19 124.15
Comedy 751.21 89.06 199.96 103.80
Entertainment 772.77 74.57 197.70 97.75
Film & Animation 201.71 114.51 132.35 123.28
Gadgets & Games 566.42 66.65 148.35 70.10
Howto & Style 214.07 82.87 126.22 121.40
Music 448.82 109.94 175.31 126.94
News & Politics 672.31 47.96 155.07 61.98
People & Blogs 1,778.77 34.14 308.57 60.49
Pets & Animals 247.42 16.50 54.89 20.58
Sports 1,445.84 84.66 310.41 117.55
We looked into the change of number of views of videos in dataset A and found that number of views of videos in same category varied in similar manner. In addition, videos were viewed most often in the first few days after they were published.
Table II shows statistical information describing number of views of videos in each category. The maximum number of views (2nd column in Table II) is used in our data placement process.
Videos in Dataset B were published during April 5-11, 2007. Number of videos published each day is shown in Table III. New videos arriving each day during the period was in the order of 2,000.
TABLEIII
NUMBER OF VIDEOS PUBLISHED AT CERTAIN DATE (DATASET B)
Date Number of Videos Published
Total Number of Videos Published (since April 5, 2007)
April 5, 2007 2,503 2,503
April 6, 2007 2,543 5,046
April 7, 2007 2,541 7,587
April 8, 2007 2,356 9,943
April 9, 2007 2,323 12,266
April 10, 2007 2,190 14,456
April 11, 2007 1,858 16,314
Each day, we make notes of 100 videos that are viewed the most. These videos are called “daily top-100” videos.
C. Number of subscribers
Everyone can view videos from YouTube, but only registered users can upload video to YouTube. Once a user is registered, he/she becomes a member of YouTube. YouTube offers member subscription facility. If member A enjoys watching many videos published by member B, member A may subscribe to member B. When member B publishes a new video, all members subscribed to member B will be notified. Videos published by a member with large group of subscribers have tendency to be viewed often. Therefore, number of subscribers can be a good indicator of the popularity of video.
D. Balancing workload
Balancing storage workload in heterogeneous storage environment is a complicated task because storage devices differ not only in capacity but also capability. Workload distribution considering only number of requests (views) such as round robin is not good enough.
As discussed earlier that storage devices in heterogeneous environment can be grouped into tiers by their capability, workload should be kept balanced across these tiers. By the term “balance”, we focused on the ratio between number of requests (views) and storage capability. In simple words, a fast device should handle more requests than a slow device. The goal is to have each device works at its most comfortable level.
Suppose a storage system consists of N storage tiers. Each storage tier is assigned a capability factor. Capability factor is a number between zero and one. It reflects capability of a storage tier with respect to that of other tiers. The higher the
value of the capability factor, the higher the performance of the tier. The best performance tier is given a capability factor of value 1.
Actual workload of the kth storage tier (
k
a
L
) is the product of the capability factor of the tier (c
k) and the load given tothat tier (
k
a
l
), as shown in equation (1).k k k a
a
c
l
L
=
×
(1)Let perfect situation be a situation where workload is uniformly distributed according to storage capability at all times. Let the kth storage tier handle the perfect load of
k
p
l
units. The perfect workload of the kth storage tier (k
p
L
) can be calculated from equation (2).
k k k p
p
c
l
L
=
×
(2)In perfect case, workload of all storage tiers is always kept equal. As a result, equation (3) is maintained at all times.
N
p N p
p
c
l
c
l
l
c
×
=
×
=
...
=
×
2
1 2
1 (3)
The perfect total load (
total
p
l
) is a summation of perfect load (l
p) assigned to each storage tier, as shown in equation(4).
N total p p p
p
l
l
l
l
=
+
+
...
+
2
1 (4)
However, things may not go as perfectly as expected in actual situation. One storage tier may handle more than its perfect load while other storage tier carries less than its perfect load.
k
d
in equation (5) represents the difference between the actual load (k
a
l
) and the perfect load (k
p
l
) of the kth storage tier.k k p
a
k
l
l
d
=
−
(5)The closer
k
a
l
is tok
p
l
, for all tiers in the storage system, the better the overall workload distribution. Our goal is to achieve the smallestd
k for all k’s.E. Placing videos
When a new video is uploaded to the system, it must be placed in one of the storage tiers. Before choosing storage tier, our placement algorithm tries placing the new video in all tiers, one by one. The load estimate of the new video is added to the current actual load of a storage tier (
k
a
l
) as if the tier is chosen to store the video. Then perfect load of all storage tiers (1
p
l
, 2p
l
, … ,k
p
l
) are determined by equations (3) and (4). After that, the difference between actual and perfect load of all tiers (d
1,d
2, … ,d
k) are determined by equation (5). The overalld
k is recorded. When the process finishes with all storage tiers, the overalld
k’s recorded earlier are compared and the tier that gives maximum overallk
d
is chosen to store the new video.device must handle. Hence, the load contribution of a certain video at any given point in time is proportional to the number of views of that video at that time. If a storage device handles more than one video, the total load on that storage device is the load kicked in by each video combined.
Maximum number of views (Table II) is used as load estimate of a new video. The reason for this is that it is the heaviest load in the entire lifetime span of the video. If a storage tier can sustain the load at this level, it should work comfortably throughout the lifetime span of this video.
Number of subscribers is another promising candidate of the “load” as it was found that actual load was proportional to number of subscribers. Videos published by a member with many subscribers tend to be viewed more often than videos published by non popular member.
IV. EXPERIMENT AND RESULT
Objective : The objective of the experiment was to compare the proposed data placement algorithm against traditional data placement algorithms in terms of ability to balance workload in heterogeneous storage of short videos.
Environment
Storage : Capacity was assumed to be unlimited. There were three storage tiers. The first tier was the fastest. The third tier was the slowest. Capability factors of 1, 0.75 and 0.5 were assigned to the first, the second and the third tiers, respectively.
Dataset : All video titles in Dataset B (Section III A) were used in the experiment. There were 16,314 unique video titles published during April 5-11, 2007. Daily number of views of each video was interpolated from its weekly information.
Data placement algorithms : Four data placement algorithms were experimented. Such algorithms were round-robin algorithm, random algorithm and our algorithm. However, there were two variations in our algorithm. One used maximum number of views as load estimate and the other used number of subscribers as load estimate. In round-robin algorithm, videos were placed in storage tiers in round-robin fashion. Storage tiers took turn storing new videos. In random algorithm, one storage tier was randomly picked to store new video. In our algorithm, storage tier was chosen according to the process described in Section III E. Storage capability was taken into account in workload distribution.
Metrics : 1) Degree of balance (
db
) was used to indicated how well workload was distributed across all storage tiers. Degree of balance was calculated from equation (6).⎟
⎟
⎠
⎞
⎜
⎜
⎝
⎛
−
=
n
p N
p
p
l
d
l
d
l
d
db
1
max
,
,...,
2 1
2 1
(6) It considered the difference between actual and perfect load (
d
) of all storage tiers. The tier with maximum value of the ratio ofd
andl
pwas the representative of the system as it was the tier where the load was off-balanced the most.Degree of balance equals to 1 means that workload was distributed uniformly across storage tiers. The closer the degree of balance is to 1, the better the distribution.
2) Number of video titles stored in each storage tier.
3) Number of daily top-100 videos stored in each storage tier.
Experiment : Videos were uploaded into the system one after another in the order of their actual published dates at YouTube. Data placement algorithm chose one storage tier to store a video at the time the video was published. Four simulations were performed against the same dataset. Each simulation used one data placement algorithm.
Load on each storage tier was collected everyday. Degrees of balance were also calculated daily.
Number of video titles assigned to each storage tier was recorded daily at the end of the day.
[image:4.595.308.548.251.385.2]Result : Degrees of balance from four simulations are shown in Figure 2.
Fig. 2 Degrees of Balance from four simulations
As shown in Figure 2, degrees of balance from our algorithm were the closest to 1 throughout the entire experimental period. This means that our algorithm distributed videos across storage tiers better than the other two data placement algorithm. Round-robin algorithm distributed videos slightly better than random algorithm. Lastly, degrees of balance did not vary much each day.
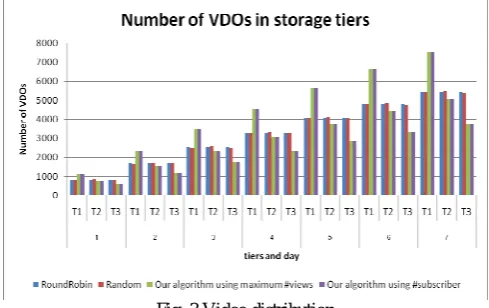
Fig. 3 Video distribution
Figure 3 shows daily video distribution in terms of number of videos stored in each storage tiers. The first tier carried more videos than the other two tiers everyday when our algorithm was used. On the other hand, all tiers carried almost same number of videos in both round-robin and random algorithms.
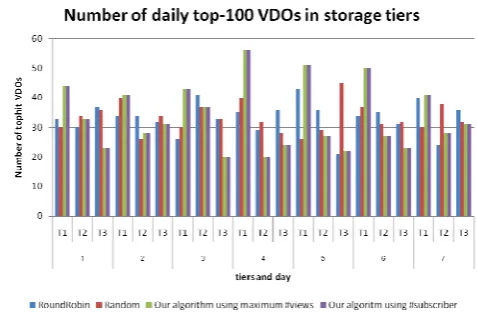
[image:4.595.304.549.509.663.2]Fig. 4 Number of daily top-100 videos stored in each storage tier
Figure 4 shows number of daily top-100 videos stored in each storage tier. There was more of daily top-100 videos resided on the fist storage tier when our algorithm was used. There were many days that the third tier stored more of daily top-100 videos than the first tier when round-robin and random algorithms were used.
We can say that both number of subscribers and maximum number of views were good candidates for load estimate.
V. CONCLUSION
In this paper, we proposed a data placement algorithm to be used in heterogeneous tiers of storage storing short videos. Our algorithm brought together the diversity in storage capability and video characteristics. Future load was estimated and used in data placement process. The goal was to distribute videos in such a way that each storage tier handled workload in the amount that fit its capability. However, the system could lose balance when actual load disagreed with estimated load. Our algorithm dynamically fixed the problem with the arrival of new videos. Therefore, migration was no longer required to maintain balance. The experiment was performed using real YouTube traces in seven day period. The result showed that the proposed algorithms gave better workload distribution when compared against round-robin and random algorithms.
REFERENCES [1] “YouTube”, http://www.youtube.com/
[2] R.J. Honicky and E.L. Miller. Replication under scalable hashing: a family of algorithms for scalable decentralized data distribution. In Proceedings of 18th International Parallel and Distributed Processing Symposium (IPDPS ’04), Santa Fe, NM, Apr. 2004
[3] L.W. Lee, P. Scheuermann and R. Vingralek. File assignment in parallel I/O systems with minimal variance of service time. IEEE Trans. on Computers, Vol 49, No.2. (2000) 127-140
[4] P. Scheuermann, G. Weikum and P. Zabback. Data partitioning and load balancing in parallel disk systems. The VLDB Journal - The International Journal on Very Large Data Bases, Vol. 7, No. 1. (1998) 48-66
[5] D. Feng and L. Qin. Adaptive Object Placement in Object-Based Storage Systems with Minimal Blocking Probability. In Proceedings of the 20th International Conference on Advanced Information Networking and Applications (AINA ‘06), Vienna, Austria, Apr. 2006 [6] X. Cheng, C. Dale and J. Liu. Statistics and social network of youtube
videos. In Proceedings of the 16th IEEE International Workshop on Quality of Service (IWQoS ’08), Enschede, Netherlands, Jun. 2008
[7] M. Factor, K. Meth, D. Naor, O. Rodeh and J. Satran. Object Storage: The Future Building Block for Storage Systems. In Proceedings of the Second International IEEE Symposium on Emergence of Globally Distributed Data, Sardinia, Italy, Jun. 2005
[8] K. S. Tang, K. T. KO, S. Chan and E. Wong, “Optimal file placement in VOD system using genetic algorithm”, IEEE Industrial Electronics, Vol 48, No.5. (2001) 891-897
[9] W.K.S. Tang, E.W.M. Wong, S. Chan and K.-T. Ko, “Optimal video placement scheme for batching VOD services”, IEEE Trans. on Broadcasting, Vol 50, No.1. (2004) 16-25
[10] A. Goel, C. Shahabi, D. S. Yao and R. Zimmermann. SCADDAR: An Efficient Randomized Technique to Reorganize Continuous Media Blocks. In Proceedings of The 18th IEEE International Conference on Data Engineering (ICDE ’02), San Jose, CA, Feb. 2002
[11] S. A. Weil, S. A. Brandt, E. L. Miller and C. Maltzahn. CRUSH: Controlled, Scalable, Decentralized Placement of Replicated Data. In Proceedings of the 2006 ACM/IEEE Conference on Supercomputing (SC ’06), Tampa, FL, Nov. 2006.
[12] “Alexa Top 500 Global Sites”, http://www.alexa.com/topsites. [13] “YouTube Metadata”,
http://code.google.com/apis/youtube/2.0/reference.html.
Wiboonsak Jaiphakdee was born in Bangkok (Thailand),
November 27th 1982, earned B.S. in Applied Mathematics from Faculty of Science, King Mongkut's Institute of Technology Ladkrabang, Bangkok, Thailand in 2005. He is currently a graduate student in Computer Engineering program, Faculty of Engineering, King Mongkut's Institute of Technology, Ladkrabang, Bangkok, Thailand. His current research project is related to data placement of short videos in heterogeneous storage system.
Chutimet Srinilta earned a B.Eng. degree in Electrical