This is a repository copy of Cortical Maps.
White Rose Research Online URL for this paper: http://eprints.whiterose.ac.uk/94462/
Version: Accepted Version
Article:
Bednar, J.A. and Wilson, S.P. (2015) Cortical Maps. Neuroscientist. ISSN 1073-8584 https://doi.org/10.1177/1073858415597645
Reuse
Unless indicated otherwise, fulltext items are protected by copyright with all rights reserved. The copyright exception in section 29 of the Copyright, Designs and Patents Act 1988 allows the making of a single copy solely for the purpose of non-commercial research or private study within the limits of fair dealing. The publisher or other rights-holder may allow further reproduction and re-use of this version - refer to the White Rose Research Online record for this item. Where records identify the publisher as the copyright holder, users can verify any specific terms of use on the publisher’s website.
Takedown
If you consider content in White Rose Research Online to be in breach of UK law, please notify us by
Cortical maps
James A. Bednar & Stuart P. Wilson
Abstract
In this paper we review functional organization in sensory cortical re-gions – how the cortex represents the world. We consider four interre-lated aspects of this organization: (1) the set of receptive fields of indi-vidual cortical sensory neurons, (2) how lateral interaction between these neurons reflects similarity of their receptive fields, (3) the spatial distribu-tion of receptive-field properties across the horizontal extent of the cortical tissue, and (4) how the spatial distributions of different receptive field prop-erties interact with one another. We show how this data is generally well explained by the theory of input-driven self-organization, with a family of computational models of cortical maps offering a parsimonious account for a wide range of map-related phenomena. We then discuss important chal-lenges to this explanation, with respect to the maps present at birth, maps present under activity blockade, the limits of adult plasticity, and the lack of some maps in rodents. Because there is not at present another credible general theory for cortical map development, we conclude by proposing key experiments to help uncover other mechanisms that might also be operating during map development.
Keywords:cortical map, topological map, topographic map, receptive field, visual cortex, self-organization, primate, rodent.
Introduction
that demonstrate how maps of the world can emerge from self-organizing prin-ciples, that is, how maps emerge from individually simple interactions between neurons, without plan or instruction. The success of these models in accounting for a wealth of experimental data on cortical maps motivates self-organization as an important theory of cortical maps, with no other type of model currently able to account for this range of observations. However, there remain significant unsolved issues that challenge this theory, which we discuss with an eye towards possible future experiments to resolve the outstanding issues. We begin by defining the key terms used to describe the functional properties and organization of cortical maps.
What are cortical maps?
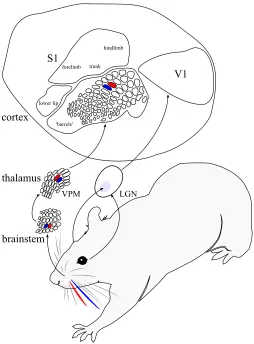
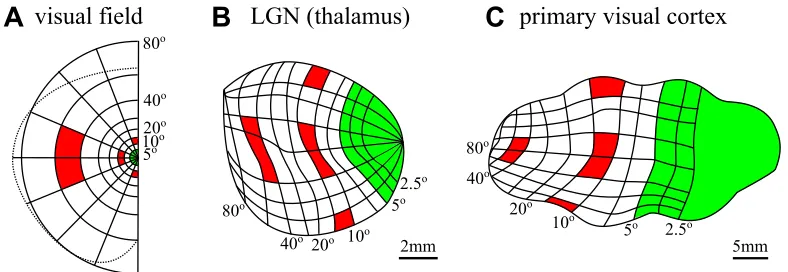
A map is a representation. Aneural mapis a representation in a network of neu-rons that respond systematically to events outside the network. A neural map in one network may be defined with respect to another network, such as when an ex-perimenter activates cells of one brain area and observes correlated responses in cells of another. Neural maps may also be defined for events that occur external to the brain, such as when we measure neural responses to external stimuli activating sensors in the skin, cochlea, or retina. By acortical mapwe refer specifically to a correspondence between responses in an anatomically defined network of corti-cal neurons and some events external to the brain (i.e., the functional properties of these neurons, and their functional organization). Commonly studied exam-ples of cortical maps are found in the primary somatosensory, auditory, and visual cortices, as well as areas of the motor cortex. Here we will focus primarily on sen-sory maps, where the functional organization has been established most clearly. Figure 1 shows examples of the anatomical pathway from the sensory surfaces to the primary somatosensory and visual cortex regions of a rat, including both sub-cortical and sub-cortical maps. Figure 2 shows the details of the retinotopic mapping between the eye, the thalamus, and the primate primary visual cortex.
V1
trunk hindlimb
forelimb
lower lip
S1
'barrels'
VPM LGN
brainstem cortex
[image:4.612.179.433.86.430.2]thalamus
80o
40o 20o 10o
5o 80o
40o
20o 10o
5o 2.5o
5mm 80o
40o 20o 10o
5o 2.5o
2mm
visual field LGN (thalamus) primary visual cortex
[image:5.612.109.503.224.360.2]A
B
C
can modulate neuronal activity, such as the location, contrast, color, orientation, or spatial frequency of an edge in an image, the receptive field may be defined functionally in terms of feature dimensions. The receptive field of a neuron thus more generally refers to a localized region in a multidimensional feature space (see Obermayer and others, 1992). For instance, a V1 neuron might have a prefer-ence for a certain range of retinal locations (x,y), orientations, motion directions, colors, spatial frequencies, and contrasts, responding selectively to some region of this seven-dimensional space (cf. Adelson and Bergen, 1991). The receptive field thus defines a relation such that the activity of this neuron represents (corresponds to with some probability) an occurrence of an external event in the corresponding portion of the feature space. Along a given dimension, the preferred region of space might be very local (e.g. for a neuron highly selective for orientation), or extended (for a neuron responding to a wide range of contrasts). The shape of this region of space characterizes the patterns to which a neuron will respond, at least for stimuli presented in isolation. Figure 3 shows an example of mapping a receptive field as a region of a three-dimensional space (x, y, orientation).
It is often convenient to summarize a receptive field in terms of thepreferenceand theselectivityof the neuron, with respect to a particular dimension of the feature space. Given a parametric stimulus characterized by some feature dimensions, the preference of a neuron is the value of the parameter that elicits the maximum response in the neuron. For example, a visual cortex neuron might have a pref-erence for edges at a particular location on the retina, of a particular orientation. The selectivity is then usually defined as the ratio between the response to the preferred stimulus, and the mean response to other stimuli that vary with respect to that dimension of the feature space. An orientation-selective neuron will have a high response to its preferred orientation and low responses to others (see e.g. figure 3D).
In-spi
ke
s/
se
cond
x
y
ori
e
nt
a
ti
on (
θ
)
R F
A
feature space
B
experiment
C
recordings
D
response
[image:7.612.111.505.210.352.2]ON
Figure 3: Mapping a receptive field (RF) in feature space. To map the RF as a region of some feature space, stimuli first are constructed that cover that space.
teractions may be described in terms of spatial relationships between neurons, as one might graph the excitation of one neuron by another against the distance that separates them in the tissue. Or an interaction may be described in terms of the functional relationships between neurons, as one might graph the correspondence between neurons as a function of the similarity of their receptive fields.
Many cortical maps reveal themselves as a strong relationship between these two types of interactions, such that the proximity of neurons in physical space is corre-lated with the proximity of what they represent in feature space. For example, as Hubel and Wiesel (1974) moved a recording electrode from position A to points B at increasing distance along the V1 cortical surface, the difference in preferred edge orientation between A and B increased. Hubel and Wiesel (1974) had mea-sured a topological map, as the topology of the feature space was conserved in the projection of the map onto the cortical surface. Since adjacent regions in the feature space project to adjacent regions in the tissue of such a map, topological maps are described as having goodcontinuity(Obermayer and others, 1990).
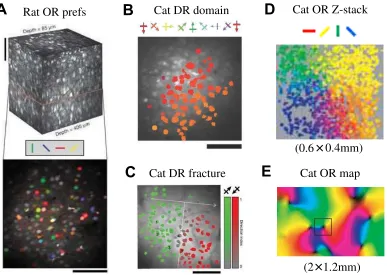
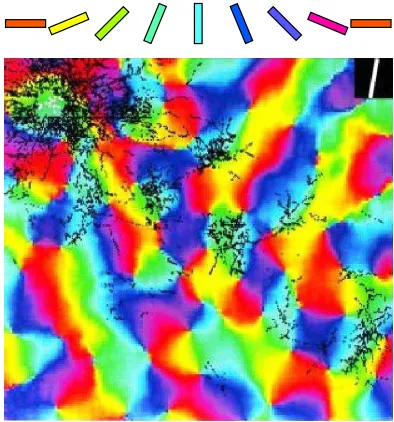
When neurons are labeled by their preferences, and the labels are arranged on an image to reflect the position of each neuron in the tissue, topological maps can be visualized as continuously varying spatial patterns. Separate map images for each dimension of the feature space can be derived from a single set of neurons. For ex-ample, if we establish the preferred orientations of V1 neurons, we can construct an orientation preference map (see figure 4). Orientation and other feature maps are functional phenomena, reflecting how the neurons in the maps behave for vi-sual stimuli, but the patterns have been shown to have anatomical correlates too (figure 5). Specifically, injecting a tracer into a local patch of iso-oriented neurons has been found to label neurons with similar preferences at distant locations in the map (Bosking and others, 1997). This map-specific connectivity is thought to un-derlie a wide variety of surprising phenomena, such as visual surround modulation (reviewed in Angelucci and Bressloff, 2006).
Cat DR domain
Cat DR fracture
(0.6×0.4mm)
(2×1.2mm)
Rat OR prefs Cat OR Z-stack
Cat OR map
A
B
C
D
[image:9.612.115.502.128.403.2]E
Figure 4: Orientation and direction maps in rodents and cats. Two-photon imaging techniques allow every neuron in a small volume to be labeled with its feature preference, similarly to how preferences of single neurons were measured in figure 3.A.The rodent V1 map for orientation preference has no evident spatial structure—even though individual neurons are orientation selective, and despite an overall retinotopic map, orientation preferences are locally highly disordered.
B,C.Similar methods in non-rodent mammals show highly ordered maps, e.g. for motion direction preference in cat V1 as shown here.D.Preferences in non-rodent species are highly ordered vertically as well, with similar orientation preference in each layer of the visual cortex that can be imaged using this technique. E.
a periodic topology onto a two-dimensional surface (see Durbin and Mitchison, 1990).
When spatial map patterns for different features are compared, map contours tend to intersect at right angles, as is the case when contours delineating spatial fre-quency or eye preferences are superimposed on iso-orientation contours (Issa and others, 2008; Blasdel, 1992). Such mappings are said to beorthogonal, meaning that within an area of preference for one specific parameter value the mapping of a second feature has good coverage with respect to the first, e.g., for each ori-entation, all spatial frequencies will tend to be represented (Nauhaus and others, 2012). Topological map patterns have been described as reflecting an optimal trade-off between continuity and coverage constraints (Swindale, 1991; Swindale and others, 2000), although the details of how to test this claim have been contro-versial.
Topographic mapsare a subset of topological maps where nearby locations in the target region correspond to nearby locations in the source region, at least at some spatial scale. The prototypical example of a topographic map is the retinotopic map, which is the largest-scale functional organization of responses found in V1, i.e. the organization by the preferred location of stimuli on the retina (figure 2). Topographic maps typically reflect the spatial organization of receptor cells on a sensory surface, such as the overall pattern of tactile receptive fields that define the homunculi in illustrations of the map of the body surface in primary somatosen-sory cortex (S1; Penfield and Boldrey, 1937; see also Wilson and Moore, 2015).
A theory of cortical map formation
Given the observations about how cortical maps represent the external world, an obvious and longstanding question is how this relationship comes about. Is such a mapping established according to a pre-set program, which supports adaptive behavior to the extent that the hardwiring happens to be a good fit to the actual environment? Or is the functional organization (and thus representation) an emer-gent property of an interaction between the organism and its environment during development?
Theories about the process of map formation have been formalized as a series of numerous computational models over the past forty years, to allow our intuitions to be expressed precisely and tested for consistency. Here we first describe in some detail a model of map self-organization developed by von der Malsburg (1973), which captures several of the fundamental building blocks for a theory of cortical maps, and upon which an appreciation of more recent refinements to this theory may be built.
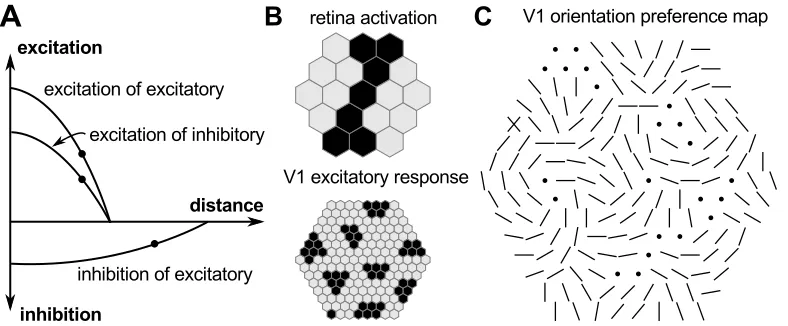
The model of von der Malsburg (1973) comprises three populations of cells: a set of 19 photoreceptor cells, a population of 169 excitatory cortical neurons, and a population of 169 inhibitory cortical neurons (see figure 6). Photoreceptors are arranged on a two-dimensional sheet corresponding to a small patch of the retina, and cortical neurons are arranged on a two-dimensional sheet corresponding to a small patch of V1. When the photoreceptors are activated by a pattern of light on the retina they increase the activity of the excitatory neurons; these in turn in-crease the activity of neurons nearby in V1; when inhibitory neurons are excited they reduce the activity of nearby excitatory neurons. Crucially, the influence of excitatory neurons is limited to other neurons falling within a small radius cen-tered on their position in V1, whereas the influence of inhibitory neurons extends over a somewhat larger range. (This model predated the discovery of the long-range patchy excitatory connections like those in figure 5, but most such models even today also omit those connections because they are not required for the self-organization process.)
corresponding photoreceptor activity, and then summing over the connections for each neuron. Because the initial weights are random, the very first pattern of acti-vation across the cortex is random too. But as the neurons interact, the influence of the short-range excitation is to cause any random initial groupings of activity in V1 to be strengthened, while the longer-range inhibition causes nearby group-ings to compete with one another, with the combined inhibition from the strongest initial groupings effectively silencing the initially weaker groupings nearby. The net effect as these dynamics settle is to collect the initially random distribution of activity across V1 into discrete bubbles. The dynamics are consolidated by modifying the weights in proportion to the combined presynaptic and postsynap-tic activity, which increases weights between active photoreceptors and neurons that fall within the emergent activity bubbles. Hence if a similar pattern of light is next presented on the retina, these particular neurons are more likely to win the competition again. The learning mechanism is similar to that proposed by Hebb (1949), with an additional constraint that the weights are scaled after each step so that the total remains constant for each neuron. Consequently, as the weights to the active photoreceptors increase slightly, the weights to the inactive photorecep-tors decrease to compensate, hence the winners of the first competition are less likely to respond to a second pattern of light that is dissimilar to the first.
von der Malsburg (1973) trained his network on patterns corresponding to bars of light across the center of the retina, with each bar oriented randomly in the full range from 0 to π radians. He found that over time the patterns of weight
values came to match the range of oriented patterns used to train the network, and as the alignment between the retinal patterns and the weight patterns defines the magnitude of the each neuron’s response a preferred orientation could be as-signed to each, and thus an orientation map could be measured in the model V1. Remarkably, the emergent orientation maps revealed smooth topological patterns punctuated by pinwheels (figure 6C).
by homogeneous and local communication between neurons. The emergent or-ganization is the result of self-oror-ganization, because once the architecture of the network has been configured, no mechanism with access to the state of all corti-cal neurons is required to give rise to a pattern of organization defined across the population.
The von der Malsburg (1973) networks were trained by presenting all oriented patterns at a single location on the small patch of simulated retina, and thus learnt to represent only orientation and not other feature dimensions like retinotopic po-sition. Willshaw and von der Malsburg (1976) showed how a very similar model could explain aspects of retinotopic mapping instead, if retinal patterns vary in their position rather than orientation. The Laterally Interconnected Synergetically Self-Organizing Map model (LISSOM) of Sirosh and Miikkulainen (1994) further extended this model to include both retinotopy and orientation or another feature preference simultaneously, and to allow plasticity of lateral connections to explain the type of patchy connectivity shown in figure 5. LISSOM also abstracted over some of the features of the original 1973 model, such as describing cortical units as mini-columns and thus collapsing V1 to a single population of units that can both excite and inhibit neighbors. Related self-organizing-map (SOM) models further abstracted the lateral interactions into a process of picking single winning neurons, but could generate similar results (Obermayer and others, 1990; Ritter and others, 1992). Later versions of the LISSOM model instead added biologi-cal details not in the 1973 model, such as a representation of thalamic processing between the sensory and cortical sheets that allows them to accept natural im-ages as input, as well as modeling numerous feature dimensions simultaneously (e.g. orientation, ocular dominance, and motion direction; Miikkulainen and oth-ers, 2005; Bednar and Miikkulainen, 2006). The LISSOM model otherwise re-tains the essential normalized Hebbian learning rule and recurrent architecture of short-range excitation and long-range inhibition as in the original 1973 model (see also Carreira-Perpin and Goodhill, 2004). More recent versions of the LISSOM model, called GCAL (Gain Control, Adaptation, Laterally connected; Stevens and others, 2013), replace many of the hand-tuned parameters of earlier models with automatic homeostatic mechanisms, which make the model robustly and stably generate map patterns and representations that reflect the feature dimensions of the environment, as observed in animals (Chapman and others, 1996; Tanaka and others, 2006).
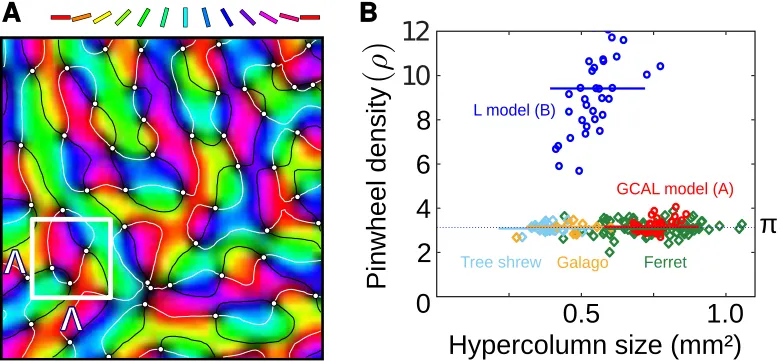
Stevens and others (2013), a different approach is to simply assume that stable maps of the feature space will emerge, and to ask under what regime of the net-work particular types of overall map pattern are most stable. A model developed by Wolf (2005) describes the lateral interactions between neurons by a mathe-matical kernel applied across a continuous two-dimensional cortical surface, and describes learning not in explicitly cortical terms but implicitly as a function of the distance between neuronal receptive fields in feature space. When described in this way, the functional organization can be shown to yield realistic topologi-cal map patterns only when certain constraints are imposed. Wolf (2005) proved mathematically, and demonstrated computationally, that the key constraint that guarantees that orientation maps will emerge as the tiling of pinwheels seen in pri-mate V1 is inhibitory interactions that are strongest between neurons representing similar orientations and long-ranging across the cortex compared to excitation. When this constraint is enforced via the kernel a clear prediction of the model can be derived from its equations; pinwheels should on average be spaced π hyper-columns apart (Kaschube and others, 2008). The same property was also found in the GCAL model (Stevens and others, 2013; see figure 7). Quite remarkably, when the pinwheel density of maps in tree shrews, bush babies, and ferrets were later measured, they were found to converge toπ(Kaschube and others, 2010; see also Keil and others, 2012). These mammalian lineages diverged over 65 million years ago, hence orientation-specific long-range inhibitory interactions seem to have been either an evolutionarily well conserved constraint on the mechanisms of map formation, or an example of convergent evolution.
Complications
Figure 7: Universal properties of maps across species.A.Pinwheels (point sin-gularities) in the orientation map can be labeled automatically, as shown with white dots here for a GCAL model orientation map from Stevens and others (2013). B. If an area is drawn corresponding to the average distanceΛat which
However, there remain numerous important phenomena not explained by self-organizing models, or which appear to be in direct conflict with these models. The subsections provide a guide to these issues, suggesting alternative models or extensions to the models in each case.
Activity-independent development of topography
Even though self-organizing models can develop realistic maps based on cues from neural activity, experimental evidence strongly suggests that at least the ini-tial topographic maps between regions are actually independent of neural activity, and thus require other mechanisms. For instance, neurons from the eye still locate their targets in downstream regions reliably and in the same rough topographic or-der even if neural activity is disrupted using tetrodotoxin (reviewed in Huberman and others, 2008).
This initial development has been well described by a series of models based on chemoaffinity, using gradients of chemical markers expressed in the source and target regions that axons can use to provide a rough relative coordinate system sufficient to establish the mapping (Flanagan, 2006; Hjorth and others, 2015). Ac-tivity has only apparently minor influence on this process (Kita and others, 2015). Thus in practice, current self-organizing models simply assume an initial rough topography to have been set up by such mechanisms, and focus on subsequent activity-dependent processes (Stevens and others, 2013).
Feature maps present at birth
locality; Feller and others, 1996; Huberman and others, 2006; Cang and others, 2005).
Self-organizing models have been shown to develop realistic maps when given ap-proximations to spontaneous activity patterns as input (Stevens and others, 2013). However, because the detailed properties of the spontaneous activity patterns are not well established, it is not yet clear if the activity does have all the features necessary to develop realistic patterns of the maps seen prior to visual experience, or whether the models will account for the detailed interaction between the envi-ronment and previously established map structure. For instance, orientation maps in V1 match between the two eyes even without visual experience, which would not be expected if the eyes generate spontaneous activity independently (Jegelka and others, 2006), but recent evidence shows correlations between activity in the two eyes that could be sufficient for such matching (Ackman and others, 2012). Making comprehensive measurements of spontaneous activity across early sen-sory systems will be crucial for testing hypotheses about the source of the initial organization.
Postnatal plasticity
Of course, feature-map models have been proposed that use mechanisms fully independent of activity, such as relying on geometric patterns formed by overlap-ping arbors of sensory cells (Paik and Ringach, 2011), although these models have so far failed key tests of plausibility (Hore and others, 2012; Schottdorf and others, 2014). There are also models based on spontaneous intracortical activity rather than sensory activity (Grabska-Barwinska and von der Malsburg, 2008; Ernst and others, 2001). In any case, it is difficult to reconcile any of these types of models with the postnatal effects of visual experience. For instance, kittens reared using goggles that blur all but vertical orientations develop orientation maps dominated by vertical-preferring neurons (Tanaka and others, 2006),
it has typically only been during specific critical periods after birth (Huberman and others, 2008). A detailed explanation for why there should be such limits to plasticity, including what mechanisms achieve this, remains to be formulated, and will require substantial further experimentation.
The rodent problem
Finally, a major problem with theories based on self-organization is explaining cases where maps are not well organized, yet individual neurons are selective. In particular, although primates, carnivorans, and many other species exhibit the smooth, continuous map organization predicted by these models, rodent primary visual cortex maps with orientation-selective cells appear randomly organized (Ohki and others, 2005b, 2006b; Ohki and Reid, 2007; see figure 4A). There is as yet no consensus on what causes these qualitative differences between species, but some speculative theories have been advanced, as described next. For instance, given that the smoothly varying preferences are established by lateral connectiv-ity, larger variations in this connectivity in rodents could be sufficient to explain the lack of orientation maps (Law, 2009).
cortex (A1). The existence of smooth tonotopic maps in mouse A1 appeared first to be accepted (Stiebler and others, 1997; Zhang and others, 2005), before being disputed by two-photon calcium imaging data showing a tonotopic arrangement on a macroscale but not at the resolution of individual neurons (Rothschild and others, 2010, and Bandyopadhyay and others, 2010, in 13-35 day old mice), and later accepted again (Hackett and others, 2011), most recently using two-photon imaging in slightly older animals (24-43 days; Winkowski and Kanold, 2013).
It is therefore possible that topological orientation preference maps may yet be found in V1 of older rodents. Interestingly, a study of spiking synchrony between pairs of V1 neurons in older mice (56-168 days) found stronger synchrony be-tween neurons with similar orientation preferences and bebe-tween neurons that are closer together (Denman and Contreras, 2014). The authors assumed that topolog-ical maps are absent in mouse V1 and thus concluded that the functional organi-zation was independent of an underlying map pattern, but in light of the evidence that rodent S1 maps emerge late it would be interesting to establish whether these correlations together in fact define a topological map. In a study of 2-5 month old mice, Bonin and others (2011) similarly found that (weak) correlations in cal-cium signals reduce as a function of the distance between cortical neurons, but also as differences in the preferred orientation and retinotopic location of neurons increases, although they attribute most of the organization to an overall retinotopic mapping.
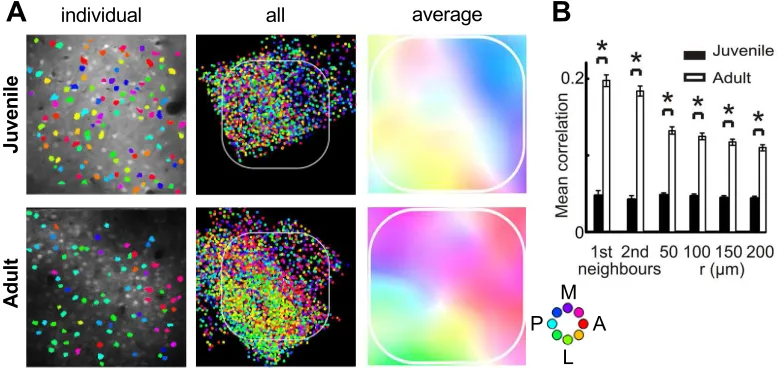
Figure 8: Postnatal development of whisker direction preference maps in ro-dent barrel cortex. A.The organization of direction preferences in juvenile (32-39 days postnatal) versus adult (81-112 days) rats. The preferences are shown for a300×300µmregion from a representative individual from each group in the left
eyes open than before. Specifically, orientation tuning was higher in mice aged 28-35 days compared to mice aged 14-15 days. The data were well described by a self-organizing model driven by visual experience, suggesting that recurrent cor-tical circuitry is refined by activity-dependent processes, although a subsequent study from the same group found that orientation-specific connectivity emerged surprisingly robustly in dark-reared animals, thus suggesting an important role for intrinsic factors too (Ko and others, 2014).
Squirrels, however, are an interesting challenge to most such explanations for the lack of rodent feature maps. Squirrels are highly visual, high-acuity rodents with a V1 comparable in size to ferrets, and with an ecological niche comparable to that of tree shrews, yet they do not appear to have smooth orientation maps (van Hooser and others, 2005). It is of course possible that despite these similarities, squirrels share common evolutionary pressures with other rodents that they do not share with animals with topological maps. Theoretically, primate-like topological maps have been found to optimize intracortical wiring lengths under the constraint that similarly tuned features should be preferentially connected, while random maps optimize wiring lengths under the constraint that neurons should form con-nections to others covering the full range of features (Koulakov and Chklovskii, 2001). Perhaps, for reasons as yet unknown, such patterns of connectivity are more suited to the problems being solved by squirrel visual systems, though if so they are difficult to reconcile with the orientation-specific connections observed in mouse (Ko and others, 2013).
have been established in auditory thalamic nuclei (Hackett and others, 2011).
Interestingly, Piscopo and others (2013) found that many orientation and direction selective neurons in mouse LGN had non-linear receptive fields, i.e., they were orientation and/or direction selective and fired at similar rates for all spatial phases of a drifting sinusoidal image. In contrast to other cells with linear phase response properties, these neurons had linearity indices ofF = 1.0±0.18, placing them
on the border between simple (F = 0) and complex (F = 2) cells (Skottun and
others, 1991). In primates, cells with nonlinear phase responses are first found in V1 (Hubel and Wiesel, 1962), and self-organizing models have explained this emergent property as a process of local pooling in V1 from cells that are selective for similar orientations (because of primate V1’s topological map of orientation) but different phases (due to local variability in receptive field structure; Antolik and Bednar, 2011; Hyv¨arinen and others, 2009; Weber, 2001). This finding raises the intriguing possibility that orientation preference maps may not emerge at the cortical level in rodents, simply because such nonlinear cells are already present at the LGN level (in line with the hypotheses of Nauhaus and Nielsen, 2014, and Wilson and Bednar, 2015).
Conclusions
REFERENCES REFERENCES
References
Ackman, J. B., Burbridge, T. J., and Crair, M. C. (2012). Retinal waves coor-dinate patterned activity throughout the developing visual system. Nature, 490(7419):219–225.
Adelson, E. H. and Bergen, J. R. (1991). The plenoptic function and the elements of early vision. Computational models of visual processing, 1(2):1–20.
Andermann, M. L. and Moore, C. I. (2006). A somatotopic map of vibrissa motion direction within a barrel column. Nat Neurosci, 9(4):543–551.
Angelucci, A. and Bressloff, P. C. (2006). Contribution of feedforward, lateral and feedback connections to the classical receptive field center and extra-classical receptive field surround of primate V1 neurons. Progress in Brain Research, 154:93–120.
Antolik, J. and Bednar, J. A. (2011). Development of maps of simple and complex cells in the primary visual cortex. Frontiers in Computational Neuroscience, 5:17.
Bandyopadhyay, S., Shamma, S. A., and Kanold, P. O. (2010). Dichotomy of functional organization in the mouse auditory cortex. Nat Neurosci, 13(3):361–368.
Bednar, J. A. (2012). Building a mechanistic model of the development and func-tion of the primary visual cortex. Journal of Physiology (Paris), 106:194– 211.
Bednar, J. A. and Miikkulainen, R. (2006). Joint maps for orientation, eye, and direction preference in a self-organizing model of V1. Neurocomputing, 69(10–12):1272–1276.
Blasdel, G. G. (1992). Orientation selectivity, preference, and continuity in mon-key striate cortex. The Journal of Neuroscience, 12:3139–3161.
Bonhoeffer, T. and Grinvald, A. (1991). Iso-orientation domains in cat visual-cortex are arranged in pinwheel-like patterns. Nature, 353:429–431.
REFERENCES REFERENCES
Bosking, W. H., Zhang, Y., Schofield, B., and Fitzpatrick, D. (1997). Orientation selectivity and the arrangement of horizontal connections in tree shrew striate cortex. J Neurosci, 17(6):2112–2127.
Bruno, R. M., Khatri, V., Land, P. W., and Simons, D. J. (2003). Thalamocortical angular tuning domains within individual barrels of rat somatosensory cortex. J Neurosci, 23(29):9565–9574.
Cang, J., Renteria, R. C., Kaneko, M., Liu, X., Copenhagen, D. R., and Stryker, M. P. (2005). Development of precise maps in visual cortex requires pat-terned spontaneous activity in the retina. Neuron, 48(5):797–809.
Carreira-Perpin, M. A. and Goodhill, G. J. (2004). Influence of lateral connections on the structure of cortical maps. J Neurophysiol, 92(5):2947–2959.
Chapman, B., Stryker, M. P., and Bonhoeffer, T. (1996). Development of ori-entation preference maps in ferret primary visual cortex. The Journal of Neuroscience, 16(20):6443–6453.
Cheong, S. K., Tailby, C., Solomon, S. G., and Martin, P. R. (2013). Cortical-like receptive fields in the lateral geniculate nucleus of marmoset monkeys. J Neurosci, 33(16):6864–6876.
Clancy, K. B., Schnepel, P., Rao, A. T., and Feldman, D. E. (2015). Structure of a single whisker representation in layer 2 of mouse somatosensory cortex. J Neurosci, 35(9):3946–3958.
Connolly, M. and Van Essen, D. (1984). The representation of the visual field in parvicellular and magnocellular layers of the lateral geniculate nucleus in the macaque monkey. J Comp Neurol, 226(4):544–564.
Denman, D. J. and Contreras, D. (2014). The structure of pairwise correlation in mouse primary visual cortex reveals functional organization in the absence of an orientation map. Cereb Cortex, 24(10):2707–2720.
Dhande, O. S. and Huberman, A. D. (2014). Retinal ganglion cell maps in the brain: implications for visual processing. Curr Opin Neurobiol, 24(1):133– 142.
REFERENCES REFERENCES
Ernst, U., Pawelzik, K., Sahar-Pikielny, C., and Tsodyks, M. (2001). Intracortical origin of visual maps. Nature Neuroscience, 4(4):431–436.
Feller, M. B., Wellis, D. P., Stellwagen, D., Werblin, F. S., and Shatz, C. J. (1996). Requirement for cholinergic synaptic transmission in the propagation of spontaneous retinal waves. Science, 272:1182–1187.
Flanagan, J. G. (2006). Neural map specification by gradients. Current Opinion in Neurobiology, 16:1–8.
Grabska-Barwinska, A. and von der Malsburg, C. (2008). Establishment of a scaffold for orientation maps in primary visual cortex of higher mammals. The Journal of Neuroscience, 28(1):249–257.
Hackett, T. A., Barkat, T. R., O’Brien, B. M. J., Hensch, T. K., and Polley, D. B. (2011). Linking topography to tonotopy in the mouse auditory thalamocorti-cal circuit. J Neurosci, 31(8):2983–2995.
Harris, K. D. and Mrsic-Flogel, T. D. (2013). Cortical connectivity and sensory coding. Nature, 503(7474):51–58.
Hebb, D. (1949). Organization of behavior. Wiley, New York.
Hjorth, J. J. J., Sterratt, D. C., Cutts, C. S., Willshaw, D. J., and Eglen, S. J. (2015). Quantitative assessment of computational models for retinotopic map formation. Developmental Neurobiology, 75(6):641–666.
Hore, V. R. A., Troy, J. B., and Eglen, S. J. (2012). Parasol cell mosaics are un-likely to drive the formation of structured orientation maps in primary visual cortex. Visual Neuroscience, 29(6):283–299.
Hubel, D. H. and Wiesel, T. N. (1962). Receptive fields, binocular interaction and functional architecture in the cat’s visual cortex. J Physiol, 160:106–154.
Hubel, D. H. and Wiesel, T. N. (1974). Sequence regularity and geometry of ori-entation columns in the monkey striate cortex. J Comp Neurol, 158(3):267– 293.
Huberman, A. D., Feller, M. B., and Chapman, B. (2008). Mechanisms under-lying development of visual maps and receptive fields. Annual Review of Neuroscience, 31:479–509.
REFERENCES REFERENCES
activity mediates development of ocular dominance columns and binocular receptive fields in V1. Neuron, 52(2):247–254.
Hyv¨arinen, A., Hurri, J., and Hoyer, P. O. (2009). Natural Image Statistics: A Probabilistic Approach to Early Computational Vision. Springer, Berlin.
Issa, N. P., Rosenberg, A., and Husson, T. R. (2008). Models and measurements of functional maps in V1. J Neurophysiol, 99(6):2745–2754.
Jegelka, S., Bednar, J. A., and Miikkulainen, R. (2006). Prenatal development of ocular dominance and orientation maps in a self-organizing model of V1. Neurocomputing, 69:1291–1296.
Kaas, J. H. (2000). Why is brain size so important: Design problems and solutions as neocortex gets bigger or smaller. Brain and Mind, 1:7–23.
Kaschube, M. (2014). Neural maps versus salt-and-pepper organization in visual cortex. Curr Opin Neurobiol, 24(1):95–102.
Kaschube, M., Schnabel, M., Lwel, S., Coppola, D. M., White, L. E., and Wolf, F. (2010). Universality in the evolution of orientation columns in the visual cortex. Science, 330(6007):1113–1116.
Kaschube, M., Schnabel, M., and Wolf, F. (2008). Self-organization and the se-lection of pinwheel density in visual cortical dev. New Journal of Physics, 10:015009.
Keil, W., Kaschube, M., Schnabel, M., Kisvarday, Z. F., Lwel, S., Coppola, D. M., White, L. E., and Wolf, F. (2012). Response to comment on universal-ity in the evolution of orientation columns in the visual cortex. Science, 336(6080):413.
Kerr, J. N. D., de Kock, C. P. J., Greenberg, D. S., Bruno, R. M., Sakmann, B., and Helmchen, F. (2007). Spatial organization of neuronal population responses in layer 2/3 of rat barrel cortex. J Neurosci, 27(48):13316–13328.
Kita, E. M., Scott, E. K., and Goodhill, G. J. (2015). The influence of activ-ity on axon pathfinding in the optic tectum. Developmental Neurobiology, 75(6):608–620.
REFERENCES REFERENCES
Ko, H., Mrsic-Flogel, T. D., and Hofer, S. B. (2014). Emergence of feature-specific connectivity in cortical microcircuits in the absence of visual expe-rience. The Journal of Neuroscience, 34(29):9812–9816.
Koulakov, A. A. and Chklovskii, D. B. (2001). Orientation preference patterns in mammalian visual cortex: A wire length minimization approach. Neuron, 29:519–527.
Kremer, Y., Leger, J.-F., Goodman, D., Brette, R., and Bourdieu, L. (2011). Late emergence of the vibrissa direction selectivity map in the rat barrel cortex. J Neurosci, 31(29):10689–10700.
Law, J. S. (2009). Modeling the Development of Organization for Orientation Preference in Primary Visual Cortex. PhD thesis, School of Informatics, The University of Edinburgh, Edinburgh, UK.
Li, L. and Ebner, F. F. (2007). Cortical modulation of spatial and angular tuning maps in the rat thalamus. J Neurosci, 27(1):167–179.
Linsker, R. (1988). Self-organization in a perceptual network.Computer, 21:105– 117.
Meng, Y., Tanaka, S., and Poon, C.-S. (2012). Comment on ”universality in the evolution of orientation columns in the visual cortex”. Science, 336(6080):413; author reply 413.
Miikkulainen, R., Bednar, J. A., Choe, Y., and Sirosh, J. (2005). Computational maps in the visual cortex. Springer, Berlin.
Nauhaus, I. and Nielsen, K. J. (2014). Building maps from maps in primary visual cortex. Curr Opin Neurobiol, 24(1):1–6.
Nauhaus, I., Nielsen, K. J., Disney, A. A., and Callaway, E. M. (2012). Orthogonal micro-organization of orientation and spatial frequency in primate primary visual cortex. Nat Neurosci, 15(12):1683–1690.
Niell, C. M. (2013). Vision: more than expected in the early visual system. Curr Biol, 23(16):R681–R684.
REFERENCES REFERENCES
Obermayer, K., Ritter, H., and Schulten, K. J. (1990). A principle for the for-mation of the spatial structure of cortical feature maps. Proceedings of the National Academy of Sciences, USA, 87:8345–8349.
Ohki, K., Chung, S., Ch’ng, Y. H., Kara, P., and Reid, R. C. (2005a). Functional imaging with cellular resolution reveals precise micro-architecture in visual cortex. Nature, 433(7026):597–603.
Ohki, K., Chung, S., Ch’ng, Y. H., Kara, P., and Reid, R. C. (2005b). Functional imaging with cellular resolution reveals precise micro-architecture in visual cortex. Nature, 433(7026):597–603.
Ohki, K., Chung, S., Kara, P., Hubener, M., Bonhoeffer, T., and Reid, R. C. (2006a). Highly ordered arrangement of single neurons in orientation pin-wheels. Nature, 442(7105):925–928.
Ohki, K., Chung, S., Kara, P., H¨ubener, M., Bonhoeffer, T., and Reid, R. C. (2006b). Highly ordered arrangement of single neurons in orientation pin-wheels. Nature, 442(7105):925–928.
Ohki, K. and Reid, R. C. (2007). Specificity and randomness in the visual cortex. Curr Opin Neurobiol, 17(4):401–407.
Paik, S.-B. and Ringach, D. L. (2011). Retinal origin of orientation maps in visual cortex. Nature Neuroscience, 14(7):919–925.
Penfield, W. and Boldrey, E. (1937). Somatic motor and sensory representation in the cerebral cortex of man as studied by electrical stimulation. Brain, 60:389–443.
Piscopo, D. M., El-Danaf, R. N., Huberman, A. D., and Niell, C. M. (2013). Di-verse visual features encoded in mouse lateral geniculate nucleus.J Neurosci, 33(11):4642–4656.
Purves, D., Riddle, D. R., and LaMantia, A. S. (1992). Iterated patterns of brain circuitry (or how the cortex gets its spots). Trends Neurosci, 15(10):362–368.
Ritter, H., Martinetz, T., and Schulten, K. J. (1992). Neural Computation and Self-Organizing Maps: An Introduction. Addison-Wesley, Reading, MA.
REFERENCES REFERENCES
Scholl, B., Tan, A. Y. Y., Corey, J., and Priebe, N. J. (2013). Emergence of orienta-tion selectivity in the mammalian visual pathway.J Neurosci, 33(26):10616– 10624.
Schottdorf, M., Eglen, S. J., Wolf, F., and Keil, W. (2014). Can retinal ganglion cell dipoles seed iso-orientation domains in the visual cortex? PLoS One, 9(1):e86139.
Sirosh, J. and Miikkulainen, R. (1994). Cooperative self-organization of afferent and lateral connections in cortical maps. Biological Cybernetics, 71:66–78.
Skottun, B. C., De Valois, R. L., Grosof, D. H., Movshon, J. A., Albrecht, D. G., and Bonds, A. B. (1991). Classifying simple and complex cells on the basis of response modulation. Vision Res, 31(7-8):1079–1086.
Stevens, J.-L. R., Law, J. S., Antolik, J., and Bednar, J. A. (2013). Mechanisms for stable, robust, and adaptive development of orientation maps in the primary visual cortex. Journal of Neuroscience, 33:15747–15766.
Stiebler, I., Neulist, R., Fichtel, I., and Ehret, G. (1997). The auditory cortex of the house mouse: left-right differences, tonotopic organization and quantitative analysis of frequency representation. J Comp Physiol A, 181(6):559–571.
Swindale, N. V. (1991). Coverage and the design of striate cortex. Biol Cybern, 65(6):415–424.
Swindale, N. V. (1996). The development of topography in the visual cortex: A review of models. Network: Comput Neural Syst, 7(2):161–247.
Swindale, N. V., Shoham, D., Grinvald, A., Bonhoeffer, T., and H¨ubener, M. (2000). Visual cortex maps are optimized for uniform coverage. Nat Neu-rosci, 3(8):822–826.
Tanaka, S., Ribot, J., Imamura, K., and Tani, T. (2006). Orientation-restricted con-tinuous visual exposure induces marked reorganization of orientation maps in early life. Neuroimage, 30(2):462–477.
Timofeeva, E., M´erette, C., Emond, C., Lavall´ee, P., and Deschˆenes, M. (2003). A map of angular tuning preference in thalamic barreloids. J Neurosci, 23(33):10717–10723.
REFERENCES REFERENCES
Study of the cortical representation of whisker directional deflection using voltage-sensitive dye optical imaging. Neuroimage, 53(1):233–238.
van Hooser, S. D., Heimel, J. A. F., Chung, S., Nelson, S. B., and Toth, L. J. (2005). Orientation selectivity without orientation maps in visual cortex of a highly visual mammal. J Neurosci, 25(1):19–28.
Van Hooser, S. D., Roy, A., Rhodes, H. J., Culp, J. H., and Fitzpatrick, D. (2013). Transformation of receptive field properties from lateral geniculate nucleus to superficial V1 in the tree shrew. J Neurosci, 33(28):11494–11505.
von der Malsburg, C. (1973). Self-organization of orientation sensitive cells in the striate cortex. Kybernetik, 14(2):85–100.
Weber, C. (2001). Self-organization of orientation maps, lateral connections, and dynamic receptive fields in the primary visual cortex. InProceedings of the International Conference on Artificial Neural Networks, Lecture Notes in Computer Science 2130, pages 1147–1152, Berlin. Springer.
Willshaw, D. J. and von der Malsburg, C. (1976). How patterned neural connec-tions can be set up by self-organization. Proceedings of the Royal Society of London. Series B, Biological Sciences, 194:431–445.
Wilson, S. P. and Bednar, J. A. (2015). What, if anything, are topological maps for? Developmental Neurobiology, in press.
Wilson, S. P., Law, J. S., Mitchinson, B., Prescott, T. J., and Bednar, J. A. (2010). Modeling the emergence of whisker direction maps in rat barrel cortex.PLoS One, 5(1):e8778.
Wilson, S. P. and Moore, C. (2015). S1 somatotopic maps. Scholarpedia.
Winkowski, D. E. and Kanold, P. O. (2013). Laminar transformation of frequency organization in auditory cortex. J Neurosci, 33(4):1498–1508.
Wolf, F. (2005). Symmetry, multistability, and long-range interactions in brain development. Phys Rev Lett, 95(20):208701.