This is a repository copy of Changes in solar PV output due to water vapour loading in a
future climate scenario.
White Rose Research Online URL for this paper:
http://eprints.whiterose.ac.uk/91577/
Version: Accepted Version
Proceedings Paper:
Smith, CJ, Crook, R and Forster, PM (2015) Changes in solar PV output due to water
vapour loading in a future climate scenario. In: EU PVSEC Proceedings. 31st European
Photovoltaic Solar Energy Conference 2015, 14-18 Sep 2015, Hamburg. , 2102 - 2105.
ISBN 3-936338-39-6
https://doi.org/10.4229/EUPVSEC20152015-5BV.1.30
[email protected]
https://eprints.whiterose.ac.uk/
Reuse
Unless indicated otherwise, fulltext items are protected by copyright with all rights reserved. The copyright
exception in section 29 of the Copyright, Designs and Patents Act 1988 allows the making of a single copy
solely for the purpose of non-commercial research or private study within the limits of fair dealing. The
publisher or other rights-holder may allow further reproduction and re-use of this version - refer to the White
Rose Research Online record for this item. Where records identify the publisher as the copyright holder,
users can verify any specific terms of use on the publisher’s website.
Takedown
If you consider content in White Rose Research Online to be in breach of UK law, please notify us by
CHANGES IN SOLAR PV OUTPUT DUE TO WATER VAPOUR LOADING IN A FUTURE CLIMATE SCENARIO
Christopher J. Smith1([email protected]), Rolf Crook1, Piers M. Forster2
1
Energy Research Institute, University of Leeds, Leeds LS2 9JT, UK
2
Institute for Climate and Atmospheric Science, University of Leeds, Leeds LS2 9JT, UK
ABSTRACT: Under a future climate, it is shown that the total atmospheric water vapour will increase over present levels. Water vapour has several distinct absorption bands in the visible and near-infrared parts of the spectrum, which is critical for PV conversion. The sensitivity of current world-leading c-Si, thin film and perovskite solar cells to the solar spectrum under different water vapour loadings is investigated. Semiconductors with bandgaps above 1.4 eV are more resilient to increases in atmospheric water vapour due to the avoidance of two large absorption bands in the near-infrared. Global changes in atmospheric water vapour are then taken from the HadGEM2-ES climate model under the RCP8.5 scenario, and used to determine the changes in PV output for clear-sky conditions for crystalline silicon (c-Si) and amorphous silicon (a-Si) solar cells. For some regions of the world, a decrease in power output of up to 3% for clear-sky conditions is seen for the spectral response of the current world-leading c-Si cell due to increasing water vapour, whereas a-Si performs better with a global power output decline of less than 1%.
Keywords: PV materials, simulation, spectral response, solar radiation, radiative transfer
1 INTRODUCTION
Nearly all climate models agree that the earth will warm over the course of the 21stCentury. For the same relative humidity, warmer air contains more water vapour. As water vapour exhibits several absorption bands in the visible and near-infrared part of the solar spectrum, an increase in water vapour has the potential to reduce the ground-level solar resource.
Solar PV is expected to become one of the leading sources of electricity generation over the course of the 21st Century, with photovoltaics (PV) providing up to
16% of global electricity production by 2050 [1]. The impact of PV on climate is well-known to be beneficial; however the reverse effect of the climate on PV resource has been investigated only recently (e.g. [2-4]). The majority of PV resource assessment procedures rely on climatological input data from the present or the recent past to forecast future PV resource. As the global proportion of solar PV increases, the projected change in future PV resource becomes important.
In this paper the sensitivity of six PV semiconductor
materials (c-Si, CIGS, CdTe, a-Si, CIGSS1 and a
perovskite2) to the amount of atmospheric water vapour are investigated. The expected global changes in relative PV output in cloudless skies are also shown for c-Si and a-Si using water vapour data from the UK Met Office HadGEM2-ES climate model.
2 EXPERIMENTAL METHOD
2.1 Generation of spectral irradiance
The ground-level solar irradiance spectrum is simulated using the DISORT radiative transfer code [5] included within the libRadtran software package [6]. Atmospheric inputs into the radiative transfer code are summarised in table I. Water vapour, measured in mm, describes the depth of water that would accumulate if all of the vapour present in an atmospheric column fell as rain.
Effects such as Rayleigh scattering and water vapour
1
CuInGaSSe
2
CH3NH3Pb(I1-xBrx)3
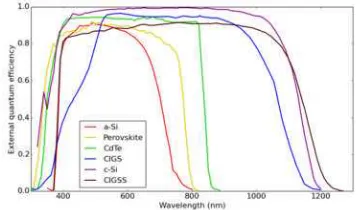
[image:2.595.312.528.408.696.2]absorption increase with air mass. In fig. 1, the clear-sky spectrum calculated for the average daytime zenith angle at 5 different latitudes is shown, which shows how the increase in air mass changes the shape of the spectrum alongside the reduction in spectral irradiance at all wavelengths.
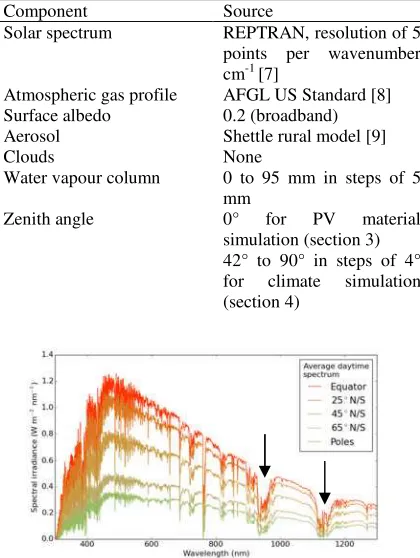
Table I:Baseline parameters for the clear-sky radiative transfer simulation
Component Source
Solar spectrum REPTRAN, resolution of 5
points per wavenumber
cm-1[7]
Atmospheric gas profile AFGL US Standard [8]
Surface albedo 0.2 (broadband)
Aerosol Shettle rural model [9]
Clouds None
Water vapour column 0 to 95 mm in steps of 5
mm
Zenith angle 0° for PV material
simulation (section 3) 42° to 90° in steps of 4°
for climate simulation
(section 4)
Figure 1:Annual average clear-sky daytime spectrum at various latitudes for 10 mm water vapour column. The arrows indicate regions of water vapour absorption.
2.2 Spectral response and short-circuit current
[image:2.595.314.524.412.691.2]world-leading devices as reported by M.A. Green and colleagues in the 2013 and 2014 versions of the Solar Cell Efficiency Tables [10, 11, 12 and references therein]. Selection of materials has been made based on the availability of absolute external quantum efficiency curves for each semiconductor which is why the 2013 world-leading cell has been used in some cases such as CIGS. A wide bandgap range for semiconductors used in single-junction cells was also sought.
Table II:Semiconductors selected for this study
Material Efficiency
% (STC) (V)
FF %
Bandgap (eV)
a-Si [12] 10.1 0.89 77.0 1.73
Perovskite [12] 17.9 1.11 73.6 1.57
CdTe [10] 18.3 0.86 77.0 1.50
CIGS [11] 19.8 0.71 79.2 1.20
c-Si [12] 25.6 0.74 82.7 1.12
CIGSS [12] 20.9 0.69 76.4 1.03
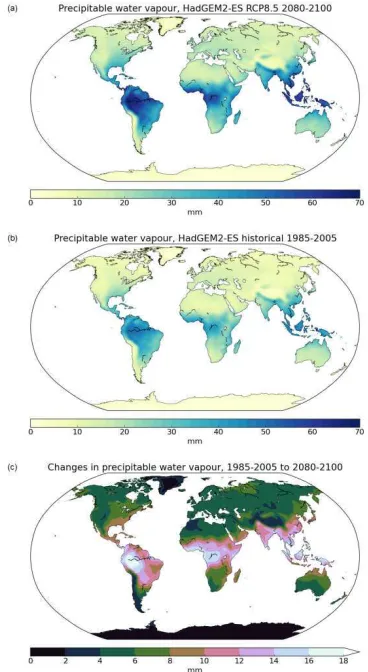
The external quantum efficiency describes the proportion of photons of a particular wavelength that are converted to current by a semiconductor. decays very quickly to zero above the semiconductor bandgap. The quantum efficiencies of each cell are shown in fig. 2. From this the spectral response (units of A W-1) can be determined from
( ) = ( ) (1)
where is approximately 1240 W A nm-1and is
wavelength in nm. Spectral response is an increasing function of wavelength for constant (fig. 3). As such longer wavelengths with energy just higher than the bandgap contribute most to the short circuit current. From the spectral response the total short-circuit current
can be obtained:
= ( ) ( ) (2)
where is the solar spectrum calculated in section 2.1. and the limits of the integration are the shortest and longest solar wavelengths in nm transmitted by the atmosphere.
The water vapour absorption bands and how they relate to each semiconductor bandgap are shown in Figure 4 for water vapour column depths of 0, 10 and 55 mm and a solar zenith angle of 0°. Water vapour absorption is non-linear as can be seen with the large increase in absorption for 0 to 10 mm but small increase from 10 to 55 mm. The large, wide water vapour absorption band near 1140 nm could affect the short-circuit current generated by CIGSS and c-Si cells as the spectral response is high for these cells in this region. Similarly, the absorption band around 940 nm will diminish for CIGS, c-Si and CIGSS.
3 RESPONSE OF EACH CELL TO DIFFERENT
ATMOSPHERIC WATER VAPOUR LOADS
The power output of a solar cell is
= . (3)
changes with the logarithm of irradiance, so assuming the irradiance is sufficiently high it has been assumed to remain constant at the values in table II under small variations in total irradiance. is given as in eq. (2). For cells with a similar STC efficiency, a high is offset by
[image:3.595.67.284.204.292.2]a low .
Figure 2:External quantum efficiency curves ( )for the semiconductors investigated
[image:3.595.328.509.320.422.2]Figure 3: Spectral response curves for the semiconductors investigated
Figure 4:Relative transmission spectrum compared to dry atmosphere (0 mm water vapour) for increasing water vapour concentrations and bandgaps for the six materials considered. Photons to the left of each red dashed line are energetic enough to create an electron-hole pair.
For each semiconductor, the PV output was
calculated under each spectrum for water vapour increasing in steps of 5 mm (fig. 5). The solar zenith angle was set to 0° and results normalised to an atmosphere with no water vapour. As the bandgap energy decreases, the PV output power with increasing water vapour also decreases. Due to the location of spectral absorption bands of water vapour and the shape of the solar spectrum, the decline in power output with
decreasing bandgap is non-linear. The three
performance with increasing water vapour than the other three semiconductors. The difference in relative PV output between CIGS and CIGSS is smaller than the difference in relative output between CIGS and CdTe. This suggests that the greater irradiance total for the absorption band near 940 nm versus 1140 nm (fig. 1) is more important than the greater spectral response for solar cells at 1140 nm over 940 nm.
Figure 5: The changes in relative PV output for the six semiconductor materials with increasing atmospheric water vapour column
4 GLOBAL CHANGES TO CLEAR SKY SOLAR PV
OUTPUT
The monthly mean atmospheric water vapour loadings are obtained from the UK Met Office HadGEM2-ES climate model under the RCP8.5 future climate change scenario for the 2080-2100 timeframe, and for the historical climate run for 1985-2005, which is assumed to
represent present conditions. The Representative
Concentration Pathways (RCPs) are the group of four narratives that describe anthropogenic climate change
throughout the 21st Century, used in the
Intergovernmental Panel on Climate Change Fifth Assessment Report [13]. RCP8.5 describes the highest radiative forcing and greatest global median temperature rise of the four pathways with socioeconomic narrative of
“business-as-usual”. For current climatology the
reference period of 1985-2005 from the RCP historical experiment is used. The resolution of the model is 1.875° latitude × 1.25° longitude.
PV power outputs for c-Si and a-Si are calculated using eqns. (1-3) with spectral irradiance generated from the radiative transfer simulation run at 13 zenith angles from 42° to 90° in steps of 4° and 20 water vapour amounts from 0 to 95 mm in steps of 5 mm. This creates a 2D lookup table of power outputs for both c-Si and a-Si. For each climate model grid cell, and each month of the 20 year RCP8.5 and historical datasets, the power outputs are found by bi-linear interpolation based on zenith angle and water vapour amount, and averaged over the 20 year period. The monthly mean daytime solar zenith angle is calculated for each month at each latitude by averaging the minutely solar zenith angle for each daytime (zenith less than 90°) minute of the month. Due to the inclusion of the full day (sunrise to sunset) of zenith angles in the averaging the monthly daytime mean is never less than 42° even at low latitudes.
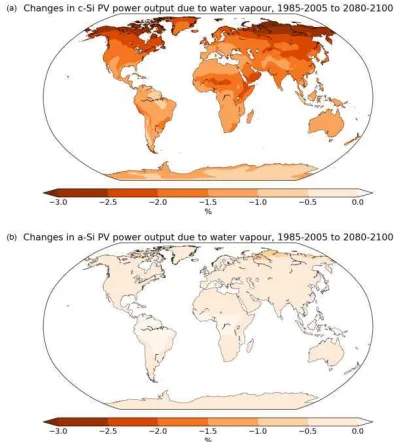
The historical (1985-2005) and future (2080-2100) mean atmospheric water vapour and the differences between these are shown in fig. 6. The expected global changes in PV power output for c-Si and a-Si are given in fig. 7. These changes are based on the calculated values of global irradiance, assuming a horizontal panel tilt. The
increase in atmospheric water vapour could reduce the clear-sky PV power output by up to 3% for c-Si in some, predominantly boreal, regions. While these areas are not optimal for PV installation, the change in c-Si output is negative everywhere and in excess of 1.5% for many parts of the world where PV is important. For a-Si, the global decline in PV performance is lower, typically less than a 0.5% decrease but not more than 1%. In some areas such as Africa and the Amazon region the change is even slightly positive. A small bump in the curve for a-Si shown in fig. 5 suggests that this is possible if water vapour increases from around 40 mm to 55 mm; figs. 6a-c show this 6a-could have been the 6a-case.
Figure 6: (a)2080-2100 water vapour column depth;(b)
1985-2005 water vapour column depth; (c) Difference between (a) and (b)
The areas with the greatest decrease in PV power output for c-Si in fig. 7a do not necessarily correspond with those of the greatest increase in water vapour in fig. 6c. This is because of the non-linear change in PV power output with an increase in water vapour as shown in fig. 5. In the boreal regions, water vapour increases by around 6 mm from a very low level (fig. 6b), which according to the c-Si curve in fig. 5 can account for a PV power loss of 2-3%.
5 CONCLUSIONS AND FURTHER WORK
[image:4.595.322.506.240.576.2]atmospheric water vapour. This is due a reduction in because of a lower atmospheric transmittance in areas where spectral response of PV cells is high. The general result is that the higher the bandgap of a semiconductor material, the less it is affected by an increase in atmospheric water vapour.
Figure 7: (a)PV power output changes over the period 2080-2010 compared to 1985-2005 for c-Si solar cells.
(b)Same as (a), for a-Si.
The decline in performance over the timeframe of 1985-2100 is up to 3% for c-Si. Although this is within the error bounds of high quality pyranometers, as resource prediction becomes more sophisticated errors of this magnitude will gradually become more influential.
The selection of a PV material with a higher energy bandgap such as a-Si leads to a lower decrease in relative PV output. It is important to note that the baseline efficiency of a-Si is much lower than c-Si and under present device efficiencies c-Si is still the optimal single-junction semiconductor material. Perovskites could be a promising future material if the problem of rapid degradation can be solved [14] and baseline efficiencies start to approach those of c-Si. CdTe is an established technology with a bandgap above the 1.4 eV threshold. As technology develops over the course of the 21st Century it is likely that efficiencies of all semiconductor materials will continue to improve and approach the Shockley-Queisser ideal limit.
Previous studies have shown that higher ambient temperatures expected under a future climate can negatively affect PV output power [2, 4] through the well-known decrease of approximately 0.45% in relative efficiency (for c-Si) for each °C rise in cell temperature [15]. This has not been investigated in this study. Cell temperature affects , , and spectral response. While the decline in and has been investigated for most established semiconductors, the details of how spectral response changes with temperature for the particular cells investigated is not available. As mentioned in section 3, also has a logarithmic dependence on irradiance which has not been included. Therefore it is possible that the reported changes due to enhanced water vapour
absorption are already conservative, and the inclusion of temperature would increase this effect.
Finally, this study only considers clear-sky global radiation under the influence of water vapour. Other clear-sky attenuators for solar radiation include aerosols, ozone and NO2, each with their own particular spectral
absorption characteristics. Clouds add an extra level of complexity.
6 REFERENCES
[1] International Energy Agency, Technology Roadmap Solar Photovoltaic Energy. 2014.
[2] Crook, J.A., et al.,Climate change impacts on future photovoltaic and concentrated solar power energy output.Energy & Environmental Science, 2011.4(9): p. 3101-3109.
[3] Burnett, D., E. Barbour, and G.P. Harrison, The UK solar energy resource and the impact of climate change.
Renewable Energy, 2014.71: p. 333-343.
[4] Wild, M., et al.,Projections of long-term changes in solar radiation based on CMIP5 climate models and their influence on energy yields of photovoltaic systems.
Solar Energy, 2015.116: p. 12-24.
[5] Stamnes, K., et al.,Numerically stable algorithm for discrete-ordinate-method radiative transfer in multiple scattering and emitting layered media. Applied Optics, 1988.27(12): p. 2502-2509.
[6] Mayer, B. and A. Kylling, Technical note: The libRadtran software package for radiative transfer calculations - description and examples of use. Atmos. Chem. Phys., 2005.5(7): p. 1855-1877.
[7] Gasteiger, J., et al., Representative wavelengths absorption parameterization applied to satellite channels and spectral bands.Journal of Quantitative Spectroscopy and Radiative Transfer, 2014.148: p. 99-115.
[8] Anderson, G.P., et al.,AFGL Atmospheric Constituent Profiles. 1986.
[9] Shettle, E., Models of aerosols, clouds and
precipitation for atmospheric propagation studies, in
Atmospheric propagation in the UV, visible, IR and mm-region and related system aspects. 1989, AGARD Conference Proceedings.
[10] Green, M.A., et al., Solar cell efficiency tables (version 41). Progress in Photovoltaics: Research and Applications, 2013.21(1): p. 1-11.
[11] Green, M.A., et al., Solar cell efficiency tables (version 43). Progress in Photovoltaics: Research and Applications, 2014.22(1): p. 1-9.
[12] Green, M.A., et al., Solar cell efficiency tables (version 44). Progress in Photovoltaics: Research and Applications, 2014.22(7): p. 701-710.
[13] IPCC,Climate Change 2013: The Physical Science Basis. Contribution of Working Group I to the Fifth Assessment Report of the Intergovernmental Panel on Climate Change, T.F. Stocker, et al., Editors. 2013: Cambridge, United Kingdom and New York, NY, USA. [14] Niu, G., X. Guo, and L. Wang, Review of recent progress in chemical stability of perovskite solar cells.
Journal of Materials Chemistry A, 2015.3(17): p. 8970-8980.
[15] Skoplaki, E. and J.A. Palyvos,On the temperature dependence of photovoltaic module electrical performance: A review of efficiency/power correlations.
[image:5.595.71.268.168.389.2]