University of Southern Queensland
Faculty of Engineering and Surveying
Testing and analysis of fibre composite beams
in a bridge structure
A dissertation submitted by
Christopher Ross Green
In fulfilment of the requirements of
Courses ENG411 and 4112 Research Project
towards the degree of
Bachelor of Engineering (Civil)
Abstract
The aims of this project were to investigate the behaviour of fibre composite beams under various load types (including dynamic loading) in a composite bridge structure, to determine whether simplified methods can be used to analyse the composite structure accurately, and to investigate issues involved in increasing the span of the bridge to full scale.
The testing was undertaken by the Centre of Excellence in Engineered Fibre Composites (CEEFC), in conjunction with the Queensland Government Department of Main Roads (DMR) on an approximately half-scale fibre composite bridge constructed by Loklite Pty Ltd in conjunction with the CEEFC.
Analysis of field results from this testing, and finite element analysis (FEA) using the Strand7 FEA software package was undertaken. Comparisons of results from both types of analysis were undertaken, and conclusions made from these comparisons were used to resolve the aims of the project.
University of Southern Queensland
Faculty of Engineering and Surveying
ENG411 & ENG4112 Research Project
Limitations of Use
The Council of the University of Southern Queensland, its Faculty of Engineering and Surveying, and the staff of the University of Southern Queensland, do not accept any responsibility for the truth, accuracy or completeness of material contained within or associated with this dissertation.
Persons using all of any part of this material do so at their own risk, and not at the risk of the Council of the University of Southern Queensland, its Faculty of Engineering and Surveying or the staff of the University of Southern Queensland.
This dissertation reports an educational exercise and has no purpose or validity beyond this exercise. The sole purpose of the course pair entitled “Research Project” is to contribute to the overall education within the student’s chosen degree program. This document, the associated hardware, software, drawings and other material set out in the associated appendices should not be used for any other purpose: if they are so used, it is entirely at the risk of the user.
Prof Frank Bullen
Dean
Certification
I certify that the ideas, designs and experimental work, results, analyses and conclusions set out in this dissertation are entirely my own effort, except where otherwise indicated and acknowledged.
I further certify that the work is original and has not been previously submitted for assessment in any other course or institution, except where specifically stated.
Christopher Ross Green
Student Number: 0050025553
Signature
Acknowledgements
I would like to acknowledge all those who were involved in the field testing of the bridge, particularly:
Wayne Crowell, for his support with the instrumentation; Tarek Omar, for data acquisition and formatting;
Dean Beliveau, for his assistance; and
Supervisors Assoc Prof Thiru Aravinthan and Assoc Prof Karu Karunasena for their academic assistance in the undertaking of this project.
Table of Contents
Abstract ... i
Acknowledgements... iv
Table of Contents... v
List of Figures... viii
List of Tables ... x
1. INTRODUCTION ... 1
1.1. Background ... 1
1.1.1. DMR and CEEFC ... 1
1.2. Design and Analysis ... 2
1.3. Project Aims... 2
1.4. Structure of Dissertation ... 3
1.5. Summary... 5
2. LITERATURE REVIEW... 6
2.1. Introduction... 6
2.2. Materials ... 6
2.3. Testing and Instrumentation ... 8
2.4. Analysis ... 9
2.5. Further Study... 11
2.6. Summary... 12
3. METHODOLOGY... 13
3.1. Test Bridge... 13
3.2. Testing Plan... 14
3.3. Displacement Measurement... 15
3.4. Strain Measurement... 17
3.5. Loading ... 18
3.5.1. Initial Trial... 18
3.5.2. Truck Loads... 18
3.5.3. Run Pattern... 20
3.6. Analysis ... 21
3.7. Summary... 21
4. FIELD TEST RESULTS... 22
4.1. Introduction... 22
4.2. Preliminary Testing ... 22
4.3. Deflections ... 24
4.3.1. Dynamic Deflections ... 24
4.3.1.1. Mid-Span Girder Deflections ... 24
4.3.1.2. Differential Girder-Deck Deflection ... 27
4.3.1.3. Differential Deck Deflection ... 30
4.3.1.4. Deflection near Abutments... 32
4.4. Strains ... 41
4.4.1. Dynamic Loading Strains... 41
4.4.1.1. Girder Tensile Strains... 42
4.4.1.2. Girder Compressive Strains... 44
4.4.1.3. Deck Strains... 46
4.4.1.4. Combination Strains... 50
4.4.1.5. Shear Strains ... 52
4.4.2. Static Loading Strains ... 56
4.4.2.1. Girder Tensile Strains... 56
4.4.2.2. Girder Compressive Strains... 57
4.4.2.3. Deck Strains... 58
4.4.2.4. Combination Strains... 60
4.4.2.5. Shear Strains ... 61
4.5. Summary... 63
5. FINITE ELEMENT ANALYSIS ... 65
5.1. Introduction... 65
5.2. Development of Grillage Model ... 65
5.2.1. Girder Design ... 65
5.2.2. Diaphragm Design ... 65
5.2.3. Freedom Conditions and End Restraints... 66
5.2.4. Loading ... 66
5.3. Analysis of Grillage Model... 69
5.3.1. Centre Run and Side Run Analysis ... 69
5.3.2. Diaphragm Modification... 72
5.4. Addition of Deck to Grillage Model ... 73
5.4.1. Deck Modelled as Laminate (Approach 1) ... 73
5.4.2. Deck Modelled using Experimental Data (Approach 2)... 74
5.5. Finite Element Analysis with Deck Added... 74
5.6. Extension of Bridge to Full-size... 76
5.6.1. Development of Model ... 77
5.6.2. Full-size Model Analysis ... 78
5.7. Summary... 79
6. ANALYSIS COMPARISONS ... 80
6.1. Introduction... 80
6.2. Deflections ... 80
6.2.1. Mid-span Deflections... 80
6.2.2. Deflections near Abutments ... 82
6.2.3. Differential Deflections... 83
6.2.4. Load-Deflection Comparisons ... 83
6.3. Strains ... 84
6.3.1. Girder Strains ... 84
6.3.2. Deck Strains ... 84
6.3.3. Shear Strains... 85
6.4. Summary... 85
7. CONCLUSIONS AND RECOMMENDATIONS ... 86
7.1. Introduction... 86
7.2. Achievement of Objectives... 86
7.3. Conclusions ... 88
7.4. Recommendations ... 90
References ... 92
APPENDIX A - Project Specification ... 95
APPENDIX B - Test Bridge Site and Specifications ... 98
I. Test Bridge Site... 99
II. Test Bridge Specifications ... 99
APPENDIX C – Risk Assessment...102
APPENDIX D – Field Testing Data Worksheets and Strand7 FEA files...105
I. Field Testing Data Worksheets...106
List of Figures
Figure 2-1: Australia's first fibre composite bridge (Van Erp et al., 2002) ... 7
Figure 2-2: Elevation view of the Tama County Bridge (Dunn et al., 2005) ... 8
Figure 2-3: Placement of strain gauges (Dunn et al., 2005)... 9
Figure 3-1: Instrumentation Positioning (Omar, T., 2007) ... 14
Figure 3-2: System 5000 setup ... 15
Figure 3-3: String pot positioning at girder mid-span ... 16
Figure 3-4: LVDT positioning for differential deck displacement... 16
Figure 3-5: Delta rosette strain gauge configuration ... 17
Figure 3-6: Phase 1 Loading ... 19
Figure 3-7: Phase 2 Loading ... 19
Figure 4-1: Initial truck trial... 23
Figure 4-2: Girder 1 Mid-span Deflection ... 25
Figure 4-3: Girder 2 Mid-span Deflection ... 26
Figure 4-4: Girder 3 Mid-span Deflection ... 26
Figure 4-5: Placement of String Pots 6, 7 and 8... 27
Figure 4-6: Differential Girder-Deck Deflection – Run 1 ... 28
Figure 4-7: Differential Girder-Deck Deflection - Run 8 ... 28
Figure 4-8: Differential Girder-Deck Deflection - Run 5 ... 29
Figure 4-9: Differential Girder-Deck Deflection - Run 6 ... 29
Figure 4-10: Differential Deck Deflections – Critical Runs ... 30
Figure 4-11: Maximum Differential Deck Displacement ... 31
Figure 4-12: Deflection near Abutment at USQ end of Bridge ... 32
Figure 4-13: Load-Deflection Comparison - Run 1 ... 33
Figure 4-14: Load-Deflection Comparison - Run 5 ... 34
Figure 4-15: Load-Deflection Comparison - Run 6 ... 34
Figure 4-16: Load-Deflection Comparison - Run 8 ... 35
Figure 4-17: Static Load Mid-span Deflection... 36
Figure 4-18: Bridge Cross Section under Central Runs... 37
Figure 4-19: Differential Girder-Deck Deflection... 38
Figure 4-20: Differential Deck Deflection - Run 9 ... 39
Figure 4-21: Deflection near Abutment at USQ end of Bridge ... 40
Figure 4-22: Tensile Strain - Girder 1... 42
Figure 4-23: Tensile Strain - Girder 2... 42
Figure 4-24: Tensile Strain - Girder 3... 43
Figure 4-25: Strain Distribution across bridge at maximum deflection ... 44
Figure 4-26: Compressive Strain - Girder 1... 45
Figure 4-27: Compressive Strain - Girder 2... 45
Figure 4-28: Compressive Strain - Girder 3... 46
Figure 4-29: Longitudinal Strain on Deck near Girder 1... 47
Figure 4-30: Longitudinal Strain on Deck near Girder 2... 47
Figure 4-31: Longitudinal Strain on Deck near Girder 3... 48
Figure 4-32: Transverse Deck Strain between girders 1 and 2 ... 49
Figure 4-33: Transverse Strain on Deck between girders 2 and 3... 49
Figure 4-34: Strain through Girder 1 to Deck ... 50
Figure 4-35: Strain through Girder 2 to Deck ... 51
Figure 4-37: Delta Rosette Strains - Run 1 at USQ End... 53
Figure 4-38: Delta Rosette Strains – Run 1 at Handley St End... 53
Figure 4-39: Delta Rosette Strains - Run 5 at USQ End... 54
Figure 4-40: Delta Rosette Strains- Run 6 at USQ End... 54
Figure 4-41: Delta Rosette Strains - Run 8 at USQ End... 55
Figure 4-42: Static Loading Girder Tensile Strains... 56
Figure 4-43: Static Loading Girder Compressive Strains ... 57
Figure 4-44: Static Loading Longitudinal Deck Strains ... 58
Figure 4-45; Static Loading Transverse Deck Strains ... 59
Figure 4-46: Strain through Girder 1 to Deck ... 60
Figure 4-47: Strain through Girder 2 to Deck ... 60
Figure 4-48: Strain through Girder 3 to Deck ... 61
Figure 4-49: Delta Rosette Strains – Run 9 at USQ End ... 62
Figure 4-50: Delta Rosette Strains – Run 9 at Handley St End... 62
Figure 5-1: Initial Strand7 Model ... 66
Figure 5-2: Addition of Loading for Central Runs ... 67
Figure 5-3: Addition of Loading for Side Runs ... 68
Figure 5-4: Maximum Deflection of Grillage Model - Centre Run ... 70
Figure 5-5: Maximum Deflection of Grillage Model - Side Run... 70
Figure 5-6: Predicted Girder Deflections - Centre Run ... 71
Figure 5-7: Predicted Girder Deflections - Side Run ... 71
Figure 5-8: Configuration of Deck Panels for FEA... 73
Figure 5-9: Maximum Deflection of Grillage Model with Deck 1 added - Centre Run... 75
Figure 5-10: Maximum Deflection of Grillage Model with Deck 1 added - Side Run... 76
Figure 5-11: Full-size Strand7 Model... 77
List of Tables
Table 3-1: Run Pattern ... 20
Table 4-1: Initial truck trial measurements and formal test predictions ... 23
Table 4-2: Critical Run and Maximum Mid-span Deflection of girders ... 27
Table 4-3: Experimental Static-Dynamic Differential of Bridge ... 37
Table 4-4: Maximum Girder Tensile Strains ... 43
Table 4-5: Maximum Girder Compressive Strains... 46
Table 4-6: Maximum Deck Longitudinal Compressive Strains... 48
Table 4-7: Maximum Deck Transverse Strains... 50
Table 4-8: Maximum Delta Rosette Measurements and Calculated Shear Strain Values (Critical Runs)... 52
Table 4-9: Maximum Delta Rosette Measurements and Calculated Shear Strain Values (Dynamic and Static Central Runs)... 61
Table 5-1: Strand7 FEA Grillage Model Results ... 69
Table 5-2: Effect of Diaphragm Modification on Maximum Deflections - Strand7 FEA Grillage Model ... 72
Table 5-3: Strand7 FEA results with Deck added to Model ... 75
Table 5-4: Predicted and FEA Deflections for Full-size Bridge ... 78
Table 6-1: Maximum mid-span Deflections (Field Testing) ... 80
Table 6-2: Maximum mid-span Deflections (FEA)... 81
Table 6-3: Comparison of Mid-span Deflections ... 81
1.
INTRODUCTION
1.1.
Background
The use of fibre composites in the construction and transport industries is relatively new compared to their use in fields such as the aerospace, military and marine industries. Consequently, there has not been a great deal of research in this area, particularly in replacement of existing members in timber and concrete bridges.
This project will attempt to demonstrate that the replacement of beams in timber and concrete bridges by fibre composite elements is viable, both structurally and economically. The project will also attempt to determine whether the field testing results can be scaled up to the full design size from the prototype bridge being tested.
1.1.1. DMR and CEEFC
1.2.
Design and Analysis
As part of the project requires development of a testing plan, various papers describing bridge field testing have been reviewed to provide appropriate instrumentation and placement for this specific project. The designs of the beams and deck units have not been studied for this project, as these members have been prefabricated prior to testing.
The use of transverse stiffeners (diaphragms) will be studied to determine whether the analysis of the composite structure can be simplified using a grillage type system. Analysis using a simple grillage system is much quicker and simpler than developing a complex three-dimensional model for use in finite element analysis, but may not take some aspects of deck or beam behaviour into account. Comparison of results from both types of analysis may show that the simplified grillage system may be more useful in predicting deflections, due to the closeness of results and the time saving factor.
Investigation into the need for diaphragms will also be undertaken. This theoretical analysis will compare deflections calculated using different sized diaphragms with those calculated with no diaphragms present. These comparisons should give a good indication of whether diaphragms are necessary in the construction of fibre composite bridges.
1.3.
Project Aims
This project aims to: 1. investigate the behaviour of fibre composite beams under dynamic and static loading in a composite structure;
2. determine whether simplified methods can be used to analyse the composite structure accurately; and
To achieve these aims, a number of objectives had to be met.
1. Research the background information on previous field testing and instrument placement of bridge structures.
2. Develop a testing plan including placement of instrumentation on the beams and deck of the bridge, and static and live loading of the bridge.
3. Collect data from field testing of the bridge, as appropriate.
4. Analyse field data for use by Department of Main Roads, and compare field data with analysis using appropriate finite element software
package (Strand7), taking deck effects into account.
5. Determine the viability of using simplified analysis methods (grillage analysis) to predict deflections accurately.
6. Investigate the issues involved in increasing the span of the bridge to full scale.
7. Given time, conduct a cost-benefit analysis into the viability of replacing hardwood timber bridge beams with fibre-reinforced polymer beams.
1.4.
Structure of Dissertation
The investigation of fibre composite beams in bridge structures will involve reviews of related studies, field testing of a small-scale bridge, analysis of field test data, finite element modelling and analysis, and comparisons between the field data analysis and finite element analysis. This section outlines the structure of the dissertation.
instruments, the loading and run patterns to be used, the field data o be analysed, and the finite element model analysis.
Chapter 4 involves the analysis and discussion of the field testing data collected. This includes both dynamic and static loading conditions, mid-span girder deflections and strains, differential girder-deck and differential deck panel deflections, girder deflection near abutments, longitudinal and transverse deck strains, and girder shear strains.
Chapter 5 involves the development and analysis of a finite element model of the bridge, starting with a basic grillage model, then modifying the model, and adding deck panels to the model to find out how much influence the deck has on deflections. This chapter will also investigate the viability of using predicted deflections from the finite element analysis in predicting deflection of the full-scale bridge.
Chapter 6 will compare the analyses from Chapters 4 and 5, and the results of these comparisons will be discussed.
Chapter 7 will provide a summary of the project, conclusions arrived at from the undertaking of the project, and areas for future research will be highlighted. Recommendations will be made on the viability of using finite element modelling to predict deflections and influence the production of appropriate bridge elements for use in the construction of the full-scale bridge.
1.5.
Summary
2.
LITERATURE REVIEW
2.1.
Introduction
A comprehensive review of the available literature relating to the project was undertaken, with emphasis placed on specific areas as outlined below.
2.2.
Materials
There are several main reasons for the use of fibre composite materials in the transport industry, particularly in bridge construction. As Holloway and Head (2001) suggest, the civil infrastructure market is controlled by existing materials with well known properties that can be easily manufactured. The challenge for manufacturers of fibre composite materials is to overcome the lack of performance data and cost concerns to show that production will be more environmentally sustainable than materials such as timber and steel, making fibre composites more economically viable for whole-of-life duration.
Ayers and Van Erp (2002) stated that the lack of accepted design standards for composite materials inhibits the usage of these materials into the mainstream construction industry. A search of both the Building Code of Australia (BCA 2007) and Standards Australia show that this is still the case, with the only design standard available being for the tensile properties of fibre reinforced polymers (FRPs) (AS 1145.4, AS 1145.5, 2001).
The original FRP bridge was designed by USQ’s Fibre Composites Design and Development team (FCDD, has since become the CEEFC) and installed at a quarry at Wellcamp, outside Toowoomba, in January 2002. This bridge was developed as an hybrid concrete-composite section (Van Erp et al. 2002), was being frequently monitored, and was still performing above expectation, with approximately 150 trucks crossing per day (Innovation Case Study No 5, CRC for Construction Innovation). In September 2002, the prototype design was awarded a “Highly Commended” by the Institute of Engineers, and in 2005 received a Nova Award nomination which recognises construction innovation.
Figure 2-1: Australia's first fibre composite bridge (Van Erp et al., 2002)
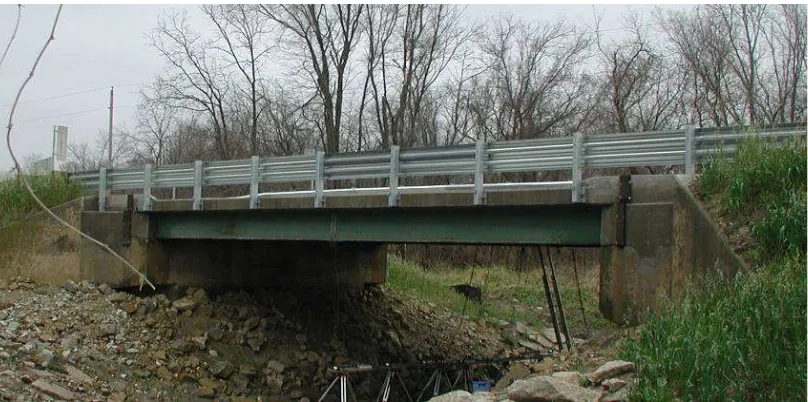
Dunn et al. (2005) reported on the construction of the first steel-free bridge deck in the United States, in Tama County, Iowa. The use of FRPs in this bridge was predominantly to reduce the effects of corrosion of reinforcing steel by de-icing salts, which causes the surrounding concrete to deteriorate. The new deck will have increased durability, leading to lower maintenance costs, and should have lower whole-of-life costs than traditional concrete decking.
[image:19.595.115.519.214.415.2]
Figure 2-2: Elevation view of the Tama County Bridge (Dunn et al., 2005)
In April 2005, installation of fibre composite girders on the Heifer Creek No 5 Bridge, an existing timber bridge, was completed. These girders were a softwood-FRP hybrid, and had been comprehensively tested (Fibre Composite Projects).
2.3.
Testing and Instrumentation
The natural frequency and damping ratio of the bridge is dependent on its length, as shown by Moses et al. (1992) and Samman et al. (2001). They are also dependent on the stiffness of the material (Young’s modulus).
However, Watkins et al. (2001) embedded fibre-optic sensors during production to measure temperature, flexure strain and shear strain. This technology is still new, and fairly expensive, so could not be justified for this project.
Figure 2-3: Placement of strain gauges (Dunn et al., 2005)
Positioning of string pot displacement gauges will be at mid-span, under beams and deck, similar to those in testing carried out by Dunn et al. (2005) and Konda (2003).
Live loading carried out in projects by Dunn et al. (2005), Konda (2003), and Van Erp et al. (2002) was noted, with some differences being truck type, size and speed. These may have been due to site specific reasons. Field testing for this project will be a combination of testing from these previous studies.
Advantages: quick, standardised, easier to model.
Disadvantages: failure to deal with certain aspects of bridge behaviour, does not take into account construction method, generally conservative.
Tan et al. (1998) also concluded that grillage analysis was the most suitable model for bridge analysis due to its simplicity, accuracy and speed.
There is also debate over whether to use linear or non-linear finite element analysis when analysing composite structures. Lowe (1999), comments that linear analysis may produce overly conservative estimates, since it does not take plastic behaviour and global failure mechanisms into account. With the increase in computer size and power over the last few years (Jenkins, 2004), the additional time taken to run a non-linear analysis has been reduced, so this is essentially a non-issue in that non-linear analysis will tend to give the most accurate results.
Konda (2003) found that using a simply supported grillage model gave similar predictions of deflection values to those calculated theoretically, both of which overestimated when compared to field test results. As previously stated, grillage analysis tends to be conservative in predicting deflections, which could explain these results.
2.5.
Further Study
As shown by the Australian Government publication Project Number PN05.2023 (2006), there is a great deal of interest in determining the viability of using hybrid and/or full FRP beams as replacement for existing hardwood timber beams in bridge construction. It is not only physical testing that must be undertaken, but also cost-benefit analysis on a whole-of-life scale that will determine future viability in the bridge construction industry.
The first Australian Standard for bridge design was published in 2004 (AS 51002004), but only covers the specific application of concrete, steel, and composite steel/concrete construction. Further research should be undertaken to include FRP material properties and standards.
As mentioned previously, the dynamic response of the bridge to heavy vehicles is another area where further study will improve the understanding of the complex interaction, with a large number of variables involved in the analysis of the dynamic response.
A “worldwide” survey of universities with FRP courses incorporated into their civil/structural engineering programmes (postgraduate and/or undergraduate) was undertaken by Mirmiran et al. (2003). This survey, however, neglected to include Australia, which appears to be quite an oversight as a number of Australian universities offer courses in FRPs. As this is not in the scope of the project, it could not really be taken further here, but could possibly be the starting point for another project.
2.6.
Summary
The literature review highlighted the lack of standards and specifications in the manufacture of fibre composite products used in construction of structures, specifically bridges. This appears to a real issue, as the availability of such standards could increase the production of fibre composite products, which would decrease the production costs to the point where it should be economically viable to not only use these products for rehabilitation of existing bridges, but eventually replace timber, concrete and steel as the primary materials for construction of new bridges.
As far as field testing was concerned, it appears that the general method of testing remains consistent. There are few variables, some of which are: truck speed, truck size, number of instruments, types of instruments used (e.g. external versus internal strain gauges), and size of the bridge.
3.
METHODOLOGY
3.1.
Test Bridge
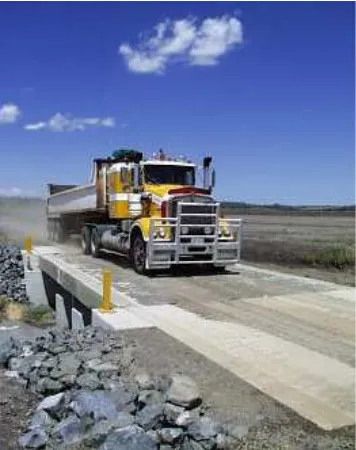
The half-scale test bridge was constructed at the northwest end of Handley Street on USQ grounds in Toowoomba, and was constructed as a girder-deck composite bridge. It has a span of ten metres and is five metres wide. There are five 400 mm square girders bolted to concrete abutments, with 250 mm by 400 mm transverse stiffeners (diaphragms) bolted to the girders at 2500 mm intervals.
3.2.
Testing Plan
Instrumentation selection was determined by what was available for use from the CEEFC and the Faculty of Engineering.
Figure 3-1: Instrumentation Positioning (Omar, T., 2007)
Figure 3-2: System 5000 setup
3.3.
Displacement Measurement
Five UniMeasure PA-15string pot displacement gauges measured deflections at mid-span of the beams, and three PA-15 string pot displacement gauges were positioned to measure differential displacement between the deck panel and girder 2 (G2). The positioning of the three string pots to measure the differential girder-deck displacement can be seen in Figure 4-5.
Figure 3-3: String pot positioning at girder mid-span
3.4.
Strain Measurement
Kyowa KFG-20-120-C1-11L1M2R strain gauges measured flexural (tensile and compressive) strain and shear strain (delta rosette configuration) at selected positions on the beams and deck. Flexural strain gauges were positioned on the bottom of all girders (G1-5), 50 mm below the top of girders 1,2 and 3 (G1-3), and longitudinally on the deck at mid-span near girders 1,2 and 3 (G1-3). Transverse strain gauges were positioned on the deck near mid-span, and between Girders 1 and 2 (G1-2), and Girders 2 and 3 (G2-3).
Delta rosette configured strain gauges (-45°, 0°, +45°) were positioned at either end of Girder 1 (G1), as close as practicable to the abutments, to develop shear strain values as close as possible to maximum based on the recorded strains.
3.5.
Loading
3.5.1. Initial Trial
An initial trial run was conducted using a small truck with an estimated 30 kN load on the rear axle. This run was used to get a general idea of the deflections and strains that could be expected in the formal testing. There were three string pots and two strain gauges installed on the bridge to measure deflections on girders 1, 2 and 3, and strains at the top and bottom of girder 1 to measure tensile and compressive girder strains.
Maximum mid-span deflections and maximum tensile and compressive strains were found from the data collected, and approximate values predicted for a rear axle load of 200 kN. The predicted values could then be compared with the measured values when the formal testing was completed and data available.
3.5.2. Truck Loads
Figure 3-6: Phase 1 Loading
3.5.3. Run Pattern
The run pattern was determined by the need to load individual girders on the outside edges of the bridge (G1, G5) and centre girder (G3) as much as possible to create maximum deflections of these girders. This load pattern is indicative of a bridge in everyday use. Girder runs were marked on the bridge with whiter paint, and between-girder runs marked with yellow paint, as can be seen in Figures 9 and 10 above.
Increasing the speed of the truck to approximately 40 km/h for centre runs was used to see if there was any significant difference in displacement between crawl speed and the higher speed. Higher speed runs were not used on the outside edge girders due to safety reasons.
Table 3-1: Run Pattern
Run Ref # Run Description
0 Initial runs
1 Truck RHS over G1
2 Truck RHS at the centreline between G1 and G2
3 Truck RHS over G2
4 Truck RHS at the centreline between G2 and G3
5 Truck down the centre of the bridge
6 Truck speeds down the centre of the bridge (~40 km/h)
7 Truck RHS over G3 (Not used)
8 Truck LHS over G5
3.6.
Analysis
Both field data analysis and finite element analysis were undertaken and results compared to determine the viability of using a simple grillage model to accurately predict deflections and strains in future construction of bridges. The field data analysis is covered in Chapter 4 and the finite element analysis is covered in Chapter 5, with analysis comparisons being discussed in Chapter 6.
3.7.
Summary
4.
FIELD TEST RESULTS
4.1.
Introduction
Once field testing was completed, recorded measurements were analysed using Microsoft Excel to determine: maximum deflection, deflection at abutments, maximum tensile, compressive and biaxial shear strains in the beams, maximum deflection of the deck, differential displacement between deck and girder, and any differential deflection between adjacent deck units.
From the mid-span deflection results, critical runs were found by using the maximum deflections in each of the girders as the determining factor.
Biaxial shear strains were calculated using the formula for strain (ε) along a line at an angle θ to the x-axis direction:
ε (θ) = εxcos2θ + εysin2θ + γxysinθcosθ … (1)
From equation 1, solving simultaneous equations for the three strain readings (-45°, 0°, +45°) gave the principal strains εx andεy,and the shear strain γxy.
Other analyses of the results were undertaken to determine the strain across the bridge at mid-span and maximum deflection, the strain through the girders to the deck in girders 1, 2 and 3, and deflection-load comparisons using the deflections from phases 1 and 2. All of these analyses were undertaken using data from the critical runs previously determined.
Both dynamic and static loading was taken into account. All field data collected and analysed can be found in Appendix D.
As explained in Chapter 3, preliminary testing was conducted using a small truck with an estimated rear axle load of 30 kN. Table 3-1 shows the measured maximum mid-span values of deflections of girders 1, 2 and 3, and top and bottom strains at mid-span of girder 1. Data collected and plots developed can be found in Appendix D.
Figure 4-1: Initial truck trial
Table 4-1: Initial truck trial measurements and formal test predictions
Instrument & Position
Measured Maximum
Value
Predicted Value for 200 kN (~ 6.5 x load)
String pot Girder 1 (mm) 4.55 ~ 30
String pot Girder 2 (mm) 3.22 ~ 20
String pot Girder 3 (mm) 2.35 ~ 14
Strain Gauge bottom of Girder 1 (µ) 106 ~ 650
Strain Gauge top of Girder 1 (µ) -53 ~ 325
4.3.
Deflections
The analysis of mid-span deflections was used to determine critical runs for each of the girders. Further analysis of deflections included differential girder-deck deflection, differential deck deflection, girder deflections near the abutments, and load-deflection comparisons between phase 1 loading and phase 2 loading. Static load deflections were considered separately to dynamic load deflections. Graphs shown are representative of all results analysed, and all other graphs can be found in Appendix D.
4.3.1. Dynamic Deflections
4.3.1.1. Mid-Span Girder Deflections
The analysis of the mid-span girder deflections measured from the overloaded truck (Load phase 2) runs have been used to determine the critical runs, so that further testing time can be minimised by discarding unnecessary truck runs.
From the mid-span deflection analysis as shown in the graphs below, the following runs have been confirmed as critical for each girder:
Girder 1: Run 1 Girder 2: Run 1
Girder 3: Run 5 and Run 6 Girder 4: Run 8
Girder 5: Run 8
will commence at -6 metres and cease at 10 metres, when the rear axle moves off the far end of the bridge.
As all runs were at slightly different speeds, factors have been applied to rescale each run so that deflection is initiated at -6 metres and ceases at 10 metres.
Girder 1 Deflection
-14 -12 -10 -8 -6 -4 -2 0 2
-10.000 -5.000 0.000 5.000 10.000 15.000
Rear Axle Position (m)
D e fl e c ti o n ( m m
) Run 1
Run 2 Run 3 Run 4 Run 5 Run 6 Run 8
Figure 4-2: Girder 1 Mid-span Deflection
Girder 2 Deflections -12 -10 -8 -6 -4 -2 0 2
-10.000 -5.000 0.000 5.000 10.000 15.000
Rear Axle Position
D e fl e c ti o n ( m m
) Run 1
Run 2 Run 3 Run 4 Run 5 Run 6 Run 8
Figure 4-3: Girder 2 Mid-span Deflection
Girder 3 Deflections
-9 -8 -7 -6 -5 -4 -3 -2 -1 0 1
-10.000 -5.000 0.000 5.000 10.000 15.000
Rear Axle Position
D e fl e c ti o n ( m m
) Run 1
Run 2 Run 3 Run 4 Run 5 Run 6 Run 8
Figure 4-4: Girder 3 Mid-span Deflection
Table 4-2: Critical Run and Maximum Mid-span Deflection of girders
Girder # Run # Max Deflection (mm) Rear axle Position
1 1 12.633 ~ 300 mm to left of mid-span
2 1 10.279 ~ 300 mm to left of mid-span
3 5 8.289 ~ 600 mm to left of mid-span
3 6 8.434 ~ 600 mm to left of mid-span
4 8 8.968 ~ 400 mm to left of mid-span
5 8 11.505 ~ 400 mm to left of mid-span
As Table 4-2 shows, all of the maximum girder deflections are well below the design maximum limit of 20 mm. Once the critical runs were established, other analysis occurred.
4.3.1.2. Differential Girder-Deck Deflection
The positioning of instruments SP06 (deck), SP07 (girder) and SP08 (deck) was used to determine if there was considerable differential displacement between the deck panels and the girders that were epoxy glued together (rigid bond). The positioning is shown in Figure 4-5, below. The spacing between instruments was approximately 500 mm.
SP 08 SP 07
SP 06
G3 G2
sightly more than the deck in runs 5 and 6 (Figures 4-8 and 4-9). However, this differential displacement is approximately 0.2 mm (~ 0.04%), so should not be of major significance. Only critical runs were considered when plotting the results.
Run 1 -0.2 0 0.2 0.4 0.6 0.8 1 1.2 1.4
0 50 100 150 200 250 300 350
Time (1/10th s)
D if fe re n ti a l D e fl e c ti o n ( m m ) SP06-SP07 Differential SP07-SP08 Differential
Figure 4-6: Differential Girder-Deck Deflection – Run 1
Run 8 -1.4 -1.2 -1 -0.8 -0.6 -0.4 -0.2 0 0.2
0 50 100 150 200 250 300 350
Time (1/10th s)
D if fe re n ti a l D e fl e c ti o n ( m m ) SP06-SP07 Differential SP07-SP08 Differential
Run 5 -0.7 -0.6 -0.5 -0.4 -0.3 -0.2 -0.1 0 0.1 0.2
0 50 100 150 200 250 300 350
Time (1/10th s)
D if fe re n ti a l D e fl e c ti o n ( m m ) SP06-SP07 Differential SP07-SP08 Differential
Figure 4-8: Differential Girder-Deck Deflection - Run 5
Run 6 -0.7 -0.6 -0.5 -0.4 -0.3 -0.2 -0.1 0 0.1 0.2
0 50 100 150 200 250 300 350
Time (1/10th s)
D if fe re n ti a l D e fl e c ti o n ( m m ) SP06-SP07 Differential SP07-SP08 Differential
4.3.1.3. Differential Deck Deflection
As shown in Figure 4-10, the differential displacement measured (LV12, LV13) at the USQ end of the bridge, where the deck was glued to the girders with Sikaflex (flexible bond), reached a maximum of 0.7 mm (Run 1). The magnitude of this deflection (approximately 10-20%) may have some structural significance relative to the overall displacement occurring at the same time, and could be regarded as an influencing factor. Figure 4-11 shows the maximum differential displacement on each of the critical runs.
Differential Deflection LV12-LV13
-0.1 0 0.1 0.2 0.3 0.4 0.5 0.6 0.7 0.8
0 100 200 300 400
Time (1/10th s)
D if fe re n ti a l D e fl e c ti o n ( m m ) Run 1 Run 5 Run 6 Run 8
Differential Displacement
0 0.1 0.2 0.3 0.4 0.5 0.6 0.7 0.8
1 5 6 8
Run #
D
is
p
la
c
e
m
e
n
t
(m
m
)
Differential Displacement
4.3.1.4. Deflection near Abutments
This measurement was taken to use in comparison with the finite element model analysis, and does not have any significant structural bearing. As the number of measuring instruments was limited, readings were only taken from Girder 1. As with the differential girder-deck displacement, only critical runs were considered.
Girder 1 Deflection near Abutment
-0.5 0 0.5 1 1.5 2 2.5
0 50 100 150 200 250 300 350
Time (1/10th s)
D
e
fl
e
c
ti
o
n
(
m
m
)
Run 1 Run 5 Run 6 Run 8
4.3.1.5. Load-Deflection Comparisons
The load-deflection plots appear to be reasonably linear when the load is carried by the appropriate girders for the particular runs i.e. Girders 1, 2 and 3 for Run 1, Girders 2, 3 and 4 from Runs 5 and 6, and Girders 3, 4 and 5 for Run 8. This is shown in Figures 4-13 to 4-16.
Run 1
0 50 100 150 200 250
0 5 10 15
Deflection (mm)
L
o
a
d
(
k
N
) Girder 1
Girder 2
Girder 3
Girder 4
Girder 5
Run 5 0 50 100 150 200 250
0 2 4 6 8 10
Deflection (mm) L o a d ( k N
) Girder 1
Girder 2
Girder 3
Girder 4
Girder 5
Figure 4-14: Load-Deflection Comparison - Run 5
Run 6 0 50 100 150 200 250
0 5 10 15
Deflection (mm) L o a d ( k N
) Girder 1
Girder 2
Girder 3
Girder 4
Girder 5
Run 8
0 50 100 150 200 250
0 5 10 15
Deflection (mm)
L
o
a
d
(
k
N
) Girder 1
Girder 2
Girder 3
Girder 4
Girder 5
4.3.2. Static Deflections
The analysis of static deflections and comparison with dynamic deflections previously analysed should give an indication of the extent of the dynamic response of the bridge to heavy vehicles. Vehicle bridge interaction (VBI) has been studied extensively and software has been developed to show that a large number of variables need to be taken into account when analysing field test results. This was outside the scope of this project, and consequently was not analysed. The following results show that there was some dynamic response of the bridge to the truck runs, particularly the higher speed run (Run 6), but no extensive analysis was undertaken.
4.3.2.1. Mid-span Girder Deflections
Static Load Mid-span Deflection
-9 -8 -7 -6 -5 -4 -3 -2 -1 0 1 Time D e fl e c ti o n ( m m ) Girder 1 Girder 2 Girder 3 Girder 4 Girder 5
Figure 4-17: Static Load Mid-span Deflection
Table 4-3: Experimental Static-Dynamic Differential of Bridge
Girder # Dynamic Deflection (mm)
Static Deflection
(mm) Differential (mm)
1 6.942 6.590 0.352
2 8.288 7.694 0.594
3 8.434 7.791 0.643
4 7.779 7.294 0.485
5 6.650 6.274 0.376
This can be seen more easily in Figure 4-18. This figure also shows that the central runs were actually run a little to the left of centre, and this may have slightly skewed the results. For future testing, it would be advisable to re-mark thee proposed wheel paths to run the truck equidistant from both edges, and remove any skewing of the data.
Bridge Cross Section Deflection
-9 -8.5 -8 -7.5 -7 -6.5 -6 -5.5 -5
1 2 3 4 5
further research of these results serves no particular purpose but may be undertaken in future study.
4.3.2.2. Differential Girder-Deck Deflection
As with the dynamic results, the static loading shows reasonable linearity across the deck-girder-deck instrument positioning. The differential deflection of approximately 0.2 mm suggests that the differential girder-deck deflection has minimal structural significance, and further testing need not include measurements taken from these instruments.
Differential Girder-Deck Deflection
-0.7 -0.6 -0.5 -0.4 -0.3 -0.2 -0.1 0 0.1 0.2
0 1000 2000 3000 4000
Time (1/10th s)
D
e
fl
e
c
ti
o
n
(
m
m
)
SP07-SP08 Differential SP07-SP08 Differential
4.3.2.3. Differential Deck Deflection
The static load differential deck deflection of 0.4 – 0.5 mm, as shown in Figure 4-20, is in close agreement to the dynamic load centre run differential deck deflections, particularly that of Run 6.
Differential Deck Deflection
-0.1 0 0.1 0.2 0.3 0.4 0.5 0.6
0 1000 2000 3000 4000
Time (1/10th s)
D
e
fl
e
c
ti
o
n
(
m
m
)
LV12-LV13 Differential
4.3.2.4. Deflection near Abutments
The average deflection of Girder 1 near the abutment at the USQ end of the bridge under static load was approximately 1 mm (Figure 4-21). This value is in close agreement with the dynamic deflection on Runs 5 and 6 of approximately 1 mm (Figure 4-12).
Girder 1 Deflection near Abutment
0 0.2 0.4 0.6 0.8 1 1.2
0 500 1000 1500 2000 2500 3000 3500
Time (1/10th s)
D
e
fl
e
c
ti
o
n
(
m
m
)
LV11
Figure 4-21: Deflection near Abutment at USQ end of Bridge
4.3.2.5. Load-Deflection Comparisons
4.4.
Strains
From the critical runs, strain readings were taken and analysed. Strain gauges were placed on the soffit of each girder (SG21, SG24, SG27, SG30 and SG31) to measure the maximum tensile strain in the girders, and 50 mm below the top of girders 1, 2 and 3 (SG22, SG25 and SG28) to measure the maximum compressive strain in the girders.
Strain gauges were also placed longitudinally (SG23, SG26 and SG29) on the underside of the deck at mid-span near girders 1, 2 and 3, and transverse (SG32 and SG33) near mid-span between girders 1 and 2, and girders 2 and 3.
Delta rosette configured strain gauges (-45°, 0°, +45°) were positioned at either end of girder 1, as close as practicable to the abutments, to record strains to be use din the calculation of shear strains as close as possible to maximum (SG34, SG35 and SG36 at the USQ end of the bridge, and SG37, SG38 and SG39 at the Handley St end of the bridge).
All strain values recorded were well below the yield and/or shear strain capacity (approximately 2500 µ for yield strain of steel reinforcing in girders, and approximately 12000 µ for glass fibre yield strain in deck units) of the bridge members.
4.4.1. Dynamic Loading Strains
4.4.1.1. Girder Tensile Strains
The maximum tensile strain of 358 µ was recorded in girder 5 on Run 8. Figures 4-22 to 4-24 show the tensile strains recorded on each girder for the critical runs.
SG 21 - Girder 1
-50 0 50 100 150 200 250 300 350
0 100 200 300 400
Time (1/10th s)
M ic ro s tr a
in Run 1
Run 5 Run 6
Run 8
Figure 4-22: Tensile Strain - Girder 1
SG 24 - Girder 2
-50 0 50 100 150 200 250
0 100 200 300 400
Time (1/10th s)
M ic ro s tr a
in Run 1
Run 5
Run 6
Run 8
SG 27 - Girder 3
-50 0 50 100 150 200 250
0 100 200 300 400
Time (1/10th s)
M
ic
ro
s
tr
a
in Run 1
Run 5
Run 6
Run 8
Figure 4-24: Tensile Strain - Girder 3
As with the mid-span deflections, girders 1 and 5 and girders 2 and 4 are similar, so the tensile strain plots of girders 4 and 5 will not be shown here. They can be found in Appendix D, together with the data used to develop the plots.
Table 4-4 shows the maximum tensile strains in all girders, and the runs associated with the maximum values.
Table 4-4: Maximum Girder Tensile Strains
Girder # Maximum Tensile Strain (µ) Run #
1 315 1
2 234 1
3 195 6
4 230 8
5 358 8
Strain Distribution across bridge at maximum deflection
0 50 100 150 200 250 300 350 400
1 2 3 4 5
Girder #
M
ic
ro
s
tr
a
in Run 1
Run 5 Run 6 Run 8
Figure 4-25: Strain Distribution across bridge at maximum deflection
4.4.1.2. Girder Compressive Strains
SG 22 - Girder 1 -180 -160 -140 -120 -100 -80 -60 -40 -20 0 20
0 100 200 300 400
Time (1/10th s)
M ic ro s tr a
in Run 1
Run 5 Run 6
Run 8
Figure 4-26: Compressive Strain - Girder 1
SG 25 - Girder 2
-70 -60 -50 -40 -30 -20 -10 0 10
0 100 200 300 400
Time (1/10th s)
M ic ro s tr a
in Run 1
Run 5
Run 6
Run 8
SG 28 - Girder 3
-60 -50 -40 -30 -20 -10 0 10
0 100 200 300 400
Time (1/10th s)
M
ic
ro
s
tr
a
in Run 1
Run 5 Run 6
Run 8
Figure 4-28: Compressive Strain - Girder 3
Table 4-5 shows the maximum compressive strains in the three girders, and the runs associated with the maximum values.
Table 4-5: Maximum Girder Compressive Strains
Girder # Maximum Compressive Strain (µ) Run #
1 170 1
2 61 6
3 52 8
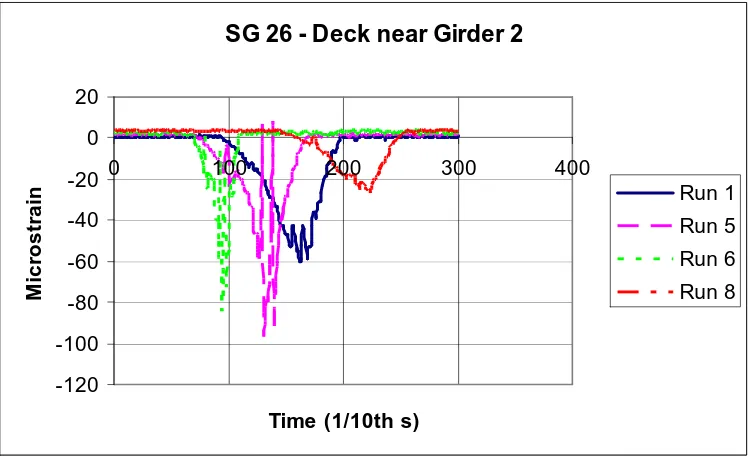
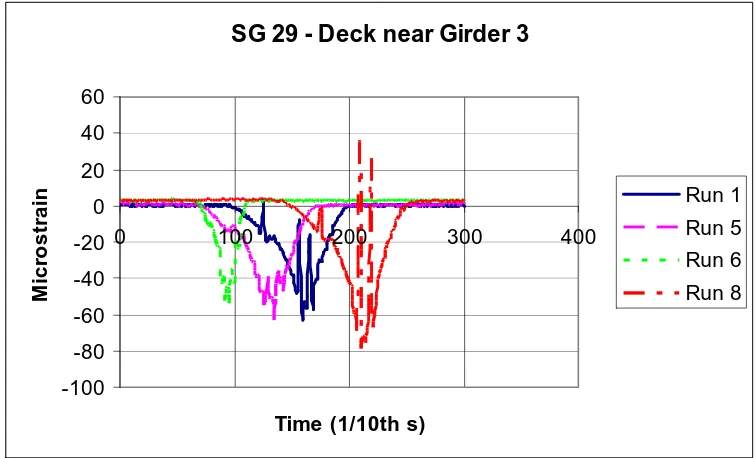
4.4.1.3. Deck Strains
Both longitudinal (at mid-span) and transverse (near mid-span) strain were recorded.
Longitudinal Deck Strain
stress of 36 µ was recorded near girder 3 on Run 8. The tensile stresses may be due to the vibration of the bridge, and will not be analysed further. Figures 4-29 to 4-31 show the strains recorded near each girder for the critical runs.
SG23 - Deck near Girder 1
-80 -70 -60 -50 -40 -30 -20 -10 0 10
0 100 200 300 400
Time (1/10th s)
M ic ro s tr a
in Run 1
Run 5 Run 6
[image:58.595.117.492.437.665.2]Run 8
Figure 4-29: Longitudinal Strain on Deck near Girder 1
SG 26 - Deck near Girder 2
-120 -100 -80 -60 -40 -20 0 20
0 100 200 300 400
Time (1/10th s)
M ic ro s tr a
in Run 1
Run 5
Run 6
SG 29 - Deck near Girder 3
-100 -80 -60 -40 -20 0 20 40 60
0 100 200 300 400
Time (1/10th s)
M
ic
ro
s
tr
a
in Run 1
Run 5
Run 6
[image:59.595.114.492.73.302.2]Run 8
Figure 4-31: Longitudinal Strain on Deck near Girder 3
Table 4-6 shows the maximum compressive longitudinal strains in the underside of the deck panels near the three girders, and the runs associated with the maximum values.
Table 4-6: Maximum Deck Longitudinal Compressive Strains
Deck near Girder # Maximum Compressive Strain (µ) Run #
1 73 1
2 96 6
3 78 8
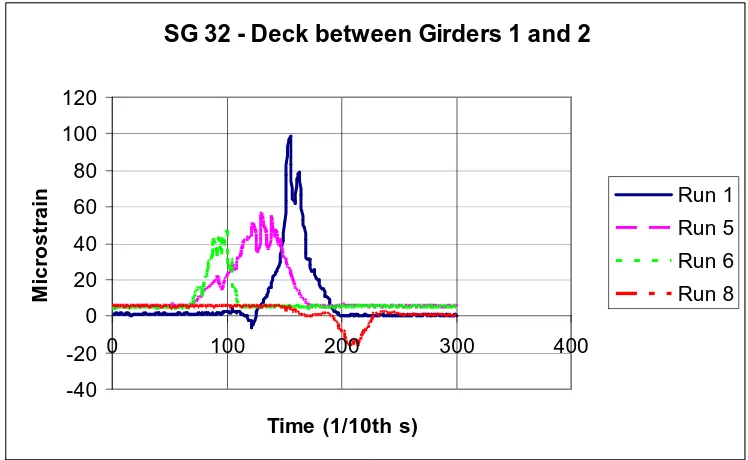
Transverse Deck Strains
SG 32 - Deck between Girders 1 and 2 -40 -20 0 20 40 60 80 100 120
0 100 200 300 400
Time (1/10th s)
M ic ro s tr a
in Run 1
Run 5 Run 6
[image:60.595.114.488.73.303.2]Run 8
Figure 4-32: Transverse Deck Strain between girders 1 and 2
SG 33 - Deck between Girders 2 and 3
-50 0 50 100 150 200 250 300
0 100 200 300 400
Time (1/10th s)
M ic ro s tr a
in Run 1
Run 5
Run 6
[image:60.595.115.487.354.585.2]Run 8
Figure 4-33: Transverse Strain on Deck between girders 2 and 3
Table 4-7: Maximum Deck Transverse Strains
Strain Gauge # Maximum Strain (µ) Run #
SG32 99 (tensile) 1
SG32 16 (compressive) 8
SG33 276 (tensile) 6
SG33 15 (compressive) 8
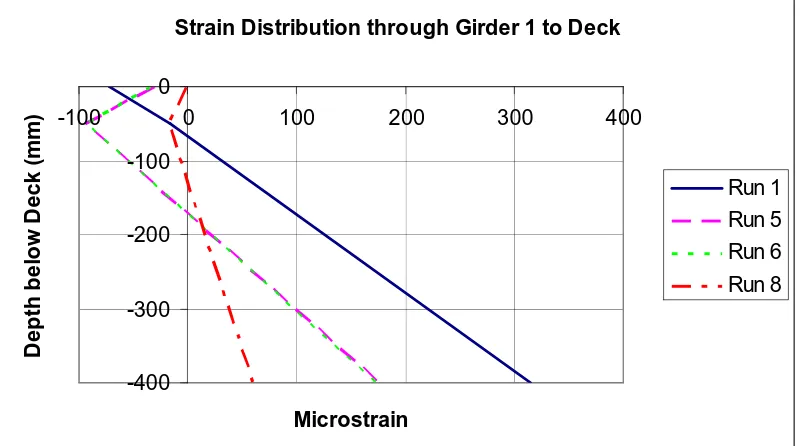
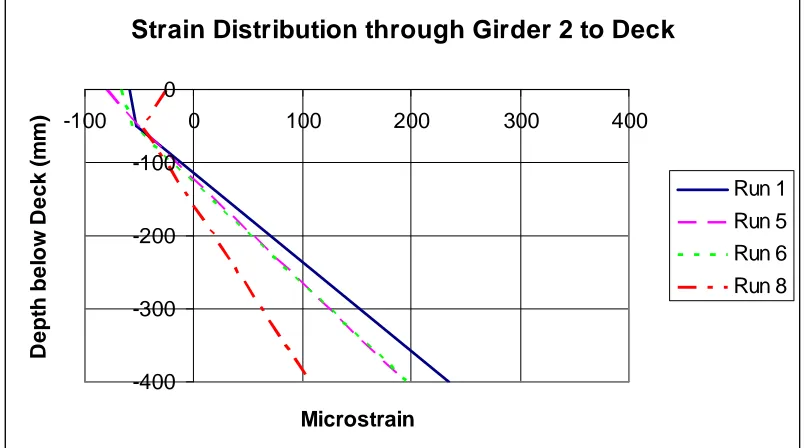
4.4.1.4. Combination Strains
Using the readings taken from the girder tensile and compressive strains, and the longitudinal deck strains, combination strain plots were developed to show the strain through the girders to the deck for girders 1, 2 and 3. These plots are shown in Figures 4-34 to 4-36. Figure 4-34 shows the strain distribution in Girder 1 on Run 1 being very close to linear, and Figure 4-36 show the strain distribution in Girder 3 on all critical runs being close to linear.
Strain Distribution through Girder 1 to Deck
-400 -300 -200 -100 0
-100 0 100 200 300 400
Microstrain D e p th b e lo w D e c k ( m m ) Run 1 Run 5 Run 6 Run 8
Strain Distribution through Girder 2 to Deck -400 -300 -200 -100 0
-100 0 100 200 300 400
[image:62.595.114.516.75.299.2]Microstrain D e p th b e lo w D e c k ( m m ) Run 1 Run 5 Run 6 Run 8
Figure 4-35: Strain through Girder 2 to Deck
Strain Distribution through Girder 3 to Deck
-400 -300 -200 -100 0
-100 0 100 200 300 400
Microstrain D e p th b e lo w D e c k ( m m ) Run 1 Run 5 Run 6 Run 8
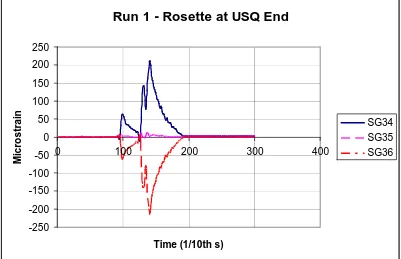
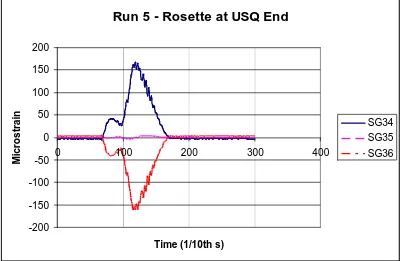
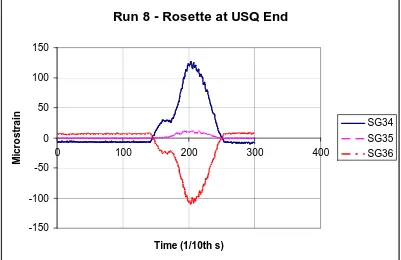
[image:62.595.114.517.347.581.2]4.4.1.5. Shear Strains
The two delta rosette configurations at either end of Girder 1 gave fairly similar shear strain value when using equation 1. Table 4-8 shows the shear strain values calculated from the recorded data and Figures 4-37 to 4-41 show the strain values measured at each end of the bridge for Run 1 and strain values measured at the USQ end of the bridge for Runs 5, 6 and 8. Other strain plots for shear strain calculation can be found in Appendix D, together with the data used to develop the plots.
Table 4-8: Maximum Delta Rosette Measurements and Calculated Shear Strain Values
(Critical Runs)
Run # End ε (-45°) (µ) ε (0°) (µ) ε (+45°)
(µ) γxy (µ)
1 USQ 211 0 -214 -425
Handley St 203 -44 -203 -406
5 USQ 167 0 -161 -328
Handley St 162 -42 -157 -319
6 USQ 175 0 -172 -347
Handley St 178 -47 -172 -350
8 USQ 127 10 -110 -237
Handley St 121 -27 -111 -232
Run 1 - Rosette at USQ End
-250 -200 -150 -100 -50 0 50 100 150 200 2500 100 200 300 400
Time (1/10th s)
[image:64.595.115.516.75.334.2]M ic ro s tr a in SG34 SG35 SG36
Figure 4-37: Delta Rosette Strains - Run 1 at USQ End
Run 1 - Rosette at Handley St End
-250 -200 -150 -100 -50 0 50 100 150 200 250
0 100 200 300 400
Time (1/10th s)
M ic ro s tr a in SG37 SG38 SG39
[image:64.595.116.518.377.650.2]Run 5 - Rosette at USQ End
-200 -150 -100 -50 0 50 100 150 2000 100 200 300 400
Time (1/10th s)
[image:65.595.115.516.75.336.2]M ic ro s tr a in SG34 SG35 SG36
Figure 4-39: Delta Rosette Strains - Run 5 at USQ End
Run 6 - Rosette at USQ End
-200 -150 -100 -50 0 50 100 150 200
0 100 200 300 400
Time (1/10th s)
M ic ro s tr a in SG34 SG35 SG36
[image:65.595.114.518.383.654.2]Run 8 - Rosette at USQ End
-150 -100 -50 0 50 100 150
0 100 200 300 400
Time (1/10th s)
M
ic
ro
s
tr
a
in
[image:66.595.115.516.75.335.2]SG34 SG35 SG36
4.4.2. Static Loading Strains
As with static load deflections, the static load strains have been analysed for use in comparison with the dynamic loading strains. This will assist in determining the extent of the dynamic response of the bridge to the truck.
4.4.2.1. Girder Tensile Strains
The maximum tensile strain for each of the girders was between 150 µ and 200 µ
(Figure 4-42) under static loading. This compares favourably with maximum tensile strain values of between 170 µ and 220 µ for all girders on Runs 5 and 6 (Figures 4-22 to 4-24 - dynamic loading, central runs).
Run 9 Girder Tensile Strains
-50 0 50 100 150 200 250
0 500 1000 1500 2000 2500 3000 3500
Time (1/10th s)
M
ic
ro
s
tr
a
in
[image:67.595.116.517.353.581.2]SG21 SG24 SG27 SG30 SG31
4.4.2.2. Girder Compressive Strains
The maximum compressive strain for each of girders 1 to 3 was between 40 µ
and 100 µ (Figure 4-43) under static loading. This compares very favourably with maximum compressive strain values of between 40 µ and 100 µ for girders 1, 2 and 3 on Runs 5 and 6 (Figures 4-26 to 4-28 – dynamic loading, central runs).
Run 9 Girder Compressive Strains
-120 -100 -80 -60 -40 -20 0 20
0 500 1000 1500 2000 2500 3000 3500
Time (1/10th s)
M
ic
ro
s
tr
a
in SG22
[image:68.595.114.517.253.483.2]SG25 SG28
4.4.2.3. Deck Strains
As with the dynamic loading results, both longitudinal and transverse strain have been recorded and analysed.
Longitudinal Deck Strain
The maximum compressive longitudinal deck strain for each of the deck panels near girders 1, 2 and 3 was between 20 µ and 80 µ (Figure 4-44) under static loading. This compares favourably with maximum compressive strain values of between 30 µ and 100 µ for recordings taken on Runs 5 and 6 (Figures 29 to 4-31 – dynamic loading, central runs).
Run 9 Longitudinal Deck Strains
-100 -80 -60 -40 -20 0 20 40
0 500 1000 1500 2000 2500 3000 3500
Time (1/10th s)
Mi
c
ro
s
tr
a
in
[image:69.595.117.517.372.603.2]SG23 SG26 SG29
Transverse Deck Strains
The maximum tensile strain of 30 µ to 40 µ between girders 1 and 2, and maximum tensile strain of 250 µ to 260 µ between girders 2 and 3 (Figure 4-45 – static loading) compares favourably with those of 40 µ to 60 µ and 240 µ to 280
µ (Figures 4-32 and 4-33 – dynamic loading, central runs).
Run 9 Transverse Deck Strains
-50 0 50 100 150 200 250 300
Time
M
ic
ro
s
tr
a
in
[image:70.595.117.512.235.461.2]SG32 SG33
4.4.2.4. Combination Strains
The combination strain through girders 1, 2 and 3 under static loading shows a very close relationship with the dynamic loading combination strains on the central runs (Runs 5 and 6). This can be seen in Figures 4-46 to 4-48.
Strain Distribution through Girder 1 to Deck
-400 -300 -200 -100 0
-100 0 100 200 300 400
[image:71.595.114.517.212.440.2]Microstrain D e p th b e lo w D e c k ( m m ) Run 5 Run 6 Run 9
Figure 4-46: Strain through Girder 1 to Deck
Strain Distribution through Girder 2 to Deck
-400 -300 -200 -100 0
-100 0 100 200 300 400
Microstrain D e p th b e lo w D e c k ( m m ) Run 5 Run 6 Run 9
[image:71.595.114.516.486.718.2]Strain Distribution through Girder 3 to Deck -400 -300 -200 -100 0
-100 0 100 200 300 400
Microstrain D e p th b e lo w D e c k ( m m ) Run 5 Run 6 Run 9
Figure 4-48: Strain through Girder 3 to Deck
4.4.2.5. Shear Strains
[image:72.595.114.517.75.299.2]The comparison between the shear strains on dynamic loading runs (Runs 5 and 6) and the shear strains on the static loading run (Run 9) are quite different to the other strain comparisons. As calculated previously, the maximum shear strains on the dynamic loading runs were between -319 µ and -350 µ, whereas the calculated maximum shear strains (Figures 4-49 and 4-50) on the static loading run ranged between -214 µ and -222 µ (Table 4-9).
Table 4-9: Maximum Delta Rosette Measurements and Calculated Shear Strain Values
(Dynamic and Static Central Runs)
Run # End ε (-45°) (µ) ε (0°) (µ) ε (+45°) (µ)
γxy (µ)
5 USQ 167 0 -161 -328
Handley St 162 -42 -157 -319
Run 9 - Rosette at USQ End -200 -150 -100 -50 0 50 100 150 200 Time D e fl e c ti o n ( m m ) SG34 SG35 SG36
Figure 4-49: Delta Rosette Strains – Run 9 at USQ End
Run 9 - Rosette at Handley St End
-200 -150 -100 -50 0 50 100 150 200 Time D e fl e c ti o n ( m m ) SG37 SG38 SG39
The static loading shear strains are approximately two-thirds magnitude of the dynamic loading shear strains. This would suggest that there is some induced dynamic shear strain present. As all shear strain values are well below the shear yield capacity of the girders, this appears structurally insignificant, but could be studied further in future projects.
4.5.
Summary
The analysis of the field test data showed that mid-span deflection is the governing criteria when designing the bridge, as all of the strain measurements and calculations were much smaller than the yield strains of the members.
The maximum mid-span deflection of the beams is well within the limiting value of 20 mm. As the analyses were conducted with the data from phase 2 of the loading (overloaded truck), this suggests a significant factor of safety is present if this bridge were to be installed into the Queensland road network.
The magnitude of the difference in dynamic load deflections and static load deflections was quite small (< 1 mm), and would appear to be structurally insignificant; however, this could be an area of further study in the future.
The magnitude of both girder-deck differential deflections and deck panel differential deflections would also appear to have no structural significance (0.2 to 0.5 mm). Again, this could be an area where future study may take place.
Both ends of girder 1 showed similar calculated shear strain values. Assuming that all girders were produced in an identical fashion, this analysis suggests that the cross section of the girders is fairly consistent.
The magnitude of the shear strain induced by the dynamic loading was greater than that induced by the static loading. This may be caused by some bouncing of the truck as it crosses uneven deck joints.
Time constraints did not allow for the inclusion of natural frequency testing data analysis. The data collected from the natural frequency field testing should be available for analysis at a later date, if required.
5.
FINITE ELEMENT ANALYSIS
5.1.
Introduction
The Strand7 software package was chosen for use as the finite element analysis tool in this project. A simple grillage model was developed, analysed and then modified and re-analysed to obtain maximum mid-span deflections for use in comparison with field data analysis.
5.2.
Development of Grillage Model
After becoming familiar with the working of the Strand7 Finite Element Analysis software package, the model of the bridge was developed.
5.2.1. Girder Design
The girders were designed as 400 mm by 400 mm square beams, with a previously determined EI value of 5.66 x 10¹³ Nmm2 (calculated from prior testing by the CEEFC). This gave a design E (modulus of elasticity) value of 26531 MPa. A Poisson’s ratio value of 0.3 was used for the girder design. The girders were subdivided into 500 mm equal sections and connected with transverse diaphragms at the appropriate points.
information available, the E value of the girders was used for the diaphragm design, and a Poisson’s ratio value of 0.3 was also used.
5.2.3. Freedom Conditions and End Restraints
For the preliminary model, one end of the bridge was designed as a simple support (only allowed movement is rotation about the z-axis) and the other end of the bridge was designed as a roller support (allowed movements are translation in the x direction and rotation about the z-axis).
Figure 5-1: Initial Strand7 Model
5.2.4. Loading
5.3.
Analysis of Grillage Model
5.3.1. Centre Run and Side Run Analysis
Both centre run and side run models were analysed using a linear static analysis and results collated in Table 5-1. The maximum deflections were created under load case 10 and load case 11 conditions (rear axles had not crossed mid-span). The maximum deflections of both models (load case 10 for centre run, load case 11 for side run) are shown in Figures 5-4 and 5-5.
Table 5-1: Strand7 FEA Grillage Model Results
Girder # Run Type Maximum Mid-span Deflection (mm)
1 Centre 14.9