Systematic evaluation of design choices for
software development tools
Mark A. Toleman
1Jim Welsh
21
Department of Mathematics & Computing, The University of Southern Queensland, Toowoomba, Australia 4350
E-mail:
2
Software Verification Research Centre, The University of Queensland, Australia 4072
E-mail:
Abstract
Most design and evaluation of software tools is based on the intuition and experience of the designers. Software tool designers consider themselves typical users of the tools that they build and tend to subjectively evaluate their products rather than objectively evaluate them using established usability methods. This subjective approach is inadequate if the quality of software tools is to improve and the use of more systematic methods is advocated. This paper summarises a sequence of studies that show how user interface design choices for software development tools can be evaluated using established usability engineering techniques. The techniques used included guideline review, predictive modelling and experimental studies with users.
This is the final corrected manuscript of
Toleman, Mark and Welsh, Jim (1998) Systematic evaluation of design choices for software development tools.
Software - Concepts and Tools, 19 (3). pp. 109-121. ISSN 1432-2188
http://dx.doi.org/10.1007/s003780050014
1 Introduction
Software development tools are designed to assist software developers in producing quality products in minimum time. Such tools should maximise the product quality and productivity achieved by enabling their users to perform their creative intellectual activity under optimal conditions, by preventing or detecting human errors as they occur, and by relieving users of routine mental and physical activity associated with the
productive process. Achieving these desirable tool attributes critically depends on the user interface chosen for the tools concerned. Ideally, user interface choices should be determined, or at least validated, by application of a well-defined set of interface selection and evaluation criteria or procedures.
In practice, such criteria and procedures are not used by many tool developers, either due to ignorance of results available in the literature, or due to the lack of a workable set of procedures for applying them. Tool developers typically rely on their own intuition in deciding on and choosing between user interface options – they consider themselves representative users and believe that other users have a similar sense of tool usability and usefulness. With many tools this is apparently not the case, since users have been slow to adopt these tools due to interaction concerns [13]. Software tools are frequently criticised for their idiosyncratic user interfaces and poor usability both by software engineers (the potential users of the tools) and by human factors
researchers [7]. Thimbleby [27] suggested that there was evidence that software tool developers designed effective tools for their own use, but this led them to underestimate the problems that other users experienced when using the tools.
Clearly, there is a requirement to make software tool developers more aware of the need for careful user interface design of their tools. A more systematic approach, which encompasses an understanding of the cognitive processes associated with software development and the tasks to be performed by the software engineer, was advocated over a decade ago [24], yet many tool designers continue to ignore such research and advice. Prototyping and empirical user testing (combined with iterative design) are the most basic elements of the usability engineering life-cycle model [16], but the typical design and development model applied by tool designers ignores empirical user testing.
The preceding arguments and discussion suggest that tool developers have been remiss. They have failed to adequately evaluate the user interfaces of the tools they develop, relying instead on intuition and subjective evaluation in considering their usability. There is a need to show that evaluation techniques (other than intuition) have a place in the design of user interfaces for software tools. This paper reviews user interface design strategies applicable to the design of software tools and discusses the results of four studies used to investigate the feasibility of systematic approaches to evaluation of design choices for the user interface of typical software tools.
2 User interface design strategies
User interface design is an integral part of the overall design process. In considering the design of user interfaces generally, Eberts [4] categorised the possible approaches under the four headings:
– empirical (using results from experiments)
– predictive modelling (construction of engineering-style models to assist evaluation of design choices) – anthropomorphic (modelling human-computer interaction on human-human communication)
– cognitive (using results from behaviour studies and psychology).
Of course, some methods of user interface design transect these categories (for example, many predictive models are based on cognitive theories), but the categorisation is useful as an organisational tool. Intuition or experience (introspection) was not explicitly considered as an approach by Eberts but was mentioned as a baseline for examining the effectiveness of the other approaches.
users. Predictive modelling approaches are also used in the evaluation process. In contrast, the
anthropomorphic and cognitive approaches provide assistance in identifying design options for the designer to consider. Where alternatives occur, they can be evaluated using intuition, experiments or a predictive modelling approach.
Probably the most common way that information about design choices is presented to the designer is through sets of guidelines and a wide range of handbooks and text books. Guidelines are based on examination of the extensive research literature available on human-computer interaction and, very often, on the experience of the particular authors (e.g., Smith and Mosier [23]). They encompass, or at least try to encompass, all the
approaches above in presenting to the designer a comprehensive guide to the design of a user interface. Their main advantage is that the designer is freed from having to sift through the extensive literature on user interface design. Additionally, guideline reviews are a useful usability inspection method [12] that is usable by software engineers who are not necessarily user interface design specialists [8].
This paper examines these strategies from the perspective of their use in the development of software tools. Since the focus of this paper is on evaluation techniques, it reviews only the documented application of
techniques for evaluation of design options. While there are well-documented applications of anthropomorphic and cognitive approaches to the identification of design options for software tools, these are seen to be beyond the scope of the paper.
2.1 Design by intuition
It is common for software engineers to develop a user interface for a software product with minimal reference to the potential users of that product – in effect, using their intuition and common sense to choose an
appropriate user interface. This is especially true of the designers of software tools. There is a natural tendency for these designers to see themselves as typical users. As a result, they disregard the considerable variation that actually exists in individual users’ characteristics and how these characteristics evolve as users become more experienced with using a tool. The apparent consequence of this approach is a disappointing uptake of innovative software tools by their intended users.
While such designer-centred intuition may be inappropriate, intuitive evaluation of tools by non-designers still has a potential role to play. It seems likely that some software tools have been informally evaluated by potential users of the tools (with such evaluations fed back to the designers), but explicit descriptions of this process have not been found. Zelkowitz [38] reported on a survey where computer science students were asked to rate and comment on their satisfaction with the syntax-directed editor SUPPORT, purely on an intuitive basis. The students rated SUPPORT lower than typical text editing environments available at the time. Development of the tool continued for several years and through several redesigns, but re-evaluations of these were not reported.
2.2 Experiments to assist in design choices
Experimental studies with prototypes and users are a valuable means of selecting between user interface design options. Unfortunately, empirical studies of users interacting with software tools are not common. Where evaluations have been done and reported, they were usually informal and primarily anecdotal. The CHI’90 Workshop on Structure Editors [15] noted experimental studies by only three sets of researchers and concluded that there was far too little of this type of research. The consensus of the workshop participants was that the complexity of the tools, the types of tasks and actions in which tool users engaged, and decisions about what and how to evaluate, hindered research in this area. More recently the report from the ICSE-16 Workshop on Software Engineering andComputer-Human Interaction [26] criticised the lack of testing and evaluation in this area, noting how immature many studies were, particularly those consisting only of questionnaires.
evaluations or informal evaluations by their peers; usability evaluations were hampered by the relatively weak market penetration of tools and the consequent lack of experience of users with the tools; and
between-environment evaluations were difficult to undertake due to the diversity of facilities offered.
2.3 Predictive models for comparing designs
Another alternative to intuition for evaluating design choices is the predictive modelling approach. Here the idea is to predict the performance of humans interacting with computers in a similar way to predictions with engineering models. Thus a model is built and used to help evaluate various user interface design options even before prototyping.
Modelling techniques, such as GOMS/KLM [3], predict potential usage patterns for systems and timings for specific tasks. Text editors, which are primitive software tools, have been studied extensively using predictive models. Embley and Nagy [5] reviewed the literature on the application of predictive models to text editing tasks, and indeed much of the discussion in Card et al. [3] was based on examination of editor use. All studies reported the usefulness of the approach in accurately predicting user actions and task times. Since then, however, the technique does not seem to have been applied in the area of software tools.
2.4 Use of guidelines in design
Choices about user interface design options can be assisted by reference to standards and guidelines. By encapsulating generalisable results obtained by either experience-based or model-based design, guidelines communicate these results, together with knowledge from areas such as psychology and graphic design, to software engineers.
Guidelines, and their use in assisting the design of user interfaces, have been studied extensively, but as far as can be ascertained there are few studies of their use in the design of the user interface for software tools. The OPEN LOOK guidelines have been considered in designing the look and feel of a specific language-based editor [1]. Another small study [11] examined the use of Motif guidelines by four designers in generating the interface for a tool that supported the browsing of files for modules for reuse. Of the designs produced in this study, only one was fully Motif-compliant. More significantly, nearly half of the design deviations identified were violations of general design recommendations and best practice as documented in available guidelines. Other instances of the use of guidelines in this domain probably exist, but explicit reference to such use has not been found. In general, the design rationales for software tools that are available rarely indicate the basis for the design of the user interface.
3 Evaluation of software tool interfaces
It is reasonable to suppose that software development tools are amenable to the same types of evaluation as other software products, and four studies to illustrate this have been undertaken. The studies conducted included a guideline review, building predictive models, and experimentally evaluating aspects of user interfaces of selected software tools, specifically language-based editors.
Software tools are available for all phases of the software development life cycle and can be categorised by the roles they play. Typical roles of a software tool include construction (and editing), display and checking of static or dynamic objects. Sommerville [25, pages 508–509] provided a functional and an activity-based classification of tools. Language-based editors are typical software tools in that they support construction, display and checking activities. They were therefore used as a representative tool class in these evaluations. The conclusions drawn from these experiments on the applicability of usability evaluation techniques should therefore be generalisable to a wide range of software tools.
the functionality they provide or the user interface by which they provide it. This study may therefore cast light on usability problems specific to language-based editors, as well as the more general applicability of usability evaluation techniques for designing software tools.
3.1 A guideline review of a language-based editor
By comparing the existing or proposed user interface of a software tool with a typical set of guidelines, it is possible to gauge the extent to which the tool conforms to the guidelines. We have reported elsewhere [29] about such an assessment using guidelines from Smith and Mosier [23] and the language-based editor UQ1 [36].
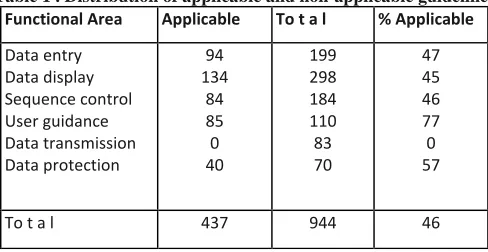
[image:5.595.173.417.301.427.2]Of the 944 guidelines contained in the guideline set, 437 (46.3%) were considered applicable to the UQ1 editor. This compared favourably with the survey reported by Smith and Mosier [22] on the application of guidelines. They found that respondents indicated that they only applied 40% of the guidelines published in another report [21]. Table 1 shows the distribution of applicable guidelines in each of the six functional areas distinguished in the guidelines.
Table 1 . Distribution of applicable and non-applicable guidelines
Functional Area Applicable To t a l % Applicable
Data entry Data display Sequence control User guidance Data transmission Data protection
94 134
84 85 0 40
199 298 184 110 83 70
47 45 46 77 0 57
To t a l 437 944 46
The number of guidelines available and the task of determining their applicability immediately raise the question of the effort involved. Software tools are available to assist in the review and selection of relevant guidelines -in this case NaviText SAM [19] was used. The effort involved in conducting the guideline review was still significant - three person-months were required. This included learning how to use the editor, learning how to use the guidelines software, studying the guidelines themselves, comparing the guidelines with the editor, and documenting the review.
It could be argued that there were too many guidelines and the set could have been significantly simplified. Others have argued for the use of smaller sets of guidelines to assist designers. In practice, however, it seems that still larger sets are becoming available (e.g., ISO 9241 reportedly will contain well over 1000 guidelines). Some guidelines were trivial to apply. For example, guideline 1.1*2 required that the cursor be designed so that it did not obscure any character displayed in the position designated by the cursor. Clearly any editor needs to comply with this and UQ1 did comply.
In other cases it was sometimes difficult to interpret the guidelines as presented. Smith and Mosier indicate that it is hazardous to interpret their guidelines using only the comments and examples given. These may be too narrow and specific, and the designer needs to recognise the generality of a guideline and apply it
and appearance, input device consistency, and user needs and user models. Some guidelines, such as those on response rate, seemed obvious and easy to accept but could involve enormous technical difficulties in
implementation.
For some issues, guidance was incomplete. The guidelines encouraged designers to provide overviews where a hierarchical structure existed in an application. However there was no discernible advice on how such
overviews should be presented. As the designers of UQ1 have noted [34], the user model of documents (in their case, hierarchic block-structured programs) might be used to justify a diagrammatic presentation (as adopted, for example, by Jesshope et al. [9]) but in practice UQ1 uses an indented text list. Validation of this design decision requires more than the application of the Smith and Mosier guidelines, and is considered further in Sect. 3.2.
As might be expected with such a large set of guidelines, there were some conflicts between seemingly applicable guidelines (a problem also noted in Myers [14]). For example, the guidelines offered conflicting requirements about the need to maintain input device consistency. Conflicting advice was also given on a very basic design decision dealing with the correspondence between user requirements and the design of data entry. For language-based editors the most important design decision is whether to adopt the tree building
(template-based) or text-recognition paradigm for document input and maintenance. As argued in Welsh et al. [34], this choice can be seen as mapping the user model of document structure (and the requirements this implies) onto corresponding data entry features, but the user models themselves may be pluralistic. The choice also has implications for input device consistency – the recognition paradigm encourages keyboard-only input, while the tree-building paradigm is most naturally implemented using both keyboard and mouse. It is
interesting to note that the most significant unresolved issue in language-based editor design coincides with issues on which the Smith and Mosier guidelines gave conflicting advice.
In summary, the Smith and Mosier guidelines proved effective in validating many design decisions in the UQ1 interface or in highlighting design problems that had subsequently been identified by other means. While the cost of applying the guidelines was non-trivial, it would have been justified at the time of UQ1’s original design by the early elimination of these design problems.
Guidelines, however, did not resolve all user interface design issues. For some they failed to give any guidance; for others they gave conflicting advice. In such cases, other means of systematic user interface design and evaluation must be considered, as illustrated in the next two subsections.
3.2 The hierarchy overview problem
Given the adage ‘A picture is worth a thousand words’, many tool designers assume that graphical
presentations improve a text-based interface. In practice, the improvement is highly dependent on the context involved and needs careful evaluation in each case. The previous subsection noted the problem of displaying the hierarchical tree structure of the modules or blocks of a program in UQ1. Such a display is frequently used by programmers in reviewing the overall structure of a program and in examining the various dependencies between modules. This view of the program may also act as a menu from which the programmer selects a block for detailed display or editing. UQ1’s use of an indented text list for this purpose is potentially at variance with the user model of document structure at this level [34]. Validation of this choice is a typical user interface problem for tool designers.
hierarchies were examined in an experiment [33].
The experiment was carried out at the University of Southern Queensland with 15 subjects selected from academic staff and postgraduate students with computing backgrounds. There were two treatments: 1. Graphical representation of a hierarchy
2. Text-based indented list representation of a hierarchy
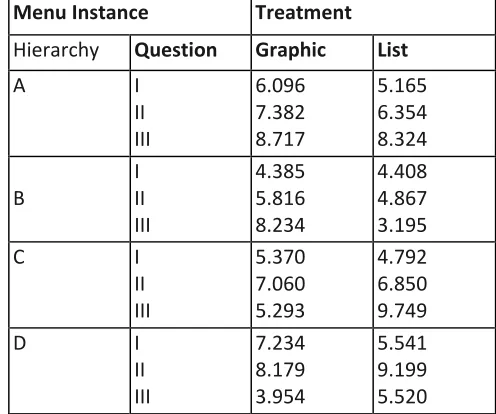
Four hierarchies were used, and for each hierarchy there were three questions asked of subjects. Hierarchy and question combinations were randomly presented to subjects with all subjects seeing both representations. In all hierarchy and question instances the subjects were presented with two windows: one briefly describing the hierarchy to be used and one displaying the instructions. The instruction window included a START button which, when clicked, displayed the relevant hierarchy. After the START button was clicked, selection of an item from the hierarchy was made by pointing to the item and clicking the mouse button. The time required to correctly find and make selections was analysed by analysis of variance for each hierarchy and question combination. Table 2 shows the mean time to selection for each of the treatment, hierarchy and question combinations. Only one combination of hierarchy and question types (those denoted by B and III in Table 2) produced a statistically significant difference between treatments (P < 0.01).
Table 2 Mean time (seconds) for selection of items from graphical and list-based representation styles
Menu Instance Treatment
Hierarchy Question Graphic List
A I
II III
6.096 7.382 8.717
5.165 6.354 8.324
B
I II III
4.385 5.816 8.234
4.408 4.867 3.195
C I
II III
5.370 7.060 5.293
4.792 6.850 9.749
D I
II III
7.234 8.179 3.954
5.541 9.199 5.520
Aesthetically, subjects preferred the graphical representation over the text-based list representation by a ratio of 2:1. A post-design analysis of this new treatment, user preference, was conducted. There was no statistically significant difference in performance between those subjects who preferred the graphical representation and those who preferred the text-based list representation for any of the hierarchy and question combinations. The results from this limited experiment indicate that for the presentation of an overview of a hierarchic structure, such as the block structure of a program, and its use as a menu for (block) selection, a graphical representation is no more efficient than a more simply implemented text-based representation. In this sense the original UQ1 design choice was validated. Based on the stated user preferences, however, there is an argument that, since the graphical view was preferred by some users, it should be offered, in some form, as a configurable option.
[image:7.595.169.417.326.533.2]3.3 The editing paradigm problem
As previously indicated, two basic paradigms for editing are commonly associated with language-based editors: tree building and text recognition. With text recognition the user manipulates the displayed representation in textual terms, and the editor parses any changes to deduce the program tree required. With the tree-building paradigm the user is allowed only operations that ensure the structural correctness of the program tree at all times. To extend a program at a given point, for example, the user selects a template from a menu of templates allowable at that point. As pure tree editing at the lowest syntactic levels is tedious, however, most
tree-building editors are actually hybrid editors, allowing the user to input or edit lower-level phrases on a text basis with delayed parsing on completion of each phrase.
The debate about the choice between tree building and text recognition as language-based editing paradigms is a continuing one. For example, [10] suggested that the strict discipline imposed by the tree-building approach was appropriate for novices but not for experienced software developers. Whittle et al. [37] proposed no single solution as they suggested that a subjective stalemate had been reached between advocates of one or the other of these approaches to language-based editing.
The key word above is subjective. As far as can be determined, no systematic attempt has been made to demonstrate the advantage of one paradigm or the other, either by application of relevant theories or by experimental investigation. Next we describe two analyses that seek to resolve the problem: one using predictive modelling, the other using an experimental approach.
3.3.1 Predictive modelling of language-based editing
In an initial study of the editing paradigm problem [30], the Keystroke-Level Model (KLM) [2] was used to assess the efficiency of available implementations of the two paradigms. With KLM, time to execute a task can be described using four physical operators, K (keystroking), P (pointing), H (homing) and D (drawing), one mental operator M and a system response operator R.
Time estimates of these operators were determined by Card et al. [2]. Total time spent in keystroking and button pressing is based on the number of keys pressed (keys, not characters, so an upper case A is two
keystrokes – SHIFT a) and average typing speed (40 wpm) for the typical non-secretarial typist of 0.28 sec. per keystroke.
The P operator represents pointing to a target using a mouse, an average 1.1 sec. With multiple input devices, the user must shift hands between these devices. The homing H operator accounts for this movement with an average 0.4 sec. between devices.
The D operator represents using the mouse to draw straight line segments. Originally this was included by Card et al. [2] to indicate the wide scope of tasks that could be covered by the KLM (for example computer-aided drafting, graphics and painting), but in our studies it was adapted to indicate text highlighting tasks that were effectively drawing tasks (point-button down-draw-button up). The D operator has two parameters: the number of lines drawn and the length of those lines. The time taken to draw a single line of length ID cm is 0.9 + 0.16 ID
sec.
Time spent ‘preparing’ to carry out a physical operator is covered by the M operator, which is an average of 1.35 sec. Heuristic rules describe the placement of M operators in an analysis of a task [3, page 265].
users cognitively organise methods according to submethod ‘chunks’. The estimate for the M operator represents the time to retrieve a chunk of information from long-term memory into working memory.
Application of KLM requires a precise definition of the user interaction sequences (keystrokes, mouse-clicks, etc.) that are required to carry out selected tasks. The tree-building paradigm has been implemented in a variety of editors, with potential differences in the precise interaction sequences involved. In this study the example used was a Pascal editor generated using the Synthesizer Generator [20], which is widely acknowledged as typical of the genre. This editor allowed the user to exercise the tree-building paradigm either via the use of the mouse (SG-TB) or keyboard (SG-TBk) for menu selection and cursor movement. The text recognition editors considered included variants of the UQ editors. UQ1 was available in its standard form as a bimodal pure text-recognition editor (UQ1-TR) and in an enhanced form which effectively simulated template-based input without compromising its basic editing paradigm (UQ1-TB). A modeless text-recognition editor was also considered (UQ*).
Language-based editors are intended to benefit both program development (input of new program fragments) and program maintenance (editing existing program fragments). Keystroke-Level Models for some program development and maintenance examples were developed (details of these examples can be found elsewhere [28]) for the various editing paradigms and then the corresponding predicted execution times were compared. Figure 1 is a typical program development example.
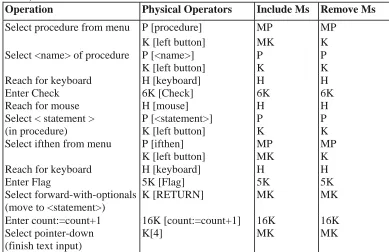
Table 3 provides the KLM analysis for one feasible way of using tree building for this program development example. The first column in the table presents the method used for each part of the task (for example, Select
PROCEDURE Check; BEGIN
IF Flag THEN count := count + 1 END;
Fig. 1. An example program input task, Check – PROCEDURE
procedure from menu), while the second gives the physical operator encoding as set out in KLM (for example, P [procedure]). Column three represents the application of ‘Rule 0’ for inserting the mental operator M, while column four shows the application of the other heuristic rules for the removal of M operators [3, page 265]. It is this last column that provides the list of operators for the execution time estimate. The estimate of total time (seconds) to input the program development example using the mouse-based version of the tree-building editor and the estimates of the operators given previously is:
33K + 4P + 3H + 4M = 33 x 0.28 + 4 +3x0.4+4
= 20.24 sec
Table 4 shows the time estimates for each of the editors for various program development examples (for program development, UQ* is the same as UQ1-TR since modality makes no difference during input of completely new text). Table 5 presents the results for selected maintenance tasks.
For program development, text recognition was consistently more efficient than tree building. In more than half the cases, text recognition was more than 20% faster. The difference between tree building and text recognition was mainly attributable to the extra mental operators M. For 60% of the maintenance tasks modal text
Table 3. KLM analysis for program code input for tree-building paradigm with mouse-based menu selection (SG-TB)
Operation Physical Operators Include Ms Remove Ms
Select procedure from menu P [procedure] MP MP K [left button] MK K Select <name> of procedure P [<name>] P P
K [left button] K K Reach for keyboard H [keyboard] H H
Enter Check 6K [Check] 6K 6K
Reach for mouse H [mouse] H H
Select < statement > P [<statement>] P P (in procedure) K [left button] K K Select ifthen from menu P [ifthen] MP MP
K [left button] MK K Reach for keyboard H [keyboard] H H
Enter Flag 5K [Flag] 5K 5K
Select forward-with-optionals K [RETURN] MK MK (move to <statement>)
Enter count:=count+1 16K [count:=count+1] 16K 16K Select pointer-down K[4] MK MK (finish text input)
Table 4. KLM analysis time estimates (seconds) for tree building (SG-TB), tree building
with keyboard-based menu selection (SG-TBk), text recognition (UQ1-TR) and text recognition with mouse-based menu selection (UQ1-TB) paradigms for program development
Procedure SG-TB SG-TBk UQ1-TR UQ1-TB
[image:10.595.101.494.603.767.2]Check - PROCEDURE 20.24 18.51 17.49 20.51 AddNumbers - PROCEDURE 21.21 19.17 17.36 17.69 AddNumbers - FOR 29.53 28.77 23.98 29.70 StoreCount - CASE 50.77 50.23 40.22 50.05 Random - FUNCTION 18.36 16.32 12.60 13.21 ComputeChange - IF-THEN-ELSE 16.70 16.04 12.83 15.63 CheckInput - REPEAT-UNTIL 37.70 36.76 33.55 34.72 IterativeSum - WHILE-DO 30.03 28.31 25.66 28.96
Table 5. KLM analysis time estimates (seconds) for tree building (SG-TB), tree building with
keyboard-based menu selection (SG-TBk), text recognition (UQ1-TR), text recognition with mouse-based menu selection (UQ1-TB),and modeless text recognition (UQ*) for program maintenance
Procedure SG-TB SG-TBk UQ1-TR UQ1-TB UQ*
In summary, KLM has proved to be a useful design evaluation tool. By applying KLM, program development using text recognition was shown to be most efficient; however, the validity of this claim is dependent on the KLM operator estimates used, an issue dealt with in a later section. KLM not only assisted in comparing relevant design options but also indicated inadequacies of the UQ implementation as it currently stood. However, one of KLM’s main problems was the difficulty of the placement of M operators, which was critical to the comparative outcome. In general, their placement is nontrivial, needing careful thought and possibly experimentation for some design situations.
3.3.2 A user-based experiment with editing paradigms
A predictive model such as KLM enables a designer to predict the time taken by experienced-expert users in carrying out a given task using a given tool or paradigm. However, such models have practical limitations – and they only predict the time taken to execute a task and not the time taken in acquiring the information to execute the task, they assume error-free expert behaviour, and they are potentially sensitive to modelling choices such as the placement of M operators.
Based on these arguments, a controlled experiment was undertaken using a small group of software engineers [31]. As with the predictive modelling approach, the relative efficiency of the two paradigms (i.e., finding which paradigm was more efficient for use by software engineers engaged in typical software development tasks) still remained of interest. The preference a user had for one paradigm over the other was also of interest. In this experiment there were three treatments:
– Program development and maintenance using text recognition via the standard UQ1 editor (UQ1-TR). – Program development and maintenance using tree building via the enhanced UQ1 editor (UQ1-TB). – Program development and maintenance using tree building via the Synthesizer Generator editor (SG-TB). For each of the five subjects there were 20 tasks to be completed on each of three days. These tasks included nine program development tasks and eleven program maintenance tasks, the same tasks as in the KLM study (the one extra program development task Count–PROCEDURE was identical to Check–PROCEDURE to examine any learning effect). The treatment sequence was randomly assigned for each subject. Subjects undertook the tasks for one paradigm on one day, another paradigm on the next day and the remaining
paradigm on the following day. Randomisation and a reasonable delay between treatment application decreased any carry-over (or residual) effect of previous treatments.
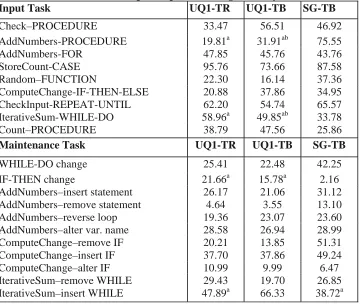
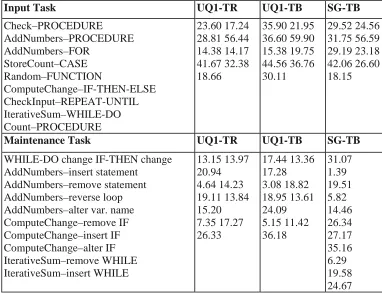
Time required to complete each task was analysed by analysis of variance. The number of error types and the actual number of errors associated with task completion were also analysed by analysis of variance after applying a log transformation typically applied before analysing data consisting of counts. Time associated with errors and average error times were analysed by analysis of variance as well. Some errors were filtered before any analysis. In particular, long time delays between ending one task and beginning the next were eliminated from analysis. Table 6 shows the mean times taken by subjects to complete the program development and maintenance tasks.
In general, the subjects preferred the tree-building paradigm and estimated that their speed and accuracy were better with it. This perception of the users did not reflect the actual situation – mean completion times using text recognition were shorter than those using tree building for 60% of the tasks undertaken. Statistically, however, there were few significant differences between the paradigms for any of the usability parameters considered in the experiment. These parameters included task completion times, error frequency, error times, types of error and the learnability of each paradigm.
variability suitable for calculating sample sizes that are able to give more powerful tests of treatment
[image:12.595.118.478.173.477.2]differences for future experimentation. As such tools become used by a wider range of professionals, it may be possible to conduct the experiments with more experienced users.
Table 6 . Overall completion times (seconds) for program development and maintenance tasks. Means within the same row, with the same or no superscript, are not significantly different
Input Task UQ1-TR UQ1-TB SG-TB
Check–PROCEDURE 33.47 56.51 46.92 AddNumbers-PROCEDURE 19.81a 31.91ab 75.55 AddNumbers-FOR 47.85 45.76 43.76 StoreCount-CASE 95.76 73.66 87.58 Random–FUNCTION 22.30 16.14 37.36 ComputeChange-IF-THEN-ELSE 20.88 37.86 34.95 Checklnput-REPEAT-UNTIL 62.20 54.74 65.57 IterativeSum-WHILE-DO 58.96a 49.85ab 33.78 Count–PROCEDURE 38.79 47.56 25.86
Maintenance Task UQ1-TR UQ1-TB SG-TB
WHILE-DO change 25.41 22.48 42.25 IF-THEN change 21.66a 15.78a 2.16 AddNumbers–insert statement 26.17 21.06 31.12 AddNumbers–remove statement 4.64 3.55 13.10 AddNumbers–reverse loop 19.36 23.07 23.60 AddNumbers–alter var. name 28.58 26.94 28.99 ComputeChange–remove IF 20.21 13.85 51.31 ComputeChange–insert IF 37.70 37.86 49.24 ComputeChange–alter IF 10.99 9.99 6.47 IterativeSum–remove WHILE 29.43 19.70 26.85 IterativeSum–insert WHILE 47.89a 66.33 38.72a
To enable maximum correlation between the two investigations, the development and maintenance tasks used in the experiment were those originally chosen for the purpose of modelling editing tasks using KLM. Certainly the tasks were typical of the types of editing tasks undertaken by software engineers, but they were undertaken out of context, a criticism that can be levied at any such experiment. Studying long term, on-the-job use of such products by software engineers would be a useful complementary activity, but such situated research is
expensive and there are many difficulties, in particular the lack of control and availability of appropriate subjects.
The experimental procedure and apparatus itself also had limitations. Unlike the hierarchic overview
experiment, it was impractical to instrument the editors themselves to capture the necessary experimental data. Instead, this was achieved using an event logger to record relevant software interaction events and a video camera focussed on the computer screen to assist with interpretation of the events recorded. In practice, the video-recording was not particularly satisfactory. The resolution was relatively poor and the video-camera and computer screen were not synchronised, which produced a rolling effect on the play-back device when
reviewing the tape. Instrumentation of the editors themselves rather than using an event logger would have facilitated better and easier data extraction. In general, however, this luxury is only possible in product evaluation if source code is available, and even then there are likely to be many difficulties in the instrumentation process itself.
3.4 Validation of keystroke-level models
[image:13.595.103.485.229.522.2]The structure and conduct of the editing paradigm usability experiment meant that it was not only possible to examine usability issues related to the editors and editing paradigms but also to perform a validation of the theoretical Keystroke-Level Models [32]. Table 7 presents data generated by differencing overall task completion times and task error times and averaging for the subjects. These data are comparable to the KLM data given in Table 4 and Table 5.
Table 7 . Empirically measured times (seconds) for program development and maintenance tasks used in the KLM study
Input Task UQ1-TR UQ1-TB SG-TB
Check–PROCEDURE AddNumbers–PROCEDURE AddNumbers–FOR StoreCount–CASE Random–FUNCTION ComputeChange–IF-THEN-ELSE CheckInput–REPEAT-UNTIL IterativeSum–WHILE-DO Count–PROCEDURE 23.60 17.24 28.81 56.44 14.38 14.17 41.67 32.38 18.66 35.90 21.95 36.60 59.90 15.38 19.75 44.56 36.76 30.11 29.52 24.56 31.75 56.59 29.19 23.18 42.06 26.60 18.15
Maintenance Task UQ1-TR UQ1-TB SG-TB
WHILE-DO change IF-THEN change AddNumbers–insert statement
AddNumbers–remove statement AddNumbers–reverse loop AddNumbers–alter var. name ComputeChange–remove IF ComputeChange–insert IF ComputeChange–alter IF IterativeSum–remove WHILE IterativeSum–insert WHILE 13.15 13.97 20.94 4.64 14.23 19.11 13.84 15.20 7.35 17.27 26.33 17.44 13.36 17.28 3.08 18.82 18.95 13.61 24.09 5.15 11.42 36.18 31.07 1.39 19.51 5.82 14.46 26.34 27.17 35.16 6.29 19.58 24.67
Several methods were available to compare predicted and empirical results. The two used were percentage absolute error and correlation/regression. Percentage absolute error was calculated as:
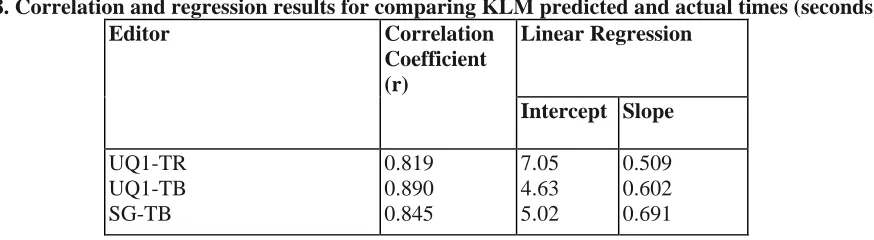
Averages for these errors were calculated for each editor: UQ1-TR 17.7%, UQ1-TB 23.4%, SG-TB 26.8%. Correlation analyses between predicted and empirical times for individual subjects produced highly related results. For each editor there was a highly significant correlation (P < 0.01) between predicted execution times (KLM) and actual execution times. Linear regression relationships also reflected this high correlation with a linear relationship between predicted times (dependent variable) and actual times (independent variable) accounting for between 67:1% and 79:2% of the overall variation (Table 8).
not available. Thus, although there is a reasonable correlation between empirical data and KLM predicted data, there appears to be a systematic difference as well. For example, for an actual execution time of 20 sec., the KLM predicted times for each editor are: UQ1-TR 17.23, UQ1-TB 16.67, SG-TB 18.84.
Table 8. Correlation and regression results for comparing KLM predicted and actual times (seconds)
Editor Correlation
Coefficient (r)
Linear Regression
Intercept Slope
UQ1-TR UQ1-TB SG-TB
0.819 0.890 0.845
7.05 4.63 5.02
0.509 0.602 0.691
Both analyses – average percentage absolute error and correlation and regression – indicate that
model-predicted values represent close to 80% of empirical data values. This accords with other literature [2, 6, 17, 18].
All key press, mouse button press and release events and timings were recorded for each subject and for each editor. The KLM predicted equivalent actions in each of the tasks analysed, so timings for model predictions were compared with actual timings.
As already indicated, the principal concern with KLM was with the estimate of time for the mental operator M. For all instances with KLM, this operator was predicted to be 1.35 sec. With each task and editor there were events that were predicted to include this mental operator. There were four instances of such events (M2K, MK, MPK and MPD).
1. For the editors UQ1-TR and UQ1-TB an M operator was assumed to precede acceptance of downstream symbols using the two keystroke sequence, CTRL a. Such events were modelled as M2K and all were extracted from the computer-based log of events for each editor and subject.
2. Single keystroke sequences that were predicted to be preceded by an M operator were evident in all three editors. In both UQ editors the ESC key was used to exit from insertion mode and return to navigation mode. The SG-TB editor implemented the ENTER or RETURN key to finalise statements input by the subject and provide template holes for filling by the user. Such events were modelled by MK.
3. All three editors included event sequences that required subjects to use the mouse to point to items for selection purposes. Items included editing commands, such as insert, delete and change for the UQ editors, and language command menu items, such as ifthen and while for the UQ1-TB and SG-TB editors. KLM placed Ms in front of all such events that were modelled as MPK.
4. Editing operations involving SG-TB required subjects to use a pull-down menu to select editing
operations, cut, copy and paste. Each event here involved pointing to a menu bar, holding down the left mouse button and drawing to the required editing operation (cut, copy or paste), and releasing the mouse button. This was modelled as MPD (D for draw). An alternative would have been to model this event as MPK press PK
release since it was possible to use the menu in this way. However, actual use of the editor by subjects indicated that this was not the preferred method and MPD more closely simulated their actions.
of P and D by counting video frames, but the main difficulty was in knowing when to start the times for each operator, that is, when the M effect had stopped and the other operator started. We chose, therefore, to consider the events in toto rather than attempt to split them into component parts.
Table 9 . Comparison of actual and predicted times (seconds) for KLM events including M2K, MK, MPK and MPD
KLM Event
Actual Predicted KLM UQ1-TR UQ1-T
B
SG-TB
M2K MK MPK MPD
1.971 1.372 2.592
-1.971 1.317 2.868
-- 0.976 4.320 2.774
1.91 1.63 2.73 3.67
Some differences between predicted and empirically measured values were found. Table 9 shows a summary of the predicted and empirically determined timings for the KLM events analysed here. These values could be used as alternatives to those supplied in [2] when comparing design options for software development tools of the type described here.
Using these empirically determined time estimates of KLM events a new set of KLM time estimates was predicted for the tasks. Percentage absolute errors were then recalculated and new correlation and regression equations were produced. Neither set of recalculations showed a marked improvement in association between predicted and empirical times. On this basis the original KLM estimates from [2] appear to be reasonable. Further improvements to the predictions might be obtained by considering alternative estimates of some of KLM’s other operators. Improvements might also be noticed if actual rather than estimated values of typing speed of users were included. Neither of these has been considered at this stage since the principal concern was with estimates and placement of M operators; however, this may be considered in future work.
4 Conclusions
The contributions of this research can be categorised under two headings: the process of user interface design and evaluation in the software tool domain, and specific outcomes relevant to the particular software
development tools examined.
Contributions to the process of design and evaluation are as follows:
– Design evaluation strategies other than intuition are feasible for designing the user interface of software tools and are relevant to the usability of the subsequent tools. The designers of UQ1 did consider user models and related cognitive issues as the basis for design decisions for UQ1’s user interface, but there had been no validation of the models nor usability studies of the implementation based on the models. Strategies other than intuition have been used to successfully validate the models.
– User interface design guidelines are an important resource that can and should be consulted by software tool designers. Using a retrospective analysis involving the application of guidelines to an existing user interface, it was shown that several inappropriate design decisions made for UQ1 could have been avoided if guidelines of significant coverage had been consulted. Guidelines do not provide complete advice on all issues, but their use may shorten the time to a final product by eliminating some design errors at an earlier stage.
showed that text recognition was a more efficient approach to editing compared with its counterpart, tree building. Thus through the use of models it was shown that it was possible to predict efficiency of editor use before the editor had been built. Validation of the models, comparing them with actual experiments with users and various editor implementations, showed that the models were accurate provided that user errors were taken into account.
– Experimental approaches to user interface evaluation of software development tools are feasible, but difficult. Some of these difficulties arise from the availability of appropriately trained and experienced users (where optimising user interaction is of interest); from the development of tasks that are typical, are of an appropriate size and are contextual for the users involved; and from the availability of appropriate experimental resources. Nevertheless, it has been shown that experimentation with complex tools and highly skilled users is possible. Many challenges remain, however, not the least of which is the need for a cultural shift in the software engineering community towards such user-based experimentation.
Outcomes specific to language-based editors are as follows:
– Graphical representations of the hierarchic structure of information are not necessarily ergonomically better than text-based representations. Providing an overview of a document’s structure is an important aspect identified from the user model of documents. At this level the model suggested that a graphical representation was more appropriate than a text-based one. Guidelines also indicated that providing an overview of any structured document was required as, indeed, were methods to manipulate the
structure and its contents, but no advice on representation was given. For various reasons, including availability of display space and ease of implementation, UQ1 implemented a text-based view and not a graphical one. The experiment to compare these two representations showed that both representations were equally efficient. This result is only relevant in this context and does not hold for all graphical representations of program documentation.
– Text recognition is at least as efficient if not better than tree building or hybrid editing paradigms for language-based editors. The predictive models and experiments with users and various editors confirmed the choice of text recognition as a viable and suitable editing paradigm.
There are many unresolved issues associated with software development tools and the design of their user interfaces. Such issues should be resolved by experimentation wherever possible. While such experimentation is often difficult, it is hoped that these experiences will encourage tool designers to consider this more
systematic approach.
References
1. Broom, B., Welsh, J., Wildman, L.: UQ2 Editor User Manual. Technical Report. Department of Computer Science. University of Queensland. Brisbane, Australia 1989
2. Card, S.K., Moran, T.P., Newell, A.: The Keystroke-Level Model for User Performance Time with Interactive Systems. Communications of the ACM 23(7): 396–410, 1980
3. Card, S.K., Moran, T.P., Newell, A.: The Psychology of Human-Computer Interaction. Hillsdale, NJ: Lawrence Erlbaum Associates, 1983
4. Eberts, R.E.: User Interface Design. Englewood Cliffs, NJ: Prentice-Hall, 1994
5. Embley D.W., Nagy, G.: Behavioral Aspects of Text Editors. ACM Computing Surveys 13(1): 33–70, 1981 6. Gray, W.D., John, B.E., Atwood, M.E.: Project Ernestine: Validating a GOMS analysis for predicting and explaining real-world performance. Human-Computer Interaction, 8(3): 237–309, 1993
Gilmore, D.J., Winder, R.L., Deti´enne, F. (eds.): User-Centred Requirements for Software Engineering Environments. pp. 323–333. Berlin, Heidelberg, New York: Springer-Verlag, 1994
8. Jeffries, R., Miller, J.R., Wharton, C., Uyeda, K.M.: User interface evaluation in the real world: A comparison of four techniques. In: Robertson, S.P., Olson, G.M., Olson, J.S. (eds.): Human Factors in Computing Systems – CHI’91, pp. 119–124, 1991
9. Jesshope, C.R., Crawley, M.J., Lovegrove, G.L.: An intelligent Pascal editor for a graphical oriented workstation. Software – Practice and Experience. 15(11): 1103–1119, 1985
10. Khwaja, A.A., Urban, J.E.: Syntax-directed editing environments: Issues and features. In: Deaton, E., Berghel, G.H., Hedrick, G. (eds.): Applied Computing: States of the Art and Practice – 1993, New York, NY: ACM Press 1993, pp. 230– 237; Also in Proceedings of the 1993 ACM SIGAPP Symposium, Indianapolis, IN, 14–16 February
11. Lowgren, J., Lauren, U.: Supporting the use of guidelines and style guides in professional user interface design. Interacting with Computers. 5(4): 385–396, 1993
12. Mack, R.L., Nielsen, J.: Executive summary. In: Nielsen, J., Mack, R.L. (eds.): Usability Inspection Methods. New York: John Wiley 1994, p. 123
13. Min¨or, S.: On structure-oriented editing. PhD thesis, Department of Computer Science. Lund University, Sweden 1990
14. Myers, B.A.: Challenges of HCI design and implementation. Interactions. 1(1): 73–83, 1994
15. Neal, L., Szwillus, G.: Report on the CHI’90 workshop on structure editors. SIGCHI Bulletin. 22(2): 49–53, 1990
16. Nielsen, J.: The usability engineering life cycle. Computer. 25(3): 12–22, 1992
17. Olson, J.R., Olson, G.M.: The growth of cognitive modeling in human-computer interaction since GOMS. Human-Computer Interaction. 5(23): 221–265, 1990
18. Peck, V.A., John, B.E.: Browser-Soar: A computational model of a highly interactive task. In: Bauersfeld, P., Bennett, J., Lynch, G. (eds.): Human Factors in Computing Systems – CHI’92 1992, pp. 165–172
19. Perlman, G., Moorhead, T.: NaviTextSAM Software User Manual. Northern Lights Software Corporation. Westford, MA 1988
20. Reps, T.W., Teitelbaum, T.: The Synthesizer Generator. SIG-PLAN Notices, 19(5): 42–48, 1984; Also in: Henderson, P. (ed.): Proceedings of ACM SIGSOFT/SIGPLAN Software Engineering Symposium on Practical Software Development Environments. Pittsburgh, May 1984
21. Smith, S.L., Mosier, J.N.: Design guidelines for user-system interface software. Technical Report ESD-TR-84-190. Mitre Corporation, Bedford, MA 1984, NTIS AD A154 907
22. Smith, S.L., Mosier, J.N.: The user interface to computer-based information systems: A survey of current software design practice. Behaviour and Information Technology. 3(4): 195–203, 1984
23. Smith, S.L., Mosier, J.N.: Guidelines for designing user interface software. Technical Report ESD-TR-86-278. Mitre Corporation, Bedford, MA 1986; Also published as NTIS AD A177 198 24. Soloway, E.: A cognitively-based methodology for designing languages, environments and methodologies. SIGPLAN Notices. 19(5): 193–196, 1984
26. Taylor, R.N., Coutaz, J.: Workshop on software engineering and computer-human interaction: Joint research issues. In: Proceedings of the Sixteenth International Conference on Software Engineering 1994, pp. 356–357
27. Thimbleby, H.: Failure in the technical user-interface design process. Computers and Graphics. 9(3): 187–193, 1990
28. Toleman, M.A.: The Design of the User Interface for Software Development Tools. PhD thesis, Department of Computer Science, University of Queensland, Brisbane, Australia, December 1996 29. Toleman, M.A., Welsh, J.: Retrospective application of user interface guidelines: A case study of a language-based editor. In: Hammond, J.H., Hall, R.R., Kaplan, I. (eds.): People Before Technology – OZCHI’91 1991, pp. 33–38
30. Toleman M.A., Welsh, J.: An evaluation of editing paradigms. In: Howard, S., Leung, Y.K. (eds.): Harmony Through Working Together – OZCHI’94 1994, pp. 73–78; Also available in extended version as Technical Report 94-5. Software Verification Research Centre, University of Queensland, Brisbane, Australia 31. Toleman, M.A., Welsh, J.: An empirical investigation of language-based editing paradigms. In: Hasan, H., Nicastri, C. (eds.): HCI: A Light into the Future – OZCHI’95 1995, pp. 163–168; Also available as Technical Report 95-45, Software Verification Research Centre, University of Queensland, Brisbane, Australia
32. Toleman, M.A., Welsh, J.: Can design choices for language-based editors be analysed with
Keystroke-Level Models? In: Sasse, M.A., Cunningham, R.J., Winder, R.L. (eds.): People and Computers XI – Proceedings of HCI’96, London 1996, pp. 97–112; Berlin, Heidelberg, New York: Springer-Verlag. Presented at HCI’96, London, 20–23 August. Also available as Technical Report 96-36, Software Verification Research Centre, University of Queensland, Brisbane, Australia
33. Toleman, M.A., Welsh, J., Chapman, A.J.: An empirical investigation of menu design in language-based editors. ACM SIG-SOFT Software Engineering Notes. 17(5): 41–46, 1992; Also in: Weber, H. (ed.): ACM SIGSOFT’92: Fifth Symposium on Software Development Environments. Washington D.C. 9–11 December 34. Welsh, J., Broom, B., Kiong, D.: A design rationale for a language-based editor. Software – Practice and Experience. 21(9): 923–948, 1991
35. Welsh, J., Han, J.: Software documents: Concepts and tools. Software – Concepts and Tools. 15(1): 12–25, 1994
36. Welsh, J., Rose, G.A., Lloyd, M.: An adaptive program editor. The Australian Computer Journal. 18(2): 67–74, 1986
37. Whittle, B.R., Gautier, R.J., Ratcliffe, M.: Trends in structure-oriented environments. International Journal of Software Engineering and Knowledge Engineering. 4(1): 123–157, 1994