FORMULATION AND EVALUATION OF
ACECLOFENAC MICROCAPSULES USING
DIFFERENT POLYMERS
Dissertation submitted to
THE TAMILNADU Dr.M.G.R MEDICAL UNIVERSITY, CHENNAI-32
In partial fulfillment of the requirement for the award of the degree of
MASTER OF PHARMACY IN
PHARMACEUTICS
Submitted by
YOGESHWARAN. G (Reg. No. 261211451)
Under the Guidance of
Mr.D.SAKTHIVEL,
M.Pharm.,Ph.D Assistant Professor, Department of PharmaceuticsPGP COLLEGE OF PHARMACEUTICAL SCIENCE AND
RESEARCH INSTITUTE, NH-7
Karur Main Road, Namakkal-637 207.
Prof. Dr. G. ARUNACHALAM. M.Pharm.,Ph.D. FIC.
Principal
PGP College of Pharmaceutical Science and Research Institute, Namakkal-637 207.
CERTIFICATE
This is to certify that the work presented in the thesis entitled “FORMULATION AND EVALUATION OF ACECLOFENAC MICROCAPSULES USING DIFFERENT POLYMERS” was carried out by YOGESHWARAN. G (Reg. No. 261211451), in partial fulfillment of the requirement for the award of Degree of Master of Pharmacy in Pharmaceutics under The Tamilnadu Dr.MGR Medical University is an authentic work carried out under my direct supervision and my fullest satisfaction.
To the best of my knowledge, the content of this thesis does not form a basis for the award of any previous Degree to anyone else.
Prof. Dr. G. ARUNACHALAM
Place: Namakkal Date:
Assistant Professor
Department of Pharmaceutics
PGP College of Pharmaceutical Science and Research Institute, Namakkal-637 207.
CERTIFICATE
This is to certify that the work presented in the thesis entitled “FORMULATION AND EVALUATION OF ACECLOFENAC MICROCAPSULES USING DIFFERENT POLYMERS” was carried out by YOGESHWARAN. G (Reg. No. 261211451), in partial fulfillment of the requirement for the award of Degree of Master of Pharmacy in Pharmaceutics under The Tamilnadu Dr.MGR Medical University is an authentic work carried out under my direct supervision, guidance and my fullest satisfaction.
To the best of my knowledge, the content of this thesis does not form a basis for the award of any previous Degree to anyone else.
Mr. D. SAKTHIVEL
Place: Namakkal Date:
This is to certify that the work presented in the thesis entitled “FORMULATION AND EVALUATION OF ACECLOFENAC MICROCAPSULES USING DIFFERENT POLYMERS” in partial fulfillment of the requirement for the award of Degree of Master of Pharmacy in Pharmaceutics under The Tamilnadu Dr.MGR Medical University is an authentic work carried out under the guidance of Mr. D. SAKTHIVEL, M.Pharm., Ph.D, Assistant Professor, PGP College of Pharmaceutical Science and Research Institute, Namakkal - 637 207.
To the best of my knowledge, the content of this thesis does not form a basis for the award of any previous Degree to anyone else.
YOGESHWARAN. G
(Reg. No. 261211451) II M. Pharmacy,
Department of Pharmaceutics, PGP College of Pharmaceutical Science
and Research Institute, Namakkal. Place: Namakkal
EVALUATION CERTIFICATE
This is to certify that the work embodied in this thesis entitled “FORMULATION AND EVALUATION OF ACECLOFENAC MICROCAPSULES USING DIFFERENT POLYMERS” submitted to The Tamilnadu Dr. M.G.R. Medical University Chennai, was carried out by YOGESHWARAN. G (Reg. No. 261211451) in the Department of Pharmaceutics, PGP College of Pharmaceutical Science and Research Institute, Namakkal in the partial fulfillment of the Degree of “Master of Pharmacy” in Pharmaceutics under the supervision and guidance of Mr. D.SAKTHIVEL, M.Pharm.,Ph.D. Asst. Professor, Department of Pharmaceutics, PGP College of Pharmaceutical Science and Research Institute, Namakkal-637 207.
This work is original and has not been submitted in part or full for the award of any other degree or diploma of any other University.
ACKNOWLEDGEMENT
With utmost reverence, I thank the God Almighty for showering his blessings for the successful completion of this work.
With great pleasure, I express whole hearted gratitude and indebtedness to my esteemed teacher and guide Mr. D.SAKTHIVEL, M.Pharm.,Ph.D Assistant Professor, Department of Pharmaceutics, PGP College of Pharmaceutical Science and Research Institute, Namakkal for his expert suggestions constructive criticism and timely help for the successful completion of this work.
I am deeply grateful to Prof. Dr. G.ARUNACHALAM, M.Pharm.,Ph.D.,FIC., Principal, PGP College of Pharmaceutical Science and Research Institute, Namakkal for providing all the facilities for the performance of this project work and for his constant encouragement given throughout the work.
I express my sincere thanks to our honorable Chairman Dr. PALANI G. PERIASAMY, M.A., M.A., Ph.D., (USA), Vice Chairman Mrs.VISALAKSHI PERIASAMY.,B.B.A., and Mr. M.GANAPATHI, IFS®
Correspondent, PGP Group of Educational Institutions, Namakkal – 637 207 for providing the all necessary facilities.
I also thankful to Mr.S.SURESH, M.Pharm., Assistant Professor, and
Mrs.C.KALAISELVI, M.Pharm., Assistant Professor, Department of Pharmaceutics.
Mr.A.CHANDRAN, M.Pharm.,Ph.D., Assistant Professor, and Mrs.A.YASODHA,
M.Pharm.,Ph.D., Assistant Professor Department of Pharmaceutical Chemistry.
Mr.S.JAYARAMAN, M.Pharm.,Ph.D., Assistant Professor and Mr.R.SIVAKUMAR,
M.Pharm.,Ph.D., Assistant Professor, Department of Pharmacognosy.
It is my privilege to express my sincere thanks to Mr. S.SEKAR, MA.,MLIS., Librarian PGP College of Pharmaceutical Science and Research Institute, Namakkal – 637 207 for providing the library facilities and co-operation to complete this work.
Also express my sincere thanks to Lab Assistants Mr.J.RAMESH,MA.,B.Ed.,
Mr.SANKARAN D.T.Ed, Mr.RAJA, M.Com and Ms. NIRMALA, DME., PGP College of Pharmaceutical Science and Research Institute, Namakkal – 637 207 for their timely help.
In this moment I thank to all my family members and friends for their selfless love, support and constant prayers, with which this work has been successful.
By
ABSTRACT
LIST OF FIGURES
Figure
No. Title Page No.
1 Mechanism of Solvent Evaporation Method 8
2 UV Spectrum of Aceclofenac in Methanol 22
3 IR Spectra of Aceclofenac with Major Peaks 23
4 Ethylcellulose Microcapsules with drug:polymer ratio 1:1
(Group of Microcapsules) 33 5 Ethylcellulose Microcapsules with drug:polymer ratio 1:1
(Single Microcapsule) 33
6 Ethylcellulose Microcapsules with drug:polymer ratio 1:2 34
7 Ethylcellulose Microcapsules with drug:polymer ratio 1:3 34
8 PVP microcapsules with drug:polymer ratio 1:2 35
9 PVP Microcapsules with drug:polymer ratio 1:3 35
10 PVP Microcapsules with drug:polymer ratio 1:4 36
11 Dissolution Profile of Formulations 43
12 Drug released kinetic model of Ethyl cellulose
Microcapsules (1:1Ratio) 45
13 Drug released kinetic model of Ethyl cellulose
Microcapsules (1:2 Ratio) 46
14 Drug released kinetic model of Ethyl cellulose
Microcapsules (1:3 Ratio) 47
15 Drug released kinetic model of PVP Microcapsules
(1:2 Ratio) 48
16 Drug released kinetic model of PVP Microcapsules
(1:3 Ratio) 49
17 Drug released kinetic model of PVP Microcapsules
18 Histogram of particle size distribution for Ethylcellulose
Microcapsule (1:1 ratio) 58
19 Histogram of particle size distribution for Ethylcellulose
Microcapsule (1:2 ratio) 58
20 Histogram of particle size distribution for Ethylcellulose
Microcapsule (1:3 ratio) 59
21 Histogram of particle size distribution for PVP
Microcapsule (1:2 ratio) 59
22 Histogram of particle size distribution for PVP
Microcapsule (1:3 ratio) 60
23 Histogram of particle size distribution for PVP
Microcapsule (1:4 ratio) 60
24 IR Spectra of Aceclofenac with Major Peaks 62
25 IR Spectra of Physical Admixture-1 with Major Peaks of
Aceclofenac 62
26 IR Spectra of Physical Admixture-2 with Major Peaks of
Aceclofenac 63
27 IR Spectra of Formulation with Major Peaks of
Aceclofenac 63
28 IR Spectra of Formulation with Major Peaks of
Aceclofenac 64
LIST OF TABLES
Table
No. Particulars Page No.
1 Formulation of Microencapsulation of
2 Different Trials For Micro-Encapsulation with
Ethyl Cellulose 28
3 Different Trials For Micro-Encapsulation with
Polyvinyl Pyrrolidone (PVP) 29 4 Results of Dissolution Test-1, Ethyl cellulose
Microcapsules (1:1Ratio) 37
5 Results of Dissolution Test-2, Ethyl cellulose
Microcapsules (1:2 Ratio) 38
6 Results of Dissolution Test-3, Ethyl cellulose
Microcapsules (1:3 Ratio) 39
7 Results of Dissolution Test-4, PVP
Microcapsules (1:2 Ratio) 40
8 Results of Dissolution Test-5, PVP
Microcapsules (1:3 Ratio) 41
9 Results of Dissolution Test-6, PVP
Microcapsules (1:4 Ratio) 42
10 Dissolution Profile of Formulations 43
11 Results of Dissolution test for Microcapsules
prepared using different Drug- Polymer ratio. 44 12 Drug released kinetic model of Ethyl cellulose Microcapsules (1:1Ratio) 45
13 Drug released kinetic model of Ethyl cellulose Microcapsules (1:2 Ratio)
46
14 Drug released kinetic model of Ethyl cellulose Microcapsules (1:3 Ratio)
47
15 Drug released kinetic model of PVP
Microcapsules (1:2 Ratio) 48
16 Drug released kinetic model of PVP
Microcapsules (1:3 Ratio) 49
17 Drug released kinetic model of PVP
Microcapsules (1:4 Ratio) 50
18 Drug Release Kinetic Model Report 51
20 Particle size analysis of Ethyl cellulose
Microcapsules (1:2 Ratio) 53
21 Particle size analysis of Ethyl cellulose
Microcapsules (1:3 Ratio) 54
22 Particle size analysis of PVP Microcapsules
(1:2 Ratio) 55
23 Particle size analysis of PVP Microcapsules
(1:3 Ratio) 56
24 Particle size analysis of PVP Microcapsules
(1:4 Ratio) 57
25 Average particle size of microcapsules with
CONTENTS
Title Page No.
Acknowledgement i-ii
Abstract iii
1. INTRODUCTION 1-13
2. LITERATURE REVIEW 14-16
3. DRUG AND POLYMER PROFILE 17-19
3.1. Drug Profile 3.2. Polymer Profile
4. OBJECTIVE 20
5. PLAN OF WORK 21
6. EXPERIMENTAL WORK 22-31
6.1. Preformulation Studies
6.2. Preparation of Aceclofenac Microcapsules 6.3. Different Trials For Micro-Encapsulation 6.4. Evaluation of Aceclofenac Microcapsules
7. RESULTS AND DISCUSSION 32-64
7.1. Characterization of Bulk Drug 7.2. Preparation of Microcapsule 7.3. Morphological and Microscopic Characterization of Microcapsules 7.4. Dissolution Rate Study
7.5. Drug Release Kinetic Model 7.6. Particle Size Analysis
7.7. Drug-Excipient Compatibility Study by FT-IR Analysis
8. SUMMARY AND CONCLUSION 65-67
1. INTRODUCTION
An ideal dosage regimen in the drug therapy of any disease is the one which immediately attains the desired therapeutic concentration of drug in plasma and maintains it constant for the entire duration of treatment. This is possible through administration of a conventional dosage form in a particular frequency and dose.1
But the dosing interval is shorter than half-life of drug resulting in a number of limitations such as –
1. Poor patient compliance.
2. Unavoidable fluctuations in drug concentration in blood.
3. Fluctuations may lead to adverse effects especially of a drug with small therapeutic index.
4. Peak valley plasma drug level is obtained which makes attainment of steady state condition difficult.
There are two ways to overcome such a situation –
1. Development of new, better and safer drugs with long half-lives and large therapeutic indices, and
2. Effective and safer use of existing drugs in the form of controlled drug delivery systems.
The first approach has many disadvantages which therefore resulted in increased interest in the second approach. An ideal controlled drug delivery system is one which delivers the drug at a pre-determined rate, locally or systematically, for a specified period of time.
In general, controlled delivery attempts to –
1. Sustain drug action at a predetermined rate by maintaining a constant blood level of the drug.
2. Localize drug action by spatial placement of controlled released system adjacent to the diseased tissue.
3. Targeting drug action by using carriers.
There are three types of controlleddrugdeliverysystems, namely
i) Passive Preprogrammed, in which the release rate is predetermined and is irresponsive to the external biological environment.
iii) Active self-programmed, in which the release rate is depend on response to information, registered by a sensor, on the changing biological environment such as blood sugar level.
The several advantages of controlled drug delivering system over a conventional dosage form are –
1. Improved patient convenience and compliance.
2. Reduction in fluctuation in steady state level of drug, so therefore better control of disease.
3. Increased safety margin of highly potent drugs. 4. Maximum utilization of drugs.
5. Reduction in health care costs.
Disadvantages of control release dosage form include
-1. Decreased systemic availability due to incomplete release, increased first pass metabolism, increased instability, in sufficient resistance time for complete release, site specific absorption, etc.
2. Poor in vitro – in vivo correlation. 3. Possibility of dose dumping.
4. Retrieval of drug is difficult in case of toxicity. 5. Higher cost of formulation.
The controlled drug delivery Systems (CDDS) are mainly administered as:
The following are the different oral sustained drug delivery systems: a. Dissolution control release.
b. Diffusion control release.
c. Diffusion and Dissolution control release. d. Ion-Exchange resins.
e. pH-independent formulations. f. Osmotically controlled release. g. Altered density formulations.
Microencapsulation techniques are the one of the methods used to prepare the above two controlled release systems like diffusion controlled release and dissolution controlled release.
MICROPARTICLES2
These are the particles with size more than ‘1’µm, containing the polymer. At present, there is no universally accepted size range that particles must have in order to be classified as microparticles. However, many workers classify the particles smaller than ‘1’µm, as nanoparticles and those more than 1000 µm as macroparticles.
Classification – Microparticles are classified into two groups,
MICROSPHERES
TYPES OF MICROCAPSULES
MICROCAPSULES
Solid Core LiquidCore
(Protective or release controlling coating)
Continuous/ shell Multinuclear Non-permeable, Semi-permeable Microcapsule Microcapsule rigid membrane membrane coating coating
Continuous / Shell Multinuclear Microcapsule Microcapsule
Continuous/Shell Multinuclear
Microcapsule Microcapsule
Microcapsules have an either spherical geometry with a continuous core region surrounded by a continuous shell or have an irregular geometry and contain a number of small droplets.
CRITERIA FOR COATING MATERIALS3
The coating materials should meet the following ideal criteria. 1. Capable of forming a film that is cohesive with the core material. 2. Chemically compatible and non-reactive with the core material.
METHOD OF MICROCAPSULES PREPARATION
There are two types of process to prepare microcapsules.
TYPE – A (CHEMICAL) PROCESS
1. Coacervation – Phase separation. 2. Interfacial polymerization.
3. In-situ polymerization. 4. Solvent evaporation. 5. Solvent extraction.
TYPE – B (MECHNAICAL) PROCESS
1. Spray drying.
2. Fluidized Bed coating.
3. Multiorifice – centrifugal processes. 4. Pan coating.
TYPE ‘A’ PROCESS
Solvent – Evaporation Method
(Emulsification – evaporation Method)
This technique is based on the evaporation of the internal phase of an emulsion by agitation. Initially, the coating polymeric material is dissolved in a volatile organic solvent. The core to be encapsulated is then dispersed in the coating polymer solution to form a suspension or emulsion.
Core material dispersed Dispersing (aqueous) in organic solution of coating media with Emulsifier
Coating polymer
Formation of emulsion Under mechanical stirring
Evaporation of Formation of Solid Organic solvent Microcapsules
Solvent evaporation technique is basically divided into ‘3’ different types of techniques –
i. Oilin Water Emulsion
In this system, the polymer is dissolved in an organic solvent such as Dichloromethane or Chloroform. The active principle/core dispersed in the same medium and then the entire mixture is emulsified in an aqueous solution containing emulsifier.
Factors governing the Encapsulation efficiency of drug –
a. Partition coefficient - The partitioning phenomena operates between the dispersed and the dispersing phases which contributes to a substantial lowering of microencapsulation efficiency.
b. Degree of ionization.
Strategy for improving Encapsulation Efficiency of Drug –
a. Water solubility of the drug can be reduced by chemical modification prior to its incorporation in the organic phase.
However, such structural modification may give rise to toxicological problems.
Modifications like,
a. Saturating the continuous phase with the drug b. Adjusting the pH of this same phase
c. Adding the elctrolytes
However the validity and effectiveness of these strategies vary from case to case. For example, chemical modification only concern to a limited number of active substances, and the saturation of external phase is only of value for low water soluble drugs or inexpensive drugs. Similarly, if the adjusting of pH can prove advantageous for ionization drugs, this procedure generally accelerates the degradation of some polymers.
ii. MultipleEmulsion : w/o/w
In these systems, active principles to be encapsulated are incorporated in an aqueous solution, which is poured into a casting organic solution of the polymer to form an emulsion of the type w/o. This primary emulsion is itself emulsified in an external aqueous phase leading to a multiple emulsion of the type w/o/w, the organic phase acts as a barrier between the two aqueous compartments preventing the diffusion of the medicine towards the aqueous phase.
Advantage – This process is more effective when the water solubility of the drug is high and partitioning between the organic phase is disfavourable.
Application – This process is used for encapsulation of drug which are strongly water soluble.
iii. Non-aqueous Emulsion : o/o emulsion
This technique is similar to o/w emulsion evaporation but dispersing medium can be constituted by a mineral or vegetable or a non-volatile organic solvent.
Advantage – This technique prevent hydrolysis of some drug
Mechanism of Solvent Evaporation Method
This system is characterized by the existence of several interfaces through which mass transfer occurs during particle formation, as shown in the below in figure.
Simple Emulsion Multiple Emulsion (o/w or o/o) (w/o/w)
Figure 1
Organic solvent of the dispersed phase of the emulsion is eliminated in two stages– 1. Diffusion of the solvent in the dispersing phase
2. Elimination of the solvent at dispersing phase – air interface
The formation of solid microcapsule is brought about by the evaporation of the volatile solvent L1 the interface L2/G. During the course of solvent evaporation, a
partitioning is produced across the interface L1 / L2 from the dispersed phase to
continuous phase leading to the formation of solid microcapsules.
Solvent – Extraction Method
As mentioned in the previous method, the organic solvent of the dispersed phase of the emulsion is eliminated in two stages, i.e.
i. Diffusion into continuous phase, and
ii. Elimination of solvent at continuous phase – air interface
If one uses a continuous phase which will immediately extract the solvent of the dispersed phase, the evaporation stage is no longer necessary in microencapsulation.
In practice it is achieved
a. by using large volume of dispersing phase w.t.o dispersed phase. Or
b. by choosing a cosolvents in dispersed phase, of which at least one has a great affinity for the dispersing phase. Or
TYPE ‘B’ PROCESSES
1. SprayDrying
In this process dispersing the core material in a liquefied coating substance and spraying this mixture into such an environment condition where by relatively rapid solidification of the coating is effected.
Advantage – Low cost of encapsulation and able to produce large amount of microcapsules.
Disadvantage – This process is limited to coating material soluble in water, but the list of water soluble coating materials are limited.
2. Fluidizedbed coating (Wurster Air Suspension)
It consists of the dispersing of solid core materials in a supporting air stream and then spray coating of the air suspended particles.
Advantage – Able to handle an extremely wide range of coating formulations.
3. Multi orifice – CentrifugalProcesses
In this process it utilizes centrifugal forces to hurl a core material particle through an enveloping microencapsulating membrane, thereby affecting mechanical microencapsulation.
4. PanCoating
The coating material solution is applied as a solution to the solid core material in a coating pan.
POLYMERS USED FOR MICROENCAPSULATION3
I. Water Soluble resins • Gelatin
• Starch
• Polyvinyl pyrrolidone
• Sodium carboxy methyl cellulose
• Hydroxy ethyl cellulose
• Methyl cellulose
• Arabinogalactam
• Polyvinyl alcohol
• Polyacrylic acid
II. Water Insoluble resins •Ethyl cellulose
•Polymethyl methacrylate (PMMA)
•Polymethacrylate (Eudragit)
•Polyethylene
•Polyamide (Nylon)
•Poly (Ethylene-vinyl acetate)
•Cellulose nitrate
•Silicones
•Poly(lactide-co-glycolide)
•Cellulose acetate butyrate
III. Waxes and Lipids • Paraffin
• Carnauba Wax
• Spermaceti
• Bees Wax
• Stearic Acid
• Stearyl Alcohol
• Glyceryl Stearates
IV. Enteric Resins •Shellac
•Cellulose acetate phthalate
MECHANISM OF DRUG RELEASE FROM MICROCAPSULES4
In the controlled release of drug from polymer-membrane permeation controlled drug delivery system, the drug particles are visualized as not being releasable from the device until the drug molecules on the outer most surface layer of a drug practice dissociate from their crystal lattice structure dissolve or partition into the surrounding polymer (in membrane), diffuse through it and finally partition into the elution medium surrounding drug delivery system.
This mechanistic analysis suggests that the solubility of a drug species in a rate-controlling membrane plays a rate controlling role in its release from a polymeric device. To release at an appropriate rate the drug requires adequate polymer solubility.
FACTOR INFLUENCING THE DESIGN OF ORAL SUSTAINED RELEASE PRODUCTS1, 5
A. Physicochemical Properties of Drug
i. Aqueous Solubility
Drugs with good aqueous solubility are the good candidates for oral sustained drug delivery system (SDDS). Whereas drugs with very low solubility (<0.01 mg/ml) are inherently sustained, since their release over the time course of a dosage form in the G.I.T will be limited by dissolution of drug.
ii. Partition Coefficient (PKo/w)
Drugs with extremely high PKo/w readily penetrate the biological membrane but are
unable to proceed further, while drugs with excessive aqueous solubility, i.e. low Pko/wcannot penetrate the membrane. Hence a balance in the PKo/w is needed.
iii. Drug Stability
Drugs that are unstable in the stomach can be placed in a slowly soluble form or have their release delayed until they reach the small intestine. However, such a strategy would be detrimental for drug that either unstable in the small intestine or undergo extensive gut-wall metabolism, as evidenced by reduced bioavailability when these drugs are administered from a SDDS.
If the drugs are having high degree of blood protein binding, then they are serve as a depot for drug producing a prolonged release profile.
B. Pharmacokinetic Characteristics of the Drug
i. Absorption
Drug for an oral SDDS its absorption rate must be efficient since the desired rate limiting step is rate of drug release Kr, i.e. Kr <<Ka. A drug with slow absorption
is a poor candidate for SDDS.
ii. Elimination of half-life
Drug with half-life in the range of 2-4 hrs make good candidates for such a system. For drugs with t ½ less than ‘2’ hrs, a very large dose may be required to maintain the high release rate. Similarly drugs with long t ½ need to be presented in such a formulation.
iii. Metabolism
Drug which is extensively metabolized is suitable for SDDS as long as the rate of metabolism is not too rapid. A drug capable of inducing or inhibiting metabolism is a poor candidate for SDDS. Since steady state blood level would be difficult to maintain.
iv. Dosage Form Index
It is the ratio of CSS,max to CSS,min. Since the goal of controlled release
formulation is to improve therapy by reducing the dosage form index while maintaining the plasma level within the therapeutic window, ideally its value should be closed one.
C. Pharmacodynamic Characteristics of the Drug
33, 34i. Therapeutic Range
ii. Plasma Drug Concentration – Response Relationship
Drug whose pharmacological activity is independent of its concentration are poor candidates for SDDS.
2. LITERATURE REVIEW
Ruiz, J.M. developed the procedure for the micro-encapsulation of peptide, a
study of the phase-separation of poly(D,L-Lacto acid-Co-glycolic acid) co-polymers 50/50 by silicon oil.12
Chowdary, K.P.R. demonstrated microencapsulation by calcium alginate. The
Pitchaimani, R. shown comparative evaluation of Norfloxacin containing
microcapsules by coacervation phase separation method. The release kinetics from the cellulose acetate micro capsules was found to be slower than that obtained from gelatin microcapsules.14
Chowdary, K.P.R. prepared the microcapsules of Nifedipine by solvent
evaporation method. The release depended on proportion of MCC in Solvent deposited systems used as core, coat, core ratio and size of microcapsules.15 Gohel, M.C. prepared Diclofenac sodium microspheres by emulsion solvent
evaporation technique. The stirring speed, polymer to drug ratio, concentration of ethyl cellulose solution and type of solvent were found to influence the in vitro drug release from the microspheres.16
Doshi, C.C. prepared the levonorgestrel loaded biodegradable microspheres by
emulsion solvent evaporation technique. The release kinetic of LNG from the microspheres was observed to be dependent on the ethanol content of the dissolution media.17
Hoffart, V. demonstrated micro-encapsulation of low molecular weight
Heparin. They shown encapsulation efficiency and release rate strongly depend on distribution of drug.18
Youan Celestin Bi-Botti. developed micro-encapsulation of superoxide
dismutase by reverse micelle solvent evaporation. This formulation allowed the in vitro release of superoxide dismutase for at least 72 hrs.19
Chowdary, K.P.R. prepared the mucoadhesive microcapsules of Indomethacin
by emulsification-ionic gelation process. They showed drug release was diffusion controlled and followed first order kinetics.20
Hasan, N.Y. demonstrated stability indicating methods for the determination of
Aceclofenac. Applciation of the proposed methods could be applied as stability indicating methods for the determination of pure aceclofenac and in presence of diclofenac either in the bulk powder or in pharmaceutical formulation.21
Fulzele, S.V. prepared and evaluated microcapsules using polymerized resin
and developed the in vitro dissolution study confirmed the Higuchi-order release pattern.22
Acuna, J.A. developed the polarographic behaviour of Aceclofenac in a
Assimopoulou, A.N. prepared the alkanin containing microcapsules by solvent
evaporation method and studied the high release rate and a great extent of particle size of alkanin microencapsulation.24
Murthy, T.E.G.K. developed the formulation and evaluation of Ethyl
cellulose-coated diclofenac sodium microcapsules and studied diclofenac release from the microcapsule was followed first order kinetics and influenced by the size of the microcapsules. Among the solvent employed chloroform was found to be more suitable for slow release of diclofenac from ethyl cellulose microcapsules.25 Sahoo, S.K. prepared stavudine by solvent evaporation method and studied that
the best fit release kinetics was achieved with Higuchi plot followed by Zero order and first order. The release of stavudine was influenced by the drug to polymer ratio and particle size was found to be diffusion controlled.26
Gowda, K.V. demonstrated the evaluation of bioequivalence of two
formulations containing 100 mg of aceclofenac and suggested that 90% confidence interval for the ratio of the logarithmic transformed AUCo-t, AUCo-∞
and Cmax were within the bioequivalence limit 0.80 – 1.25.27
Bolourtchian, N. studied on microencapsulation of Ibuprofen and discussed its
characterization.28
Yang, C. demonstrated the microencapsulation of Aspirin with Ethylcellulose
by solvent evaporation method.29
Sajeev, C. prepared oral controlled release formulation of Diclofenac sodium by
microencapsulation using Ethylcellulose.30
Rolland et al studied the characterization of microspheres using different
drugs.31
Dorle, A. K. studied microencapsulation using Eudragit polymer.32
Patel, J. K. reported formulation and evaluation of mucoadhesive Glipizide
microspheres.39
Shanmugum, S. reported analysis method for Aceclofenac.40
Mahaparale, P. R. reported analytical methods for estimation of Aceclofenac
with Paracetamol in tablet dosage form.41
Geetharao, C. G. reported studies on microspheres as targeting and controlled
3. DRUG & POLYMER PROFILE
3.1. DRUG PROFILE6, 7
1. Aceclofenac:
A. Physio-chemical Properties of the drug –
1. Description
a. Nomenclature
i. Chemical name
A phenyl acetic acid derivative
ii. Generic name Aceclofenac
b. Molecular weight and Formula Molecular weight = 354.19
2. Appearance, Colour
A white or almost white crystalline powder
3. Solubility
Solvent Solubility
Alcohol Soluble Acetone Freely soluble Water Practically insoluble Dichloromethane Sparingly soluble
2 PharmacokineticProperties38
i. Oral absorption - Rapidly absorbed ii. Bioavailability - Almost 100%
Cl
COOH
O NH
O
iii. Distribution - Highly protein – bound (>99.7%)
iv. Elimination -The mean plasma elimination half life is 4-4.3 hours. Clearance is estimated to 5 litres per hour. Approx. two-third of the administered dose is excreted via the urine, mainly as conjugated hydroxymetabolites. Only 1% of an oral single dose is excreted unchanged. Aceclofenac is probably metabolized via CYP2C9 to the main metabolite 4-hydroxy-Aceclofenac.
v. Dose - Maximum recommended dose is 200 mg daily takes as two separate 100 mg doses, one tablet in the morning and one in the evening. Aceclofenac can be taken before or after food.
vi. Therapeutic Indication - Symptomatic treatment of pain and inflammation of post traumatic pain, cervical pain and low back pain.
3 PharmacodynamicProperties35
a. Category
A novel non-steroidal anti-inflammatory drug.
b. Mechanism of Action
Aceclofenac is a novel NSAID known to exhibit multifactor mechanism of action. Aceclofenac was developed in order to provide a highly effective pain relieving therapy with a reduced side-effect profile, especially GI events that are frequently experienced with NSAID therapy.
a. Aceclofenac directly blocks PGE2 secretion at the site of inflammation by
inhibiting IL-Beta and TNF in the inflammatory cells (Intracellular action).
b. Aceclofenac stimulates the synthesis of the extracellular matrix of the Human Articular cartilages.
c. Aceclofenac inhibits Neutrophil Adhesion and Accumulation at the inflammatory site in the early phase and thus blocks the pro-inflammatory actions of Neutrophils.
c. Adverse effects
a. Mild to moderate liver cirrhosis
b. Renal impairment (mild to moderate)
3.2. POLYMER PROFILE
81. Ethyl Cellulose
i. Chemical name - Cellulose ethyl ether
ii. Description - It is a white, tasteless, free flowing powder iii. Functional category - Coating agent, tablet binder, tablet filler
iv. Solubility - Practically insoluble in water, freely soluble in Chloroform, soluble in dichloromethane
v. Applications - It is a good polymer which is more suitable in sustained Release formulation of most of the drug - It is water impermeable in nature
- For microencapsulation it is used in concentration of 10 to 20% (w/v)
- Ethyl cellulose coating is used to modify the release of a drug, to improve the stability of a formulation.
2. Poly-vinyl pyrolidone (PVP)
i. Functional category - Coating agent, tablet binder, tablet filler ii. Solubility - Soluble in acetone
iii. Application - PVP is used as a poreformer in the microcapsules due to its water permeability nature
4. OBJECTIVE
The main objective of the present studies is an effort to prolong the action of the drug Aceclofenac by formulating in microcapsules drug delivery system using different polymers and to explore suitability of the polymer for the same.
5. PLAN OF WORK
1. Preformulation studies.
i) Physical appearance. ii) Characterization of drug.
• UV Spectrum
• IR Spectrum
iii) Scanning and preparation of standard curve by Spectrophotometeric method.
2. Preparation of Aceclofenac micro-capsules using different polymers such as –
ii. Poly Vinyl Pyrrolidone
3. Evaluation of Aceclofenac microcapsules, such as
i. Determination of drug encapsulation efficiency ii. In vitro dissolution studies
iii. Particle size and shape determination iv. Drug – polymer compatibility study
- FTIR Study
6. EXPERIMENTAL WORK
6.1. PREFORMULATION STUDIES:
6.1.1. Physical appearance:
Aceclofenac is a white or almost white crystalline powder.
6.1.2. Characterization of drug:
50mg of the drug was dissolved in methanol and diluted to 100ml with the same solvent. 2ml of the solution was diluted to 50ml with methanol. Then it was examined between 220nm and 370nm wavelength. The solution showed an absorption maximum at 275nm. The specific absorbance at the maximum is 320-350nm.
Fig. 2: UV SPECTRUM OF ACECLOFENAC IN METHANOL
Infrared spectroscopy test:
The infrared spectrum of potassium bromide dispersion of Aceclofenac is in accordance with the reference spectrum.
SOLVENT CONCENTRATION λ max (in nm) ABSORBANCE
Fig. 3: IR SPECTRA OF ACECLOFENAC WITH MAJOR PEAKS AT 3333.10, 2935.76, 1720.56, 1523.36, 1313.57, 850.64
6.1.3. Scanning of the drug:
Aceclofenac was scanned in these solvents –
a. Methanol
b. Phosphate buffer (pH 7.2)
Scanning of Drug in Methanol
Aceclofenac was scanned in methanol as per European – Pharmacopoeial method. 10 mg of drug was dissolved in 100 ml of methanol. This gave the solution concentration of 100 mcg/ml used as a stock solution. Then it was further diluted to 30mcg/ml. The prepared solution was scanned in the UV region from 220-370 nm. A characteristic peak was observed at 275 nm.
Scanning of the Drug in phosphate buffer pH 7.2
10 mg of drug was dissolved in 100 ml of phosphate buffer pH 7.2. This gave the solution concentration of 100 mcg/ml used as a stock solution. Then it was further diluted to 30mcg / ml. The prepared solution was scanned in the UV region from 220-370 nm. A characteristic peak was observed at 275.4 nm.
6.1.4. Standard plot of drug with solvent methanol36
Concentration (mcg/ml)
Average Absorbance
5 0.147
10 0.293
15 0.458
20 0.653
25 0.807
(Each absorbance were taken in triplicate)
Standard Plot of Drug with phosphate buffer (pH 7.2)
Accurately weighed 10mg of drug was dissolved in 100ml phosphate buffer. Then diluting it 2.5, 5, 7.5, 10, 12.5, 15 ml to 50ml respectively. This gave the concentration of 5, 10, 15, 20, 25, 30 mcg/ml and the absorbance were taken against the λmax 275.4 nm.
Concentration (mcg/ml)
Average Absorbance
5 0.136
10 0.275
15 0.392
20 0.508
30 0.764 (Each absorbance were taken in triplicate)
By regression analysis, Correlation coefficient R2
= 0.9992
Instruments and equipments used:
• Shimadzu UV-Pharmaspec 1700: UV Visible spectrophotometer.
• Mettler Toledo, Semi Micro Analytical balance. Model- AB104-s
• Systronics,µ-pH Meter, Model-361
• Magnetic Stirrer, Indian Equipment Corporation, Mumbai.
• FTIR, Shimadzu-Prestige-21.
• Lab India dissolution apparatus.
6.2. PREPARATION OF ACECLOFENAC MICROCAPSULES37
1. Materials
a) Aceclofenac obtained as a gift sample from IPCA Laboratories Ltd., Mumbai. b) Ethyl cellulose
c) Polyvinyl pyrrolidone d) Methanol
e) Dichloromethane f) Acetone
g) Light liquid paraffin h) Cyclohexane
i) Span 80
2. Method (Solvent evaporation method)
(i) Procedure
Different amount of polymer was dissolved in a solvent (acetone) using magnetic stirrer, to form a homogeneous polymer solution. The drug was dispersed in the polymer solution. The resulting dispersion was then poured in to the mixture of light liquid paraffin, cyclohexane and Span 80, while stirring. A mechanical stirrer was used for stirring. Stirring (at 800 to 1000 rpm) was continued for 3 hrs., until the solvent evaporated completely. After evaporation of solvent, the microcapsules formed were filtered using Whatmann filter paper (No. 1 grade). The residue was washed with 4 - 5 times in 50 ml cyclohexane each. Micro capsules were dried in desiccators for 24 hrs.
(ii) Formulation
Table 1: Formulation of Microencapsulation of Aceclofenac
S.No.
Ratio Drug : Polymer
Type of Polymer
Drug (mg)
Amount of Polymer
Solvent Acetone(ml)
Polymer conc. in
solvent (% w/v)
External phase
1 1:1 Ethyl
cellulose
500 500 10 5 Liquid
2 1:2 -do- 500 1000 10 10
3 1:3 -do- 500 1500 10 15
4 1:2 PVP 500 1000 10 10
5 1:3 -do- 500 1500 10 15
6 1:4 -do- 500 2000 10 20
S.No.
Ratio Drug : polymer
Solvent
Concentration of polymer in
solvent (% w/v)
External
phase Emulsifier
Emulsifier concentration
( %v/v) Result
Micro encapsulation
efficiency (% w/v) (± S.D)
1 1:6
Acetone
30
Liquid
paraffin Span 80
1.96 Failure …………..
2 1:4 20 1.96 Failure …………..
3 1:3 15 1.96 Encapsulated 80.40±0.9848
4 1:2 10 1.96 Encapsulated 94.45±0.901
5 1:1 5 1.96 Encapsulated 96.01±0.115
6 1:1 5 1.96 Failure …………..
6.3.
Above mentioned all the trials were done in triplicate batches
Table 3: DIFFERENT TRIALS FOR MICRO-ENCAPSULATION WITH POLYVINYL PYRROLIDONE (PVP)
S.No.
Ratio Drug : polymer
Solvent
Concentration of polymer in
solvent (% w/v)
External
phase Emulsifier
Emulsifier concentration
( %v/v) Result
Micro encapsulation
efficiency (% w/v) (± S.D)
1 1:1
Acetone
5
Liquid
paraffin Span 80
0.99 Failure …………..
2 1:2 10 0.99 Encapsulated 92.5±1.135
3 1:3 15 0.99 Encapsulated 60.1±1.153
4 1:4 20 0.99 Encapsulated 46.44±0.787
6.4. EVALUATION OF ACECLOFENAC MICROCAPSULES
i. Determination of Encapsulation efficiency of microcapsules:
Accurately weighed microcapsules containing 5mg equivalent amount of Aceclofenac was dissolved in the 50ml methanol and shaken vigorously. Then undissolved particles are removed by filtering through Whatmann filter paper. Finally 5 ml of this solution is diluted to 50 ml with respective blank solution and then its UV absorbance is to be noted.
Then the encapsulation efficiency is calculated by using the given below equation
Encapsulation efficiency = x 100
ii. Dissolution Rate study:
The in-vitro release studies of microcapsules were carried out at 37±1ºc temperature and 100 rpm using phosphate buffer pH 7.2 in USP dissolution test apparatus (type II). Accurately weight samples of microcapsules (containing approximately 50 mg of drug) are taken in the muslin cloth ant tied properly to the paddles of the dissolution test apparatus, USP. 900 ml of dissolution media were used for analysis. The microcapsules were added to dissolution medium and at present time intervals 5 ml aliquots were withdrawn and replaced by an equal volume of fresh dissolution medium. Then it was further diluted up to 10 ml by taking 2ml of sample. After suitable dilution the sample were analyzed spectrophotometrically at 275.4 nm.
iii. Particle size analysis:
The prepared microcapsules were examined by optical microscopy using eye-piece micrometer. The eye-piece is calibrated with the help of stage micrometer. The mean diameter and particle size distribution of each formulation were measured by determination of the martin’s diameter of 100 randomly selected particles.
iv. Drug-Polymer Compatibility Study
Drug-polymer compatibility is a critical parameter or factor to evaluate the efficiency of a formulation. For a stable and effective formulation, the drug-polymer interaction should be least. Despite of all the methods used for evaluation of drug-polymer interaction studies; the following two methods have been employed.
FT-IR spectroscopy: In this method the spectra were recorded for pure drug and drug loaded microcapsules using the instrument IR-Prestige-21, Shimadzu, Japan, employing KBr disc method. The scanning range was 400-4000 cm-1
and the resolution was 1 cm-1
7. RESULTS AND DISCUSSIONS
7.1
Characterization of bulk drug:
Supplied drug Aceclofenac passed the test for identification and analysis.
7.2
Preparation of microcapsule:
Ethylcellulose polymer was able to microencapsulate the drug Aceclofenac when the solvent for polymeric solution was acetone and external phase is containing Span 80 as an emulsifier. Also Ethylcellulose was able to encapsulate the drug when the concentration of the polymer was (5-15) % w/v in solvent.
The PVP polymer was able to microcapsulate the drug when the external phase was containing liquid paraffin. However, the PVP was able to encapsulate the drug only above 10% w/v and unable to encapsulate below it i.e 10% w/v.
7.3
Morphological and Microscopic characterization of
Microcapsules:
A. Morphological characterization:
The Ethylcellulose microcapsules were freely flowing, white colored particles whereas PVP microcapsule were slightly aggregated particles.
B. Microscopic characterization:
Fig. 4: Photograph of Ethylcellulose Microcapsules with drug:polymer ratio 1:1
[image:47.612.179.469.417.695.2]Fig. 6: Photograph of Ethylcellulose Microcapsules with drug:polymer ratio 1:2
[image:48.612.179.466.395.690.2]Fig. 8: Photograph of PVP Microcapsules with drug:polymer ratio 1:2
[image:49.612.189.460.412.677.2]7.4
IN VITRO DISSOLUTION STUDIES
DISSOLUTION TEST—1
Polymer: Ethyl Cellulose
Ratio: 1:1 Apparatus: Paddle with muslin cloth Polymer concentration: 5% (w/v) R.P.M: 100
Encapsulation efficiency: 96.0165% Volume: 900ml
Micro capsules weight: Media: Phosphate buffer (pH 7.2) 1. 100mg Temperature: 37±1o
C 2. 100mg
3. 100mg
Sampling volume = 5ml
Table 4: Results of Dissolution Test-1
TIME (hrs) Absorbance (A1,A2,A3) Concn (mg/ml) Amount of drug release in 900 ml (mg) Corrn factor (mg) Cumul. amount of drug release (mg) Cumul. release (mg) Mean± S.D. Cumul. % release Mean± S.D. 1
0.092 0.00653 5.87857 - 5.87857
6.97381± 2.67388
7.26362± 2.78500 0.08 0.00557 5.02142 - 5.02142
0.15 0.01113 10.0214 - 10.0214 2
0.342 0.02637 23.7357 0.03265 23.7683
22.6077± 1.03245
23.5473± 1.07536 0.321 0.02470 22.2357 0.02789 22.2636
0.314 0.02415 21.7357 0.05567 21.7913 3
0.452 0.03510 31.5928 0.16452 31.7573
31.7807± 0.80918
33.1015± 0.84281 0.464 0.03605 32.45 0.15142 32.6014
0.441 0.03423 30.8071 0.17642 30.9835 4
0.52 0.0405 36.45 0.34004 36.7900
36.9564± 0.22334
38.4922± 0.23262 0.526 0.04097 36.8785 0.33170 37.2102
0.521 0.04057 36.5214 0.34757 36.8690 6
0.669 0.05232 47.0928 0.54254 47.6354
48.1125± 0.95769
50.1117± 0.99749 0.667 0.05216 46.95 0.53658 47.4865
0.691 0.05407 48.6642 0.55047 49.2147 8
0.805 0.06311 56.8071 0.80416 57.6113
58.2336± 0.55470
60.6537± 0.57775 0.82 0.06431 57.8785 0.79742 58.6759
0.816 0.06399 57.5928 0.82083 58.4136 10
0.96 0.07542 67.8785 1.11976 68.9983
69.8622± 0.76378
72.7655± 0.79553 0.976 0.07669 69.0214 1.11896 70.1404
0.98 0.07700 69.3071 1.14079 70.4479 12
1.123 0.08835 79.5214 1.49686 81.0182
81.4821± 0.968412
84.8684± 1.008657 1.145 0.090103 81.09286 1.502421 82.59528
DISSOLUTION TEST— 2
Polymer: Ethyl Cellulose
Ratio: 1:2 Apparatus: Paddle with muslin cloth Polymer concentration: 10% (w/v) R.P.M: 100
Encapsulation efficiency: 94.454% Volume: 900ml
Micro capsules weight: Media: Phosphate buffer (pH 7.2) 4. 100mg Temperature: 37±1oC
5. 100mg 6. 100mg
Sampling volume = 5ml
Table 5: Results of Dissolution Test-2
TIME (hrs) Absorbance (A1,A2,A3) Concn (mg/ml) Amount of drug release in 900 ml (mg) Corrn factor (mg) Cumul. amount of drug release (mg) Cumul. release (mg) Mean± S.D. Cumul. % release Mean± S.D. 1
0.0968 0.006913 6.221429 - 6.221429
5.95238± 0.466004
6.3021± 0.493387 0.0855 0.006016 5.414286 - 5.414286
0.0968 0.006913 6.221429 - 6.221429 2
0.344 0.026532 23.87857 0.034563 23.91313
23.1259± 0.682799
24.4848± 0.722921 0.327 0.025183 22.66429 0.030079 22.69437
0.328 0.025262 22.73571 0.034563 22.77028 3
0.4 0.030976 27.87857 0.167222 28.04579
30.3494± 2.69979
32.1328± 2.858434 0.474 0.036849 33.16429 0.155992 33.32028
0.423 0.032802 29.52143 0.160873 29.6823 4
0.52 0.0405 36.45 0.322103 36.7721
36.9457± 0.239377
39.1167± 0.253444 0.526 0.040976 36.87857 0.340238 37.21881
0.521 0.040579 36.52143 0.324881 36.84631 6
0.769 0.060262 54.23571 0.524603 54.76032
53.8158± 0.896023
56.9781± 0.948674 0.754 0.059071 53.16429 0.545119 53.7094
0.744 0.058278 52.45 0.527778 52.97778 8
0.906 0.071135 64.02143 0.825913 64.84734
64.5166± 1.23724
68.3076± 1.309942 0.882 0.06923 62.30714 0.840476 63.14762
0.916 0.071929 64.73571 0.819167 65.55488 10
1.06 0.083357 75.02143 1.181587 76.20302
75.4180± 4.096422
79.8497± 4.337133 1.1 0.086532 77.87857 1.186627 79.0652
0.987 0.077563 69.80714 1.17881 70.98595 12
1.2123 0.095444 85.9 1.598373 87.49837
85.8852± 2.74811
90.9319± 2.909592 1.145 0.090103 81.09286 1.619286 82.71214
DISSOLUTION TEST— 3
Polymer: Ethyl Cellulose
Ratio: 1:3 Apparatus: Paddle with muslin cloth Polymer concentration: 15% (w/v) R.P.M: 100
Encapsulation efficiency: 80.4086% Volume: 900ml
Micro capsules weight: Media: Phosphate buffer (pH 7.2) 7. 100mg Temperature: 37±1oC
8. 100mg 9. 100mg
Sampling volume = 5ml
Table 6: Results of Dissolution Test-3
TIME (hrs) Absorbance (A1,A2,A3) Concn (mg/ml) Amount of drug release in 900 ml (mg) Corrn factor (mg) Cumul. amount of drug release (mg) Cumul. release (mg) Mean± S.D. Cumul. % release Mean± S.D. 1
0.079 0.0055 4.95 4.95
7.49761± 3.525659
9.32539± 4.385094 0.094 0.00669 6.021429 6.021429
0.171 0.012802 11.52143 11.52143 2
0.263 0.020103 18.09286 0.0275 18.12036
18.4678± 1.029679
22.9696± 1.280679 0.284 0.02177 19.59286 0.033452 19.62631
0.256 0.019548 17.59286 0.064008 17.65687 3
0.416 0.032246 29.02143 0.128016 29.14944
31.9749± 2.499506
39.7693± 3.108799 0.468 0.036373 32.73571 0.142302 32.87802
0.482 0.037484 33.73571 0.161746 33.89746 4
0.502 0.039071 35.16429 0.289246 35.45353
36.3422± 0.887108
45.2012± 1.103354 0.514 0.040024 36.02143 0.324167 36.3456
0.526 0.040976 36.87857 0.349167 37.22774 6
0.605 0.047246 42.52143 0.484603 43.00603
45.1614± 2.426671
56.1702± 3.01821 0.628 0.049071 44.16429 0.524286 44.68857
0.671 0.052484 47.23571 0.554048 47.78976 8
0.786 0.061611 55.45 0.720833 56.17083
54.7427± 3.289359
68.087± 4.091191 0.798 0.062563 56.30714 0.769643 57.07679
0.712 0.055738 50.16429 0.816468 50.98075 10
0.825 0.064706 58.23571 1.028889 59.2646
59.9950± 1.099414
74.6197± 1.367413 0.827 0.064865 58.37857 1.08246 59.46103
0.852 0.066849 60.16429 1.095159 61.25944 12
0.971 0.076294 68.66429 1.352421 70.01671
68.7271± 1.249375
85.4804± 1.55393 0.951 0.074706 67.23571 1.406786 68.6425
DISSOLUTION TEST— 4
Polymer: Poly vinyl pyrrolidone
Ratio: 1:2 Apparatus: Paddle with muslin cloth Polymer concentration: 10% (w/v) R.P.M: 100
Encapsulation efficiency: 92.50% Volume: 900ml
Micro capsules weight: Media: Phosphate buffer (pH 7.2) 10. 100mg Temperature: 37±1oC
11. 100mg 12. 100mg
[image:54.612.94.557.261.682.2]Sampling volume = 5ml
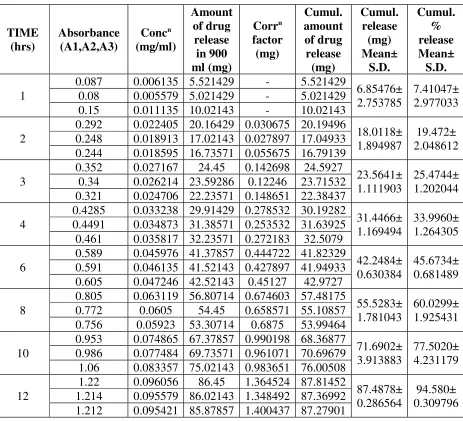
Table 7: Results of Dissolution Test-4
TIME (hrs) Absorbance (A1,A2,A3) Concn (mg/ml) Amount of drug release in 900 ml (mg) Corrn factor (mg) Cumul. amount of drug release (mg) Cumul. release (mg) Mean± S.D. Cumul. % release Mean± S.D. 1
0.087 0.006135 5.521429 - 5.521429
6.85476± 2.753785
7.41047± 2.977033 0.08 0.005579 5.021429 - 5.021429
0.15 0.011135 10.02143 - 10.02143 2
0.292 0.022405 20.16429 0.030675 20.19496
18.0118± 1.894987
19.472± 2.048612 0.248 0.018913 17.02143 0.027897 17.04933
0.244 0.018595 16.73571 0.055675 16.79139 3
0.352 0.027167 24.45 0.142698 24.5927
23.5641± 1.111903
25.4744± 1.202044 0.34 0.026214 23.59286 0.12246 23.71532
0.321 0.024706 22.23571 0.148651 22.38437 4
0.4285 0.033238 29.91429 0.278532 30.19282
31.4466± 1.169494
33.9960± 1.264305 0.4491 0.034873 31.38571 0.253532 31.63925
0.461 0.035817 32.23571 0.272183 32.5079 6
0.589 0.045976 41.37857 0.444722 41.82329
42.2484± 0.630384
45.6734± 0.681489 0.591 0.046135 41.52143 0.427897 41.94933
0.605 0.047246 42.52143 0.45127 42.9727 8
0.805 0.063119 56.80714 0.674603 57.48175
55.5283± 1.781043
60.0299± 1.925431 0.772 0.0605 54.45 0.658571 55.10857
0.756 0.05923 53.30714 0.6875 53.99464 10
0.953 0.074865 67.37857 0.990198 68.36877
71.6902± 3.913883
77.5020± 4.231179 0.986 0.077484 69.73571 0.961071 70.69679
1.06 0.083357 75.02143 0.983651 76.00508 12
1.22 0.096056 86.45 1.364524 87.81452
87.4878± 0.286564
94.580± 0.309796 1.214 0.095579 86.02143 1.348492 87.36992
DISSOLUTION TEST— 5
Polymer: Poly vinyl pyrrolidone
Ratio: 1:3 Apparatus: Paddle with muslin cloth Polymer concentration: 15% (w/v) R.P.M: 100
Encapsulation efficiency: 60.10% Volume: 900ml
Micro capsules weight: Media: Phosphate buffer (pH 7.2) 13. 100mg Temperature: 37±1oC
14. 100mg 15. 100mg
[image:55.612.96.547.265.682.2]Sampling volume = 5ml
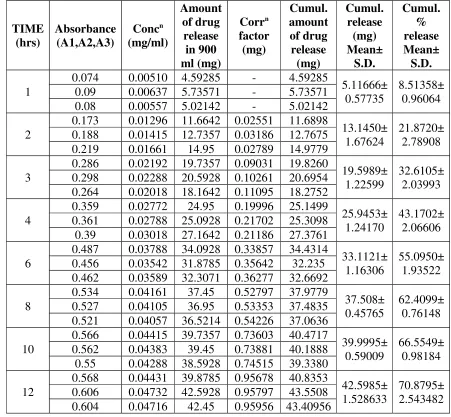
Table 8: Results of Dissolution Test-5
TIME (hrs) Absorbance (A1,A2,A3) Concn (mg/ml) Amount of drug release in 900 ml (mg) Corrn factor (mg) Cumul. amount of drug release (mg) Cumul. release (mg) Mean± S.D. Cumul. % release Mean± S.D. 1
0.074 0.00510 4.59285 - 4.59285
5.11666± 0.57735
8.51358± 0.96064 0.09 0.00637 5.73571 - 5.73571
0.08 0.00557 5.02142 - 5.02142 2
0.173 0.01296 11.6642 0.02551 11.6898
13.1450± 1.67624
21.8720± 2.78908 0.188 0.01415 12.7357 0.03186 12.7675
0.219 0.01661 14.95 0.02789 14.9779 3
0.286 0.02192 19.7357 0.09031 19.8260
19.5989± 1.22599
32.6105± 2.03993 0.298 0.02288 20.5928 0.10261 20.6954
0.264 0.02018 18.1642 0.11095 18.2752 4
0.359 0.02772 24.95 0.19996 25.1499
25.9453± 1.24170
43.1702± 2.06606 0.361 0.02788 25.0928 0.21702 25.3098
0.39 0.03018 27.1642 0.21186 27.3761 6
0.487 0.03788 34.0928 0.33857 34.4314
33.1121± 1.16306
55.0950± 1.93522 0.456 0.03542 31.8785 0.35642 32.235
0.462 0.03589 32.3071 0.36277 32.6692 8
0.534 0.04161 37.45 0.52797 37.9779
37.508± 0.45765
62.4099± 0.76148 0.527 0.04105 36.95 0.53353 37.4835
0.521 0.04057 36.5214 0.54226 37.0636 10
0.566 0.04415 39.7357 0.73603 40.4717
39.9995± 0.59009
66.5549± 0.98184 0.562 0.04383 39.45 0.73881 40.1888
0.55 0.04288 38.5928 0.74515 39.3380 12
0.568 0.04431 39.8785 0.95678 40.8353
42.5985± 1.528633
70.8795± 2.543482 0.606 0.04732 42.5928 0.95797 43.5508
DISSOLUTION TEST— 6
Polymer: Poly vinyl pyrrolidone
Ratio: 1:4 Apparatus: Paddle with muslin cloth Polymer concentration: 20% (w/v) R.P.M: 100
Encapsulation efficiency: 46.44% Volume: 900ml
Micro capsules weight: Media: Phosphate buffer (pH 7.2) 16. 100mg Temperature: 37±1oC
17. 100mg 18. 100mg
[image:56.612.98.546.279.697.2]Sampling volume = 5ml
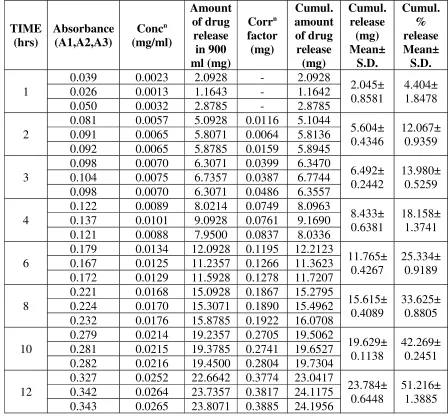
Table 9: Results of Dissolution Test-6
TIME (hrs) Absorbance (A1,A2,A3) Concn (mg/ml) Amount of drug release in 900 ml (mg) Corrn factor (mg) Cumul. amount of drug release (mg) Cumul. release (mg) Mean± S.D. Cumul. % release Mean± S.D. 1
0.039 0.0023 2.0928 - 2.0928
2.045± 0.8581
4.404± 1.8478 0.026 0.0013 1.1643 - 1.1642
0.050 0.0032 2.8785 - 2.8785 2
0.081 0.0057 5.0928 0.0116 5.1044
5.604± 0.4346
12.067± 0.9359 0.091 0.0065 5.8071 0.0064 5.8136
0.092 0.0065 5.8785 0.0159 5.8945 3
0.098 0.0070 6.3071 0.0399 6.3470
6.492± 0.2442
13.980± 0.5259 0.104 0.0075 6.7357 0.0387 6.7744
0.098 0.0070 6.3071 0.0486 6.3557 4
0.122 0.0089 8.0214 0.0749 8.0963
8.433± 0.6381
18.158± 1.3741 0.137 0.0101 9.0928 0.0761 9.1690
0.121 0.0088 7.9500 0.0837 8.0336 6
0.179 0.0134 12.0928 0.1195 12.2123
11.765± 0.4267
25.334± 0.9189 0.167 0.0125 11.2357 0.1266 11.3623
0.172 0.0129 11.5928 0.1278 11.7207 8
0.221 0.0168 15.0928 0.1867 15.2795
15.615± 0.4089
33.625± 0.8805 0.224 0.0170 15.3071 0.1890 15.4962
0.232 0.0176 15.8785 0.1922 16.0708 10
0.279 0.0214 19.2357 0.2705 19.5062
19.629± 0.1138
42.269± 0.2451 0.281 0.0215 19.3785 0.2741 19.6527
0.282 0.0216 19.4500 0.2804 19.7304 12
0.327 0.0252 22.6642 0.3774 23.0417
23.784± 0.6448
51.216± 1.3885 0.342 0.0264 23.7357 0.3817 24.1175
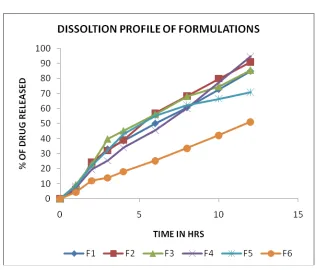
Table 10 : DISSOLUTION PROFILE OF FORMULATIONS
Figure 11: DISSOLUTION PROFILE OF FORMULATIONS TIME
(IN HRS)
CUMULATIVE % OF DRUG RELEASED
F1 F2 F3 F4 F5 F6
0 0 0 0 0 0 0
The percentage release of the drug from microcapsules formulated using different drug to polymer ratios was calculated using the following formula:
Cumulative amount of drug release
Percentage release = X 100
[image:58.612.104.548.291.523.2]Encapsulation efficiency
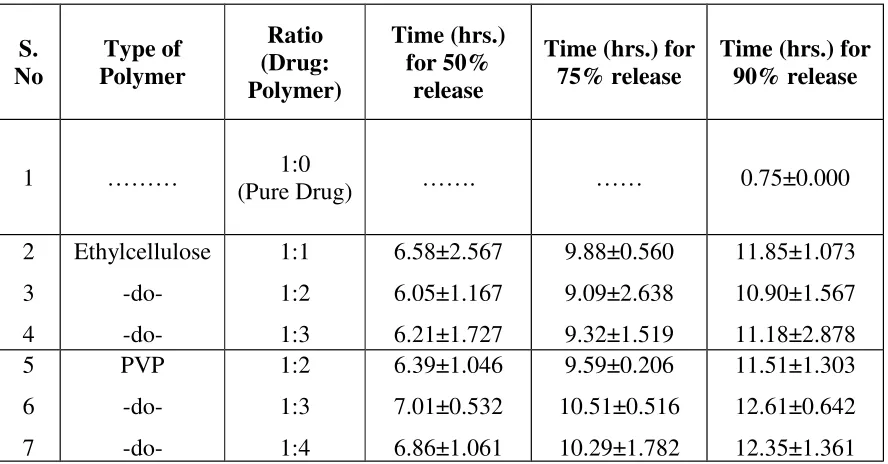
Table 11:Results of Dissolution test for microcapsules prepared using different Drug-Polymer ratio. S. No Type of Polymer Ratio (Drug: Polymer) Time (hrs.) for 50% release
Time (hrs.) for 75% release
Time (hrs.) for 90% release
1 ……… 1:0
(Pure Drug) ……. …… 0.75±0.000
2 3 4 Ethylcellulose -do-1:1 1:2 1:3 6.58±2.567 6.05±1.167 6.21±1.727 9.88±0.560 9.09±2.638 9.32±1.519 11.85±1.073 10.90±1.567 11.18±2.878 5 6 7 PVP -do-1:2 1:3 1:4 6.39±1.046 7.01±0.532 6.86±1.061 9.59±0.206 10.51±0.516 10.29±1.782 11.51±1.303 12.61±0.642 12.35±1.361 Note: All the ratios were done in triplicate batches.
Calculations for above
results:-The above time taken for 50% or 75% or 90% release of drug is determined by y = mx + c,
Where, m = slope of the respective dissolution release rate curve. C = intercept of the respective dissolution release rate curve
The following are the tables for determining the kinetic model of release of the drug from microcapsules.
Table 12: Drug released kinetic model of Ethyl cellulose Microcapsules (1:1 Ratio)
Figure 12: Drug released kinetic model of Ethyl cellulose Microcapsules (1:1 Ratio)
S. No.
Time (hrs)
Square route of
Time
% Drug Released
% Drug Unreleased
Log % Drug Unreleased
Cube root of %Drug Unreleased
1 0 0 0 100 2 4.641589
2 1 1 6.30215 93.69785 1.97173 4.541959
[image:60.612.107.543.70.593.2]3 2 1.414214 24.48483 75.51517 1.878034 4.226797 4 3 1.732051 32.13283 67.86717 1.83166 4.078996 5 4 2 39.11672 60.88328 1.784498 3.933985 6 6 2.44949 56.97812 43.02188 1.633689 3.503992 7 8 2.828427 68.30769 31.69231 1.500954 3.164594 8 10 3.162278 79.84971 20.15029 1.304281 2.7212 9 12 3.464102 90.93196 9.068038 0.957513 2.085312
Figure 13: Drug released kinetic model of Ethyl cellulose Microcapsules (1:2 Ratio)
S. No.
Time (hrs)
Square route of
Time
% Drug Released
% Drug Unreleased
Log % Drug Unreleased
Cube root of %Drug Unreleased
1 0 0 0 100 2 4.641589
2 1 1 9.325397 90.6746 1.957486 4.492574
3 2 1.414214 22.96967 77.03033 1.886662 4.254879 4 3 1.732051 39.76937 60.23063 1.779817 3.919877
5 4 2 45.20129 54.79871 1.73877 3.798307
6 6 2.44949 56.17027 43.82973 1.641769 3.525789 7 8 2.828427 68.0872 31.9128 1.503965 3.171916 8 10 3.162278 74.61975 25.38025 1.404496 2.938768 9 12 3.464102 85.48047 14.51953 1.161952 2.439594
[image:61.612.115.532.232.564.2]Figure 14: Drug released kinetic model of Ethyl cellulose Microcapsules (1:3 Ratio)
S. No.
Time (hrs)
Square route of
Time
% Drug Released
% Drug Unreleased
Log % Drug Unreleased
Cube root of %Drug Unreleased
1 0 0 0 100 2 4.641589
2 1 1 7.410473 92.58953 1.966562 4.523979 3 2 1.414214 19.4721 80.5279 1.905946 4.318326 4 3 1.732051 25.47446 74.52554 1.872305 4.208252
5 4 2 33.99601 66.00399 1.81957 4.041321
[image:62.612.106.545.118.556.2]6 6 2.44949 45.67349 54.32651 1.735012 3.787366 7 8 2.828427 60.02997 39.97003 1.601735 3.419098 8 10 3.162278 77.50209 22.49791 1.352142 2.823021 9 12 3.464102 94.5804 5.419598 0.733967 1.756531
Figure 15: Drug released kinetic model of PVP Microcapsules (1:2 Ratio)
Table 16: Drug released kinetic model of PVP Microcapsules (1:3 Ratio)
S. No.
Time (hrs)
Square route of
Time
% Drug Released
% Drug Unreleased
Log % Drug Unreleased
Cube root of %Drug Unreleased
1 0 0 0 100 2 4.641589
2 1 1 8.513588 91.48641 1.961357 4.505941 3 2 1.414214 21.87203 78.12797 1.892807 4.274994 4 3 1.732051 32.61051 67.38949 1.828592 4.069403 5 4 2 43.17027 56.82973 1.754576 3.844665 6 6 2.44949 55.09504 44.90496 1.652294 3.554388 7 8 2.828427 62.40998 37.59002 1.575073 3.349841 8 10 3.162278 66.55495 33.44505 1.524332 3.221889 9 12 3.464102 70.87951 29.12049 1.464199 3.076566
Figure 16: Drug released kinetic model of PVP Microcapsules (1:3 Ratio)
S. No.
Time (hrs)
Square root of Time
% Drug Released
% Drug Unreleased
Log % Drug Unreleased
Cube root of %Drug Unreleased
1 0 0 0 100 2 4.641589
2 1 1 4.404044 95.59596 1.98044 4.572424
[image:64.612.115.532.277.567.2]3 2 1.414214 12.06766 87.93234 1.944149 4.44682 4 3 1.732051 13.98026 86.01974 1.934598 4.414343 5 4 2 18.15898 81.84102 1.912971 4.341672 6 6 2.44949 25.33411 74.66589 1.873122 4.210892 7 8 2.828427 33.6252 66.3748 1.822003 4.048875 8 10 3.162278 42.2692 57.7308 1.761408 3.864879 9 12 3.464102 51.21654 48.78346 1.688273 3.653907
Figure 17: Drug released kinetic model of PVP Microcapsules (1:4 Ratio)
Drug Release Kinetic Model Report
S. No.
Type of polymer
Ratio Drug:Polymer
Correlation coefficient factor for drug release profiles(R1)
Zero order
First
order Higuchi
Hixon Crowell
1. Ethyl
cellulose 1:1 0.9526 0.9673 0.9932 0.9876
2. -do- 1:2 0.9641 0.9602 0.9973 0.9910
3. -do- 1:3 0.9004 0.9857 0.9877 0.9884
4. PVP 1:2 0.9957 0.8470 0.9728 0.9315
5. -do- 1:3 0.8476 0.9734 0.9700 0.9556
6. -do- 1:4 0.9935 0.9872 0.9728 0.9924
7.6 Particle Size Analysis:
Table 19: Particle size analysis of Ethyl cellulose micro capsules (1:1 Ratio)
S.No. Size Range (micro meter)
Mean size range (micro meter)
No.of particles
(Frequency) nd nd
2
nd3
1. 0-50 25 1 25 625 15625
2. 50-100 75 8 600 45000 3375000
3. 100-150 125 12 1500 187500 23437500
4. 150-200 175 34 5950 1041250 1.82x10⁸
5. 200-250 225 28 6300 1417500 3.19 x10⁸
6. 250-300 275 10 2750 756250 2.08 x10⁸
7. 300-350 325 7 2275 739375 2.4 x10⁸
∑n=100 ∑nd=
19400
∑nd2
= 4187500
∑nd3
=
9.7625 x10⁸
S.No.
Equation for calculating diameter
mean
Type of mean Size parameter Frequency Mean di