by
Lualhati Espinoza Dungca
A dissertation submitted in partial fulfillment of the requirements for the degree of Master of Arts in Demography in the Australian
National University
D E C L A R A T I O N
Except where otherwise indicated, this dissertation is my own work.
L.E. Dungca
This thesis was carried out while I was studying at the Australian National University on a Colombo Plan scholarship offered by the Government of Australia. I am grateful to Director Tito Mijares for recommending me for this scholarship, and the Government and people of Australia for their generosity.
I wish to thank wholeheartedly the various people who
from Metropolitan Manila between 1970 and 1975 using a five per cent sample of the 1975 Census as the principal source of data. Measures are presented of the levels of migration to and from Metropolitan Manila (a) from one region to another, (b) from the urban areas to the rural areas and (c) from one Metropolitan Manila city/municipality to another. Also, the age-sex
A B S T R A C T ... iv
LIST OF TABLES ... vii
LIST OF FIGURES ... ix
CHAPTER 1 INTRODUCTION ... 1
1.1 The S e t t i n g ... 1
1.2 Studies on Internal Migration in the Philippines ... 5
1.3 Objectives and Structure of the Study ... 7
1.4 The Data 8 2 MIGRATION MODELS AND THEORIES ... 15
2.1 Gravity Models ... 16
2.2 Economic M o d e l s ... 16
2.3 General Models and Theories ... 17
3 SPATIAL VARIATIONS IN LEVELS OF MIGRATION .. 21
3.1 Regional Variations ... 21
3.2 Urban-Rural Variations ... 36
3.3 Metropolitan Manila Area Variations .. 41
4 CHARACTERISTICS OF MIGRANTS ... 48
4.1 A g e - S e x ... 48
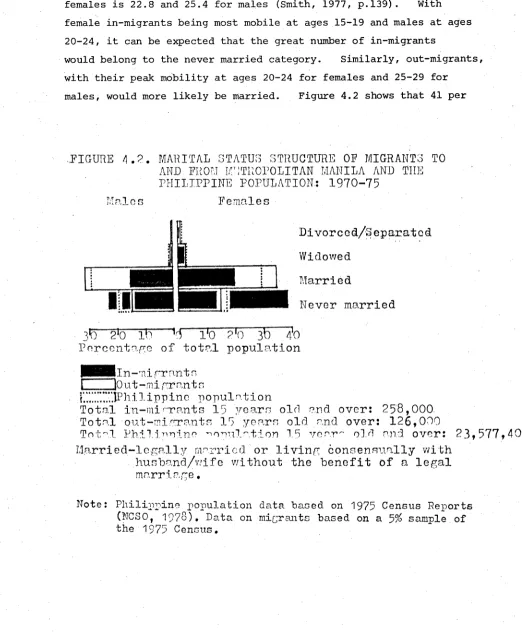
4.2 Marital Status ... 53
4.3 Education ... 54
4.4 Usual Occupation ... 56
4.5 Spatial Differentials ... 60
Page CHAPTER
5 SUMMARY AND CONCLUDING REMARKS ... 71 5.1 S u m m a r y ... 71 5.2 Implications... 74 5.3 Limitations and Further
D e v e l o p m e n t ... 75
BIBLIOGRAPHY 76
APPENDIX 84
Table Title Page 1.1 Application of Myer's Method to Age
Data for Males and Females According to
the Philippine Census of 1975... 12 1.2 Computation of Age-Accuracy Index by the
United Nations Secretariat Method Using
the Philippine Census of 1975 14 3.1 In- and Out-Migration Percentage
Distribution and Rates for Metropolitan Manila, by Island Group and Region :
1970-75 23
3.2 Simple and Multiple Correlation Coefficients and Percentage of Variation Explained for Regressions of Volume of In- and Out-Migration on Some Regional Variables :
1970-75 27
3.3 Metropolitan Manila In- and Out-Migration Percentage Distribution and Rates, by Urban and Rural Area of Origin and Destination :
1970-75 39
3.4 Percentage Distribution of Migrants and Migration Rates to the Cities and
Municipalities of Metropolitan Manila :
1970-75 43
3.5 Percentage Distribution of Migrants and Migration Rates from Manila and Urban
4.1 Sex Ratio of In-Migrants to Selected Cities of Southeast Asia and Out-Migrants
from Metropolitan Manila ... 4 9 4.2 Ethnic Origin of Migrants to and from
LIST OF FIGURES
Figure Title Page
1.1 Map of the Philippines : 1975 ... 2 3.1 In-Migration to Metropolitan Manila by
Region of Origin : 1970-75 ... 22 3.2 Out-Migration from Metropolitan Manila by
Region of Destination : 1970-75 ... 22 3.3 Volume of Migration Between Metropolitan
Manila and Other Urban Areas, and
Metropolitan Manila and Rural Areas, by
City and Municipality : 1970-75 ... 38 3.4 Volume of In-Migration to the Cities and
Municipalities of Metropolitan Manila :
1970-75 42
4.1 Age Structure of Migrants to and from Metropolitan Manila and the Philippine
Population : 1970-75 ... 51 4.2 Marital Status Structure of Migrants to
and from Metropolitan Manila and the
Philippine Population : 1970-75 53 4.3 Educational Attainment Structure of
Migrants to and from Metropolitan Manila
and the Philippine Population : 1970-75 .. 55 4.4 Usual Occupation Structure of Migrants
to and from Metropolitan Manila and the
Philippine Population : 1970-75 59 4.5 Distribution of In-Migrants to Metropolitan
Manila by Usual Occupation, by Sex, by
INTRODUCTION
On November 7, 1975, Presidential Decree No. 824 created Metropolitan Manila. The Decree effected the integration of four cities and 13 municipalities which make up the nation's political, industrial and cultural capital. To quote from the National Census and Statistics Office (NCSO, 1975, p.xix), Metropolitan Manila was created because :
"A tremendous increase in the population of Manila and its environs since the end of World War II,
particularly after 1950, has been observed. As a result of the burgeoning population, the scale and pattern of urbanization in these areas have grown to such proportions that they have become intimately linked, geographically and politically."
The tremendous population growth of Metropolitan Manila and the contribution of migration to its growth are discussed in the first section of this chapter, 'The Setting', which also shows the study area in relation to other parts of the country and enumerates the cities and municipalities that make up Metropolitan Manila. The succeeding section reviews the studies on internal migration in the Philippines and draws attention to the dearth of studies on migration to and from Metropolitan Manila. Section 3 specifies
the objectives of the study which are mainly to analyze the
differentials in the levels of migration and the characteristics of migrants to and from Metropolitan Manila. The last section
describes the data and its limitations, and measures the accuracy of the age and sex statistics.
1.1 THE SETTING
The Philippines consists of more than seven thousand
FIGURE 1.1. MAP OF THE PHILIPPINES: 1975 1
1 1 1
1 0
\ «
1 *
I CT ~ 0
Cagayan Valley Ilocos
C e n t r a l •Luzon
Metropolitan Manila,
Bicol
Southern Tagalog Eastern Visayas
/./estern Visayas
Central Vis ayas
/ e s t e r n
M
i nd ana 0Mindanao in the south and Visayas in the centre. Each island group is divided into regions, one of which is Metropolitan Manila
(Figure 1.1). Each region is further subdivided into provinces and each province into municipalities and sometimes cities. The barangay (village) forms the smallest geographical unit and it is classified as either urban or rural according to various criteria.
1.1.1 Composition
Metropolitan Manila encompasses the following : Cities :
1.) Manila 2.) Quezon 3.) Pasay 4.) Caloocan Municipalities : 1.) Makati 2.) Mandaluyong 3.) San Juan 4.) Las Pinas 5.) Malabon 6.) Navotas 7.) Pasig 8.) Pateros 9.) Paranaque 10.) Marikina 11.) Muntinglupa 12.) Taguig 13.) Valenzuela
All of the above cities and municipalities except Manila and Valenzuela are in the province of Rizal. Valenzuela is a municipality of Bulacan while Manila is an independent city and
From 1903 to 1960, Metropolitan Manila slowly emerged from the ninth to the seventh most populous region in the country. Between 1960 and 1970, it leapt from seventh to second position. This rank was maintained until 1975. Between 1970 and 1975, Metropolitan Manila registered the highest annual growth rate'*' of 4.6 per cent per annum among.all the regions. The rest of the regions registered a growth rate of 1.3 to 4.3 per cent per annum.
Although Metropolitan Manila was second only to the Southern Tagalog Region in size in 1970 and 1975, it was seventy times more densely populated and had a density fifty-six times above the average for the country. Metropolitan Manila, in 1975, contained twelve per cent of the country's population and more than a third (37 per cent) of the urban population. (NCSO, 1978)
1.1.3 Role of Internal Migration in Metropolitan Manila's Growth Metropolitan Manila is the nation's commercial and
industrial capital, the cultural and educational centre and the seat of national government. It is therefore not surprising that it has attracted a substantial number of migrants from other
regions of the country, and that it has a very mobile population. However, the exodus to Metropolitan Manila is a recent phenomenon.
1 The growth rate was based on the formula :
P = P (1 + r)n where P is the initial population and P
n o o n
Until 1960, the frontier lands of Mindanao were the main
destination of migrants. After I960, the diminishing available lands and the intensifying Christian-Muslim conflicts (Keely, 1973, p.179) in Mindanao diverted migrants to Metropolitan Manila.
For the period 1968-1972, Metropolitan Manila experienced the lowest fertility rates in the age groups 15-19 to 40-44 among all the regions (De Guzman, 1978, p.124). In contrast, the same region had the highest population growth rate. This high growth rate would therefore be largely due to the high volume of in-migration and the low rates of mortality and out-in-migration.
Studies show that for the period 1968-1972, Metropolitan Manila had the second lowest crude death rate among all the regions estimated at 7.2 per thousand population (Zablan, 1978, p.109). Between 1970 and 1975, about 312 thousand persons moved
to Metropolitan Manila from other regions while between 178 to 182 thousand moved out. Among all the regions in the country,
Metropolitan Manila had the highest number of persons who changed province of residence (interprovincial migrants) between 1970 and 1975. While Metropolitan Manila had a share of 28 per cent of the 1.4 million interprovincial migrants, the twelve other regions' share ranged only from three to eleven per cent (NCSO, 1978).
1.2 STUDIES ON INTERNAL MIGRATION
The first study on internal migration in the Philippines was carried out in 1959 by Nava using 1939 and 1948 census
results. Subsequent descriptive net migration studies by Simkins and Wernstedt (1963) and Reforma (1972) followed for the 1948-1960 and 1960-1970 intercensal periods respectively. Using the 1970 preliminary census results, Kim (1972) estimated provincial net
Detailed studies on internal migration were not available until the 1960 census when for the first time, by a census, the place of birth and residence as of a specified date, were asked. Pascual (1966) took a 0.5 per cent sample of the 1960 census to carry out her study on internal migration in the Philippines; Slater (1976) identified nodal in- and out-migration regions using a 1960 lifetime interprovincial migration table;
UNFPA-NCSO (1976) utilized a 5 per cent systematic sample of all
enumerated households in 1970; Perez (1978) made use of the 1960 and 1970 census results as principal sources of migration data and the National Demographic Survey of 1973 to determine the
characteristics of migrants at the time of the survey.
Urbanization and rural-urban migration, which has often been equated with migration to Manila and its surrounding areas, have been covered in the above studies but Pernia (1976a, 1976b) made the most extensive study of them. There are other studies on internal migration but they are not as important as the studies mentioned above.
Since internal migration studies have been of relatively recent origin, the thrust of many of the studies has been towards determining broad national patterns of migration. Localized studies have been few. Studies on migration to and from
Metropolitan Manila, the fastest growing region and the nation's centre, have been limited. The only study which is more or less focused on Metropolitan Manila is Zosa's (1974) paper exploring the possible causes and implications of migration to Manila and Rizal in 1960. Hendershot (1969), in a survey of two rural municipalities, looked at the characteristics of out-migrants and the reasons for migration. He classified four areas of destination, one of which was Greater Manila. Studies of
It is important to note that the composition of
Metropolitan Manila or Greater Manila referred to in the above studies is not identical to the Metropolitan Manila created in 1975.
1.3 OBJECTIVES AND STRUCTURE OF THE STUDY
Notwithstanding the significant contribution of internal migration to the tremendous growth of the nation's centre, there is still a dearth of studies on migration to and from Metropolitan Manila. This study attempts to widen and update the present knowledge on the levels and patterns of migration to and from Metropolitan Manila using the latest available census data. Specifically, it tries to answer the following questions : 1. ) How much do the levels of migration to and from
Metropolitan Manila vary (a.) from one region of origin or destination to another, (b.) from the urban areas to the rural areas, and (c.) from one Metropolitan Manila area to another? What factors influence or contribute to the spatial variation in levels of migration?
2. ) Who are the migrants to and from Metropolitan Manila?
How do they compare with the total Philippine population or with migrants in other South-east Asian countries? How different are the in-migrants to Metropolitan Manila from the out-migrants from Metropolitan Manila? Are the out-migrants from Metropolitan Manila actually return out-migrants? Are there spatial (regional, urban-rural, Metropolitan Manila area) differentials in characteristics of migrants? What factors influence or contribute to these differentials? The study is divided into five chapters. After the
introduction, the second chapter reviews the theories and models on migration. Factors which influence or contribute to the
These factors are then used as guidelines in explaining the differentials in levels of migration in Chapter 3 and the selectivity of migrants in Chapter 4. Chapter 3 examines the first set of questions above while Chapter 4 deals with the second set of questions. Chapter 5 summarizes the findings of the study, discusses the implications, the limitations and possible further development of the study.
1.4 THE DATA
1.4.1 The Data and its Limitations
The principal source of data for this study is the 1975 census of population. The migration variables (as shown in the Appendix) in this census are :
1. ) Residence on May 6, 1975 : a. Province
b. City or Municipality
c. Urban-rural classification of barangay. 2. ) Residence on May 6, 1970 :
a. Province if different from that of May 6, 1975, and the urban-rural classification of the
barangay of residence.
b. If the same province as in 1975, the
respondent's residence was classified as one of the following :
1. same barangay
2. another barangay, same municipality/ city - urban
3. another barangay, same municipality/ city - rural
4. another barangay, same municipality/ city - unknown urban - rural
5. another municipality/city - urban 6. another municipality/city - rural 7. another municipality/city - unknown.
Thus, the city/municipality of residence as of May 6, 1975 and not 1970 was asked. The only knowledge that can be gathered about the city/municipality of origin (residence as of May 6, 1970) is its urban-rural classification (strictly speaking, the urban - rural classification of the barangay of the city/municipality). Since Metropolitan Manila consists of Manila, three cities and twelve municipalities of the province of Rizal, and a municipality of Bulacan, the out-migrants from Metropolitan Manila cannot be accurately identified. In this study, out-migrants from Manila and urban Rizal are used as proxies for out-migrants from
Metropolitan Manila. This is a close approximation since the whole of Manila is within Metropolitan Manila, and 95 per cent of the 3.5 million urban population of Rizal reside within
Metropolitan Manila boundaries. Manila and the area of urban Rizal under Metropolitan Manila alone form 90 per cent of the population of total Metropolitan Manila. Thus, the "out-migrants
from Metropolitan Manila" referred to in this study consists of migrants from all the cities/municipalities of Metropolitan Manila except Valenzuela. Valenzuela is one of the municipalities of the province of Bulacan and the out-migrants from urban Bulacan number around five thousand but it is not possible to know the proportion of migrants coming from Valenzuela. The out-migrants
from Metropolitan Manila would therefore be anything between 178 thousand persons, which is the number of migrants from Manila and urban Rizal, and 183 thousand, which is the number of migrants from Manila, urban Rizal and urban Bulacan.
From a five per cent sample of the 1975 census, two sets of data were segregated and used for this study :
1.) data on persons five years old and over whose place of residence in May 6, 1970 was in any region in the
residence in May 6, 1970 was Manila and urban Rizal but whose place of residence in May 6, 1975 was in any region in the Philippines except Metropolitan Manila. These are called "out-migrants from Metropolitan Manila".
The data on residence as of May 6, 1970 contain "not reported" provincial and urban-rural codes. The regional and urban-rural analyses do not therefore include data with the said not reported codes. The excluded data for the rural-urban and regional analysis is four per cent and 15 per cent respectively of the total 312 thousand in-migrants.
1.4.2 Quality of the 1975 Census Data
Since the data used for this study is a sample of the 1975 census data, the accuracy of the findings of this thesis greatly depend on the quality of the census data. Only the age-sex data will be evaluated because (a) these are the most basic demographic characteristics, (b) accuracy test techniques for these data have been developed, and (c) the quality of the age-sex data can provide an insight into the quality of the other census data.
The U.N. Secretariat method is a measure of the
differential omission of persons in various age groups from the census count, tendentious age misstatement as well as digit-preference. It is therefore more truly a reflection of the general accuracy of the statistics. However, unlike the other methods, the resulting index is not very exact and should be
regarded as an order of magnitude rather than a precise measurement (United Nations, 1955, pp.42-43). Thus, in this study, to obtain a precise measurement of digital preference, the Myer's index is computed; to estimate the general accuracy of the data, the U.N. Secretariat method is used.
a.) Myer's Index
To determine preference or dislike for each of the ten digits from zero to nine, the "blended" total population for each of the ten digits is computed first. The "blended" total is obtained by the following steps :
1. ) Compute the sums of numbers at all ages terminating in each digit for ages ten and over, and for ages twenty and over.
2. ) Multiply the former with the successive
coefficients 1, 2, 3 ... 10 and the latter with the successive coefficients 9, 8, 7 ... 0.
3. ) Add the results to obtain a "blended" population for each terminal digit.
The "blended" totals for each of the ten digits should be very nearly ten per cent of their grand total. The deviations of each sum from ten per cent of the grand total are added together, irrespective of their sign, and their sum is the Myer's index
A
B
L
E
1
.
1
.
A
P
P
L
I
C
A
T
I
O
N
O
P
MYE
R
'S
METHOD
T
O
A
G
E
DA
T
A
F
O
R
M
A
LE
S
AN
D
F
E
M
A
L
E
S
,
A
C
C
O
R
D
I
N
T
O
T
H
E
P
H
I
L
I
P
P
I
N
E
C
E
N
S
U
S
O
F
1
9
7
5
o o •H rH
-P VQ cm o CO O i n H- i n rH PO
H-ci a • • • • • • • • • • •
•H O H rH o O o rH O O o o VO
> u
0 <H 4- i 1 4- I 1 4- 1 P
r!
0 o
tiO -H Cl +>
CO - p 2 VO co o CM o i n VD m H to* o
CD 0 p • • • • • • • • • • •
rH 0 -H 1—1 CO o Qv o rH QV co O co o
cl O U H 1—1 rH H rH o
Fi -P 1—1
CD 0 m
P fH -H
p
co o 1—1 OJ o O i n CM rH o o CO VO PO vo CM 00 H- o P O o OJ 'll VO no to- co r—1 O PO rH CM i n o
0 •v »V »V * rv r*
P Ö 0 ^
VO O'-. o O J vo o O CO OV PO co
o CO to- vo i n PO P O O co O J
to-0 rn o LT\ o o O Gv i n t n rH o - vo
H •v »V
m H- O CM rH CM P O H 1—1 CM rH o r H f--1 rH H rH H rH 1—1 rH r H CM
rH
C! o o •H rH
4° CH P O H C H t n vo P O H i n o
-C l 0 • • • • • • • • • • •
•H O rH rH o o O rH o O O O vo
> U
0 CH
+ i 4- 1 + 4- 1 1 4- 1 P
£
0 o
fc.0 *H cl "P
•P 2 P C to- 1—1P O rH n- H - to- rH i n ov
CO PJ P • • • • • • • • • • •
0 0 *H 1—1C O o co o H O v C v o co C O
rH O U H rH r—1rH r 4 C O
cl fH S 0 CO
P *H P
o> cv P O H- o o to- I--i P O o co co o LTV Go vo t n VO VO VO CM t n Tl H t n rH P O P O CM vo H CM to- CO
0 r» •s e*
p 0 rH CO i n O J t n P O CO to- o i n t n
0 ^ VO o co co rH co P O i n P O 0 -
H-0 CO tH co CM Cv! CM i—! H- 0 - O J i n P O
rH »V •s r>
p p o o CM rH CM H- rH rH CM rH rH r rH r H r-i H 1--1 rH H i—1 rH i—1 CM rH H
Cl
0 4J
•H *H 0
M C l o iH CM P O H - i n VO to- CO co 0
U *H i n
Theoretically, the Myer's index can vary from zero, if all ages were reported accurately, to 180, if all ages were reported with the same terminal digit. For the Philippine 1975 census, an
index of 6.4 for females and 6.7 for males was obtained showing a low degree of age heaping or digit preference.
b.) U.N. Secretariat Method
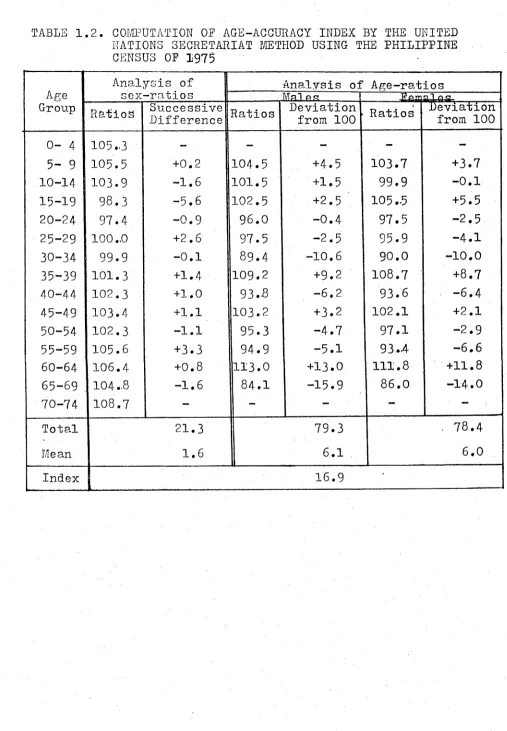
In this method, sex-ratios and age-ratios for five-year groups of ages up to age 70 are computed. Sex-ratio is the number of males per 100 females in the same age class; age-ratio is the number of persons of a given age group per 100 of the mean of numbers of the two adjoining age groups, of the same sex. For sex-ratios, successive differences between one age group and the next are noted, and their average is taken, irrespective of sign. For age-ratios for either sex, deviations from 100 are noted and averaged irrespective of sign. Three times the average of sex-ratio differences is then added to the two averages of deviations of age-ratios from 100 to obtain the index.
TABLE 1.2. COMPUTATION OF AGE-ACCURACY INDEX BY THE UNITED
NATIONS SECRETARIAT METHOD USING THE PHILIPPINE
CENSUS OF
1975
Age
Analysis of
Analysis of Age-ratios
sex -ratios
Mnl p
p
.
Fema"! ns
Group
Ratios
Successive
Difference
Ratios
Deviation
from 100
Ratios
Deviation
from 100
0-
4
105.3
-
-
-
-
-5- 9
105.5
+0.2
104.5
+4.5
103.7
+3.7
10-14
103.9
-1 • 6
101.5
+1.5
99.9
-0.1
15-19
98.3
-5.6
102.5
+2.5
105.
-5
+5.5
20-24
97.4
-0.9
96.0
-0.4
97.5
-2.5
25-29
100
..0
+2.6
97.5
-2.5
95.9
-4.1
30-34
99.9
-0.1
89.4
-10.6
90.0
-10.0
35-39
101.3
+1
• 4
109.2
+9.2
108.7
+8.7
40-44
102.3
+1.0
93.8
—6 • 2
93.6
-6.4
45-49
103.4
+1.1
103.2
+
3.2
102.1
+2.1
50-54
102.3
-1.1
95.3
-4.7
97.1
-2.9
55-59
105.6
+3.3
94.9
-5.1
93.4
-6.6
60—64
106.4
+0 • 8
113.0
+13.0
111.8
+11.8
65-69
104.8
-1.6
84.1
-15.9
86.0
-14.0
70-74
108.7
-
-
-
-
-Total
21.3
79.3
78.4
Mean
1,6
6.1
6.0
[image:23.552.25.532.73.804.2]CHAPTER 2
MIGRATION MODELS AND THEORIES
Several authors have attempted to explain migration by means of models or theories. They have identified the underlying forces that govern migration. However, most of these models and theories were based on Western experience and may not necessarily apply to developing countries such as the Philippines.
McGee (1971, Chapter 1) argues that the theories which have been developed out of Western experience are not acceptable in interpreting and predicting the pattern of the growth of the urban population, to which migration is a major contributor, in the Third World. This is because of the different mix of the components of the urbanization process in the Third World which are demographic, economic and social. He backs up his argument with studies by several authors: when Abu-Lughod applied certain broadly-accepted generalizations concerning rural-urban demographic differentials which had been developed out of Western experience to the case of Egypt, she found that Egypt showed startling differentials;
Frank's exhaustive review of Western economic theories on urban population growth indicated "the inadequacy of many of these theories particularly in the underdeveloped world"; various researchers such as Lewis, Bruner and Mayer have found the rural-urban theory of social change to be inadequate.
theories have been broadly classified into three categories according to the forces or factors at play in migration although these may sometimes overlap.
2.1 GRAVITY MODELS
The most important variables in these models are distance and population size. According to the Gravity Model, migration is directly related to the number of persons at the origin and
destination and inversely related to distance.
Mi - > j " K P.P .i 1 d. . ID
Mi-> j migration from source .i to destination .D h - population of source ^
i_
i. ii population of destination
d —
ij distance between source .l and destination This model was patterned after Newtonian Physics where : gravitational energy is the product of two masses divided by the square of the distance separating the masses. Stewart and Zipf simultaneously developed this model from independent angles although it has been implied in the writings of earlier authors on migration
(Isaard, 1960, pp.499-500).
2.2 ECONOMIC MODELS AND THEORIES
The economic motive has been considered by many writers as the primary cause of migration. People are believed to move
mainly for upward occupational/social mobility or because particular job opportunities are located elsewhere. Thus, income and
should indicate the number of opportunities in an area - the size of the labor force, the wage rate, and the unemployment rate.
W j where
K h
u.
1
w.
3°ij
M. n 1 - ^ 1 L . and L.
3
U . and U.
1 3
W and W. D. . =
13
3
Number of migrants from place ^ to place
= Number of persons in the nonagricultural labor force in . and .
i 3
= Unemployment rates in . and ,
1 3
= Manufacturing wages in ^ and Distance between . and .
i 3
From the rural-urban point of view, Todaro and Harris (1970, 1969) postulate that labor migration from the rural to the urban areas in developing countries proceeds in response to
urban-rural differences in ''expected" earnings^ despite the existence of positive marginal products in agriculture and the significant levels of urban unemployment.
2.3 GENERAL MIGRATION MODELS AND THEORIES
These models and theories cover a wider scope than the previous models and theories which are sometimes too simple to explain such a complex phenomenon as migration. Foremost among these are Ravenstein1s "Laws of Migration" in 1885 and Lee's "Theory of Migration" in 1966.
Lee (1966, p.48) summarized Ravenstein's "laws" in his own words below :
1. ) Migration and distance
(a) "The great body of our migrants only proceed a short distance" and "migrants enumerated in a centre of absorption will ... grow less (as distance from the centre increases)"
(b) "Migrants proceeding long distances generally go by preference to one of the great centres of commerce and industry."
2. ) Migration by stages
(a) "(T)here take place consequently a universal shifting or displacement of the population, which produces 'currents of migration', setting in the direction of the great centres of commerce and industry which absorb the migrants."
(b) "The inhabitants of the country immediately
surrounding a town of rapid growth flock into it; the gaps thus left in the rural population are filled up by migrants from more remote districts, until the attractive force of one of our rapidly growing cities makes its influence felt, step by step, to the most remote c o m e r of the Kingdom." (c) "The process of dispersion is the inverse of
absorption, and exhibits similar features." 3. ) Stream and counterstream - "Each main current of migration
produces a compensating counter-current."
5. ) Predominance of females among shortdistance migrants -"Females appear to predominate among short-journey migrants." 6. ) Technology and migration - an increase in the means of
locomotion and a development of manufactures and commerce have led to an increase in migration."
7. ) Dominance of the economic motive - "Bad or oppressive laws, heavy taxation, an unattractive climate, uncongenial social surroundings, and even compulsion (slave trade, transportation), all have produced and are still producing currents of migration, but none of these currents can compare in volume with that
which arises from the desire inherent in most men to 'better' themselves in material respects."
Thus, the variables that Ravenstein took into account were : distance, urban-rural classification of area of origin, sex of
migrants, technology and other economic factors.
Lee further expanded Ravenstein's laws when he formulated his "theory of Migration". He summarized the factors which enter
into the decision to migrate and the process of migration under four headings, as follows :
1.) Factors associated with the area of origin 2.) Factors associated with the area of destination 3.) Intervening obstacles
4.) Personal factors.
Lee did not specify the factors at origin or destination but just described these as factors which act to hold people within the area or attract people to it, and factors which tend to repel them. For "intervening obstacles", he cited distance as the most studied although it is by no means the most important.
autogenic (voluntary) mobility : economic, institutional and
political, demographic, sociocultural and other behavioural or
idiosyncratic factors; and institutional or political forces and
environmental factors as contributing to allogenic (non-voluntary)
mobility. He further gives examples of these categories.
Thus, some authors were very specific about the factors
that influence migration while others just categorized them into
classes. Specific factors such as distance, population size,
income, unemployment rate, non-agricultural and labor force, for
which data are available, and variables although not specified by
the models and theories but which can be classified under one of
their factors categories will be used in the regression analysis in
CHAPTER 3
SPATIAL VARIATIONS IN LEVELS OF MIGRATION
In this chapter, the spatial units of analysis are the twelve regions of the country, the urban and rural areas and the cities/municipalities of Metropolitan Manila. Volumes and rates of migration from these spatial units to Metropolitan Manila and from Metropolitan Manila to these units as well as migration levels to and from the different areas of Metropolitan Manila are compared. Regression analysis is carried out to determine the correlates of migration. Additional factors influencing migration but which are not quantifiable are also presented.
3.1 REGIONAL VARIATIONS
Metropolitan Manila has been the recipient of heavy in-migration from other regions since 1960. During the period 1970 to 1975, 312 thousand persons moved into Metropolitan Manila from other regions while between 178 to 183 thousand moved out. However, volume and rates of migration varied from one region to another.
3.1.1 Volumes and Rates
As seen in Figures 3.1 and 3.2 and Table 3.1, the neighbouring regions were the most important origins and destinations. They had the highest volumes and rates of migration.
The majority of the in-migrants and out-migrants originated and ended, respectively, in the regions of Luzon. Although the island contained less than half of the country's population
f■<
r-H
51 o
o
pi r iPH o
M Pi e>o r-i
H D1EH
-1 >H
rrj n
O in H <tJ E-. PI l I H O eh :■ c-IP <t| G> O rJ H CM rn m s Ct PH PH I-- T»
3
-E I ; ;
M H
hi o O H pH n
o o
pi
Eh F"h PC o
o o
EH M
O
Pi H
O Pi M EH >H -I pn PH o H I (—.* f - I
M IC\ ■ 1 E~
h-1 I
PI O : j c-•1 OA T ; H
EH
H N
ft O
O O
PH o
O — 1 CNJ ft- ro ON CO to A-l H A LA ftl A- o A to to cd v_^P • • • • • • • j • • • • I • • • • • EH co d CO ft- A f—1 o to ft"! ft- A CO r—11 O A A o A 0
-r'H
ao
p o H I—1
d cd Cd o
Ph d
o
m •H ft
CP -P i ON ON A ON o ro to! A A o o ft A 00 ft- CO pc d d • • • • • • • • • • • • • • • • <! d H rH H CO r— 1 ro A A-l to to o A A AJ H H A cd bjj
•H rH H H ft H 1—1
p P.r< F— 4
p ft d
f—H P-< A- CO o ON ft- to ro A- CO CO H ft- CO O A O o A ft- A- to to O H A- ON ro A O ft A CO M A P d ft- H A ON O CO CO LA ro O ft CO to CO EH A- G •* •>* r* r- •s •s * •N H ft 1 A ft to ft- A- ON ON LA o to A H A to H O A to pci o A- g CO ON A CO AI H o to LA CO H ON ft- ro ft* ro M A- 1 d ro CO to A ft- CO CO LA CN A CO ft ON A CO
ft ON O ft •n »V •v •N •v •< A pl (—! A- A A 1-1 ro ft- A co A A AI A- 1-1 H A H ON
;o ON i— ! ON
1— 1 ••
P Cd H H
ro O G
PI PC
ft ft d rH o A A ON CO ft- H A H A to H O CO O O ft PI d • • • • • • • • • • • • • • • • • EH (ft CD .o CO ON A ft ro GO A- H A A- ft- A to ft A O O
Hr-ftH i> ft- H H A i—1 A o
W P O ft ft
H cd ft
CP o
Ph ft
ft do i to H H O A ft- H A H ON ro ft A co to o oo A ft o •H p • • • • • • • • • • • • • • • • »V • O ft p d o A- A ft- to o ro oo ft- O to 1 o A A o O co rH M ft
ft ft P ft ft d ft •H u
o A- CNJ A 1— 1 A H O ft
rH rH ro o
ft ft p o
ft ft ft ft
CO o
•H i O O ro o A- o H A A to A CO to LA o o o ft-1 ft P d • • • • • • • • • • • • • • • • ^ • EH H O'' ro A to H ro A A A- CO A 1 H H H H O A A
ft ft v.n to H H A 1-1 A O ft A
O P H A
P
-ft -ft o o
ft
ft ft ft o d d O
M O CO OO oo d d d d P
1 ft d ft ft d d cti d d d d ftO h.-r •H ft ft
h : o G d d ft ft ft d
P P d CH d
d d H o ft d d d nO d d P o d
ft o 1-1 N d co 00 00 d •H •Hb-H r-ft d
CO H • •H d d EH •H •H •H •H ft •Hbr<
r \
G X -H
i— 1 ft tu ft ft ft ft ft S d g d
• d CD d O d d •H ft *H
ro d ft d H d CO d 1-1 d d d d d H P< d d H CO d d G d u d d d d G G d Ph H 03 CP CO d o ft d ft H G d G d G ft ft d •H •H ft M o o d ft o d ft ft P ft P p p HJ H p P N o ft d £> a CO CO d CO d CO d d d •H ft d H d G O •H •H G G d •H G o o G ft EH ft ft o CO CO p ft P O PP Efe—•h P y~-ft~A m CD Pi
d
a > o rd
P • ro /— >
co 13 A-H on O
r-CC r0
1
3
9
0) ftft*
O-LA ON 'Vi
<1) •>
too d CQ
d ft o n_-<
•H
■P W
ClJ 4->
H d d o
p< p-l O <D
ft ft A W t>- d A {/)
d <D
'O O i !A
tN
CO ON
<D V-to 05 ^
d d o o
•H
-P H
O CO
co d
O CO
- d
ft <D
o A A CO A-•H ON r-f-l d <d 4-J .P O 4->
P «H
Cl) O
ft P (1)
rl - Ph
■s §
• 'ft CO
co d
d H o^.
O O A
•h d to -H d
0) d co d
d o ft o
<U *H ft
P to 0)
<i) co
d d ft ft o ft —
ft
o
A ft On ft
v~
ft «H <1) O ft
•H n >
d *H CO ft
d
O P-.
CD ft
d 0) d p p
d d O ft ft 0) d d o
•H
P P d d
to
d ft -rj M H a
CD P
regions (Table 3.1). On the other hand, the percentage share of the Mindanao regions in migration was only about a fourth of the percentage share of the island group in the total population.
To show the disparity of the regional percentage
distribution between the total population and the migrants, an index of dissimilarity was computed. The index is simply half the sum of the absolute differences between two populations taken area by area (Timms, 1965, pp.240-241). The index computed in Table 3.1 means that 22.4 per cent of the in-migrants and 31.2 per cent of the out-migrants would have had to come from or moved to another region to reproduce the percentage distribution of the total population. Thus, about a quarter of the in-migrants would have had to come from the Western and Central Visayas and the Mindanao regions instead of the Luzon and Eastern Visayas regions, while about a third of the out-migrants would have had to move to the Ilocos, Cagayan Valley, Western and Central Visayas and Mindanao regions instead of Central Luzon, Southern Tagalog, Bicol and the Eastern Visayas.
3.1.2 Factors Influencing Differences in Levels of Migration 3.1.2a. Regression Analysis
Factors influencing migration or factors that are related to migration have been identified in Chapter 2. The factors which are quantifiable and for which data are available are used in a regression analysis below. These factors may not necessarily explain the differences in migration levels among the twelve
regions. They may just be proxies for the real causes of migration. However, directly or indirectly, they no doubt contribute to the differences in levels of migration.
Rogers in 1968, Schwind in 1971, Stone in 1969 and Lansing and Mueller in 1967 (Lycan, 1975 pp.216-217).
The correlation coefficient is based on the regression equation which is a mathematical formula for predicting the most likely value of one variable (dependent variable) from the value of one or more other variables (independent variables) for a given case. The correlation coefficient measures the degree to which the regression equation produces accurate predictions. As such, it is also interpreted as a measure of the strength of association between the dependent and independent variables. The correlation coefficient varies from -1 to +1. A correlation of -1 means a perfect negative or inverse linear relationship. A value of zero denotes the absence of linear relationship (Klecka et al, 1975).
For this study, the dependent variables are volumes of in-migration to Metropolitan Manila from the twelve regions and the volumes of out-migration from Metropolitan Manila to the twelve regions. The independent variables are the following : 1. ) Distance - the distance in Kilometers between Metropolitan
Manila and a region measured from a scaled map.
2. ) Population - the number of persons residing in a region as of 1970 (NCSO, 1974)
3. ) Density - the number of persons per square Kilometer in 1970
4. ) Labor force - the number of persons ten years old and over either employed or unemployed in 1970.
Non-economically active persons such as housewives, students, etc. are excluded (NCSO, 1974).
by family members during the past twelve calendar months before the interview, which was in May, 1971 (Bureau of Census or BCS, 1973a).
7. ) Unemployment rate - the number of unemployed persons per 100 persons in the labor force. A person is unemployed if he was not at work during the reference week but wanting and looking for work or would have been looking for work except that :
a. ) he was temporarily ill
b. ) he believes no work is available (NCSO, 1974). 8. ) Large establishments - the percentage distribution of large
establishments by region. Large establishments consist of establishments such as logging, mining, and quarrying, manufacturing, electricity, gas and water, wholesale and retail stores, restaurants and hotels, transport, storage and communication, financing, insurance, real estate, and business services, commercial, social and personal services employing ten persons or more in 1972 (NCSO, 1975).
9. ) Manufacturing wages - the average wage per person in a region. It includes all payments, whether in cash or in kind, made by a manufacturing establishment to its operatives and other employees (NCSO, 1975).
10. ) Tagalog - speakers - the proportion of persons in a region who can speak Tagalog, the national language and the language spoken in Metropolitan Manila and the nearby provinces in 1970 (NCSO, 1974).
TABLE 3.,?. SUABLE
ABBMULTIPLE CORRELATION COEFFICIENTS AND
PERCENTAGE OF VARIATION EXPLAINED FOR REGRESSIONS
OF VOLUME OF IN- AND OUT-MIGRATION ON SOME
REGIONAL VARIABLES: 1970-7^
Dependent Variables
Independent
Volume of In-•migration Volume of Out-migration
Variables
oimnle
Correlation
Coefficients
Ja O f
Variation
Explained
Simple
Correlation
Coefficients
/o of
Variation
Explained
In-migration vol.
- -. 9X2a
83.2
Distance
--.98Xa
84.7
-.787a
6X
.3
Population size
.89(0
79.2
.847a
71.7
Density
.473
22.3
.372
13.9
Labor Force
.846a
7X.6
.76Xa
58.0
N
on-agricultural
workers
.85Xa
72.5
,850a
72.2
Income
.374-
14.0
.592to
35.1
Unemployment rate
.752a
56.6
.699a
48.8
Large
e
s
t
ablishmc
nts
.455
20..7
. 46X
21.3
Manufacturing
wages
.020
0.0
.292
8.5
T
a
gal
o
g-
s
p
e
ak
e
r
s
.825®'
68.X
.894a
80.0
Proportion urban
.58213
33.9
. 690a
47.6
Multiple
Correlation
Coefficients
i o
of
Variation
Explained
Multiple
Correlation
Coefficients
of
Variation
Explained
Distance and
population size
.970a
94 .1
.378a
77.1
Distance,
non-ag-
ricultural wor
kers, unemploy
ment rate and
manufacturing
wage
s
.96Xa
92.4
.9X7a
84.2
Distance, propor
tion urban,
large estab
lishments and
income
.970P'
94 .1
.986a
97.2
[image:36.552.20.531.80.807.2]cent of the variation in the volumes of in-migration1 . it is also the only variable which was inversely correlated to volume of migration.
That migration decreases substantially with increased
distance has been attributed by a number of researchers (Greenwood, 1975 p.398) to the fact that distance serves as a proxy for both the transportation and psychic costs of movement as well as availability of information. It has been pointed out that the benefits resulting from migration need not be large to offset the direct transportation expenses. However, the psychic cost involved in migration are believed to be substantial and are closely related to distance. Information likewise declines perceptibly with
distance, and hence uncertainty increases with distance. Thus, distance as a deterrent to migration, is not only a physical concept but it is also an emotional or psychological concept.
The other factors which were also strongly correlated with volume of in-migration according to their degree of relationship
from highest to lowest were : population size, number of non-agricultural workers, size of the labor force, proportion of Tagalog-speakers and unemployment rate. The simple correlation coefficients of these factors with the volume of in-migration were significant at .01 level, i.e., the probability that there is no linear relationship between volume of in-migration and these factors is at most one per cent. On the other hand, the proportion urban was not as significantly correlated with volume of in-migration as the above factors. The probability that there is no linear
relationship between the volume of in-migration from Metropolitan Manila to a region and the proportion of persons residing in the urban areas of that region was more than one per cent.
Contrary to the models and theories reviewed in Chapter 2, the volume of in-migration to a region was not significantly
related to density, income, percentage of large establishments and the manufacturing wages of the region. These might be because the data available for these factors are not refined enough to be
sensitive to differences in levels of migration. For example in the calculation of density, it may have been better if the
timberland areas were excluded in the land area of a region because these areas are not equally distributed among the regions. In addition, the income and manufacturing wages computed were the mean income and wage and not the median which is usually a better
indicator of central tendency for income and wages. But then, income may not really be as important in in-migration as it is in out-migration in which it is statistically significant, as seen in Table 3.2. As for large establishments, the great number of large establishments in Metropolitan Manila may be the more important factor in "pulling" migrants to the area rather than the lack of establishments in the region of origin acting as "push" factors.
With regards to out-migration from Metropolitan Manila, the volume of in-migration was the most statistically significant
factor. This coincides with the observation of several authors that the size of a migration-stream is more highly correlated with the size of its own counter-stream than with any demographic,
spatial or economic variables. According to Olsson (1965, p.32-33), one reason for this is that return-migrants are extremely important and some studies have shown that the two streams consist largely of the same individuals.
number of non-agricultural workers and population size are also the regions nearest to Metropolitan Manila. In fact, they are contiguous to Metropolitan Manila.
Unlike in-migration, income was significantly related to volume of out-migration at the .05 level while the proportion of persons residing in urban areas was related to out-migration at .01 level of significance. Thus, income and proportion urban are stronger 'puli' than 'push' factors.
When distance was combined with other independent variables for multiple regression analysis, higher correlation coefficients were obtained. However, caution should be observed in the
multiple correlation analysis because of the existence of
multicollinearity, i.e. the independent variables are themselves interrelated. The effect of one independent variable on the volume of migration may be confounded by other independent variables.
The first multiple regression in Table 3.2 makes use of distance and population size as the independent variables. This is based on the Gravity Model. The second regression is based on Lowry's Model while the third on Ravenstein's 'Laws of Migration'. For in-migration, distance together with population explained 94.1 per cent of the variation in the volume of migration. With
distance and economic factors like number of non-agricultural workers, unemployment rate and manufacturing wages, the variation explained went down by 1.7 per cent, while with distance and
factors such as proportion urban, percentage of large establishments and income, the correlation coefficients and subsequently the
variation explained were equal to that obtained using the first regression. On the other hand, the correlation coefficients for out-migration increased from the first to the second and from the second to the third multiple regression.
3.1.2b. Other Factors
Aside from the factors discussed in the preceding section, other factors have contributed to the variations in the volume of migration among the regions. Unlike the above factors, neither these factors nor their effects can be measured. These factors are :
1.) Institutional or Political Forces
The State has the aim of allocating resettlement sites and constructing dwelling units to promote independent home ownership. To effect this aim, the government policies on relocation and resettlement are embodied in various
Executive Orders, Presidential Decrees, Letters of
Instruction and Memorandum Directives from the Office of the President of the Philippines (Task Force on Human
Settlements, 1975b, p.34).
One of these Executive Orders - No. 419 - created the Task Force on Human Settlements in September 1973 to formulate a national framework plan which would serve as a general scheme of development for the country, a Metro Manila
development plan and a national housing program. Among the plans proposed by the Task Force (1975a, pp.94-96) which affect migration to and from Metropolitan Manila are : a) "Adopt a migration policy to ensure Metropolitan
Manila will experience minimal in-migration starting in 1980. The policy, to be adopted by national and local agencies in the Metropolitan Manila Area, is essentially linked to the development of the growth centres which will absorb potential migrants to the Metropolitan Manila area."
1.) (continued)
The program would involve the "relocation of communities within flood-prone areas or portions of highly congested squatter communities to resettlement sites within or outside the Metropolitan Manila core."
The relocation of squatters and slum-dwellers has been going on since the 1960's but with the formulation of a national development plan by the Task Force on Human Settlements in 1974, the relocation of squatters and slum-dwellers has been intensified. The relocation centres for Metropolitan
Manila slum-dwellers and squatters which are outside Metropolitan Manila are the following municipalities with their provincial and regional location (Office of the President, 1968, p.101;
1975b, p.37) :
Task Force on Human Settlements,
Municipality Province Region
1. San Jose del Monte Bulacan Central Luzon
2. Carmona Cavite Southern Tagalog
3. Dasmarinas Cavite Southern Tagalog
4. San Pedro Laguna Southern Tagalog.
San Jose del Monte, San Pedro and Dasmarinas are contiguous to Metropolitan Manila. Carmona is separated from
Metropolitan Manila by San Pedro.
Between 1970 and 1975, 38 per cent of the 43 thousand
migrants to Central Luzon and 44 per cent of the 48 thousand migrants to Southern Tagalog migrated to these relocation municipalities. It is interesting to note that San Jose del Monte's population in 1975 accounted for only 1.4 per cent of the total population of Central Luzon. The
municipalities of Bulacan contiguous to Metropolitan Manila, received more than 20 times less migrants than San Jose del Monte. Bacoor, the other municipality of Cavite contiguous to Metropolitan Manila, received five times less migrants than Carmona. From these facts, it can be safely deduced that relocation has made a greater contribution than
contiguity, to migration to these municipalities and in
general, to the regions of Central Luzon and Southern Tagalog. 2. ) Sociocultural Factors
The Moslems constitute the largest non-Christian ethnic category of a country which is predominantly Catholic. In 1970, 99 per cent of the 1.58 million Moslems were enumerated in Mindanao. The Moslems in Central Mindanao accounted for 47 per cent of the region's population; in Western Mindanao, 33 per cent; in Southern Mindanao, 20 per
cent; and in Northern Mindanao, less than 1 per cent (NCSO, 1974).
The Spaniards colonized the Philippines for four centuries but they failed to rule the Moslems. Even the Americans and the Christian Filipino leaders were unsuccessful in fully integrating the Moslems with the rest of the country. Because of cultural discontinuity between the Moslems and the rest of the country, it was inevitable for conflicts to arise. The settlement of Christians on territory
traditionally held by Moslems aggravated these conflicts. The movement to Mindanao was encouraged by the Philippine government in the early 1900's when it proclaimed some lands in Mindanao as agricultural settlements. The strong
affinity with Moslems of other countries has further
2. ) (continued)
erupted in secession rebellions starting in 1971. (Gomez, Chafee, 1969; De Los Santos, 1973). To escape these
rebellions, an estimated 90,000 Southern Filipino Moslems have fled to the East Malaysian State of Sabah over the last seven years (Daily Express, Aug. 23, 1979).
Thus, the 'cultural' and physical distance of Moslems from Metropolitan Manila may have deterred them from migrating to Metropolitan Manila while the conflicts raging in some parts of Mindanao have discouraged in-migration.
3. ) Economic Factors
Some economic factors have encouraged or inhibited migration to Metropolitan Manila. These factors are usually the result of environmental or topographic factors themselves. According to Burley (1973, p.190), the Bicol region
experiences 40% of the storms in the Philippines with the result that agriculture, the cornerstone of the economy, continually suffers substantial reductions in the output of its mainstays - coconut, abaca, rice and corn. To make things worse, large coconut plantations have been devastated by yellow mottle in recent years (Yambot, 1976, p.95).
Coconut is Bicol's primary commercial crop.
On the other hand, two great mountain ranges between Cagayan Valley shield it from crop-destructive typhoons