Final Project Report
(Not to be used for LINK projects)
Two hard copies of this form should be returned to:
Research Policy and International Division, Final Reports Unit MAFF, Area 6/01
1A Page Street, London SW1P 4PQ
An electronic version should be e-mailed to [email protected]
Project title
Optimisation of phosphorus and potassium management within organic
farming systems
MAFF project code
OF0114
Contractor organisationand location
IACR-Rothamsted, Harpenden, Herts, AL5 2JQ
SAC, Craibstone Estate, Aberdeen, AB21 9TQ
Elm Farm Research Centre, Hamstead Marshall, Newbury, Berks. R20 0HR
Royal Agricultural College, Cirencester, Gloucs. GL7 6JS
Total MAFF project costs
£ 149,841.28
Project start date
01/01/98
Project end date31/12/00
Executive summary (maximum 2 sides A4)
Organic farmers need to make scientifically and economically sound management decisions enabling optimum sustainable use of P and K to allow the demand for organic produce to be met with least risk to the
environment. However from an advisory point of view there is insufficient knowledge appropriate to UK conditions and organic farming systems to provide guidance to farmers in the following key areas of P and K management: availability of P and K, both from soils of different types and permitted fertilisers; the rate of soil P and K depletion (if any) under organic management; and, the potential for nutrient recycling from livestock manures and other composted materials to overcome P and K deficits. The aim of this project was therefore to assist in the formulation of improved advisory guidelines for organic faming systems based on a sound
scientific understanding of the dynamics of P and K within UK organic farming systems. The scientific objectives of the project were therefore to
1 - Assess the balance between inputs and offtakes of P and K within a range of UK organic farming systems 2 - Evaluate chemical and bioavailability indices used to assess P and K status of soils
3 - Assess the availability of a range of P and K fertilisers to grass-clover leys and tillage crops
4 – Develop a process-based simulation model and integrate with whole farm nutrient budgeting to allow P and K management decisions to be made for the whole farm.
5 - Provide guidelines for farmers on the use of phosphorus and potassium fertilisers for organic systems.
Farm gate budgets for P and K were collated using farm records, measurements and standard tables of nutrient contents for a number of organic farms and rotations on organic farms. An integrated series of incubation, greenhouse and field experiments was carried out with a range of fertilising materials selected to give a range of likely availabilities for plant uptake and to give a mix of mineral and organic sources of P and K on soils representing the range of soil types under organic management.
Organic farming systems can show both P and K surpluses and deficits depending on management. In mixed systems, manures represent a significant resource of both P and K, which are supplemented through imports of feed and bedding. However, manure handling also therefore gives significant opportunity for losses, particularly of K from the system. K deficits are common in organic rotations, but not necessarily at the whole farm level. These deficits are close to the level which can be sustained from the weathering of mineral
reserves in many UK soils. However, more consideration needs to be taken of the potential of soils to supply K when rotations and management plans are designed. There is no reason why organic farming systems,
operating within the current UKROFS standards, cannot achieve a nutrient budget in line with long-term sustainability of soil P and K. However, continued monitoring of soil P and K levels in long-term organic trials is necessary to demonstrate these conclusions.
Typical farm rates of FYM and compost significantly increased both available P and K in soil. Rock P and Redzlaag did not significantly increase available P. However, there was some indication of slow release in the field. Sewage sludge is also a potential source of P for organic farming systems, if other factors preventing its use can be overcome. Kali vinasse and rapemeal were also good supplementary sources of available K. Plant offtake of K was significantly increased by both FYM and Kali vinasse; we believe that the same would also hold for compost and rapemeal under similar conditions. The effects of Kali vinasse and FYM on available K in soil and plant K offtake were persistent and lasted longer than one season.
Plant offtake did not seem to be limited by P availability even on low P index soils. Yield seemed to be limited by other factors and soil P supply was able to meet crop demand. Organic pools of P in soil can be significant and are likely to reflect a gradient of availabilty, as for organic N in soil. However, organic P is not routinely measured by any extraction procedure. We found a negative correlation between biomass P and available P in soils; this may reflect an increasing importance of the cycling of organic P in low P status soils receiving regular inputs of organic materials. However, the complex interacting dynamics of the organic and mineral P pools in soil could not be disentangled using the data collected. The P index system cannot therefore be simply applied in organic farming systems.
Available K measured by ammonium nitrate gave a good indication of the plant available K in soil; crops showed a response to increasing available K and continued cropping caused a decline in the pool of available K in soil. However, there was is some indication that on some soils not all of the K extracted by ammonium nitrate is truly ‘available’ – this finding should be further investigated. However, the K index system can still be used as reasonable guide for organic systems.
The complex interactions between nutrient cycles in organic farming systems means that the process-based simulation model of P and K turnover was necessarily very simplified and the data collected in this project was not long-term enough to allow a full evaluation of all the factors, which influence P and K offtake, particularly the impact of crop establishment and manamgenet practrices influencing spatial and temporal P nd K management. However, practical guidelines were drawn up for farmers and their advisors.
The project has produced 4 scientific papers and contributed to others. 10 presentations were made at scientific conferences and 5 presentations to farmers’ meetings. The project has also been responsible for simulating debate and encouraging the use of good scientific data in the development of future UK organic farming systems.
Scientific report (maximum 20 sides A4)
1.0 Background
Recent years have seen a very rapid growth in organic farming. In 1995 certified organic production
accounted for less than 0.1% of the total utilisable agricultural area in the European Union; by the end of 1998 this had increased to nearly 2.1%. In the UK, the latest figures suggest that the organic hectarage is now > 425,000 ha or 2.5% of agricultural land (MAFF, press release 15/2/01). In general, a larger proportion of land-based livestock systems (ie. sheep, beef and dairy systems often including some arable or horticultural cropping) have undergone conversion to organic production than other farm types.
Successful organic farming systems rely on efficient cycling and use of phosphorus (P) and potassium (K) within the farm. P and K management decisions are made for the rotation or system as a whole. The use and management of manures is a key component of P and K management in mixed and livestock systems. Some mineral fertilisers can be used in a supplementary role, where other fertility management practices have been optimised. These materials are applied in their natural composition and are not rendered more soluble by chemical treatment. A range of materials is permitted for use as supplementary fertilising materials and these have a wide range of nutrient contents, solubility and other properties. Little is known about the long-term sustainability of such management practices for P and K. If P and K balances are negative (ie. export> import) there will be a decline in soil reserves. Conversely if balances are positive, this may result in increased losses with adverse economic and environmental impact.
While P and K indices (MAFF RB427 and SAC Technical Note) are thought to be generally low on organic farms; crop or livestock deficiencies are not widely reported. The permitted use of sulphate of potash in
extreme cases of deficiency (UKROFS, 2000) results in a smaller problem for practical management of K than P on organic farms.Only 3-5% of Soil Association certified producers, annually seek permission to use
sulphate of potash on specific fields. Newton (1995) measured P indices ranging from Index 0 to 4 in organic grassland, which were related to DM production with an exponential relationship as might be expected.
However, the data showed wide variability. Root colonisation by arbuscular mycorrhizal fungi has been shown to be higher in organically than conventionally managed grassland (Scullion et al, 1998) and such infection may faciliate P uptake at low availability levels. P indices also do not measure the P which is potentially available through the growing season from organic pools in soil (e.g. plant residues, manures etc.).
Organic farmers need to make scientifically and economically sound management decisions enabling optimum sustainable use of P and K to allow the demand for organic produce to be met with least risk to the environment. However from an advisory point of view there is insufficient knowledge appropriate to UK conditions and organic farming systems to provide guidance to farmers in the following key areas of P and K management: availability of P and K, both from soils of different types and permitted fertilisers; the rate of soil P and K depletion (if any) under organic management; and, the potential for nutrient recycling from livestock manures and other composted materials to overcome P and K deficits. The aim of this project was therefore to assist in the formulation of improved advisory guidelines for organic faming systems based on a sound
scientific understanding of the dynamics of P and K within UK organic farming systems.
2.0 Scientific objectives of this project
1 - Assess the balance between inputs and offtakes of P and K within a range of UK organic farming systems using whole farm nutrient budgeting
2 - Evaluate chemical and bioavailability indices used to assess P and K status of soils
3 - Assess the availability of a range of P and K fertilisers (currently acceptable within organic standards and potentially suitable for organic production) to grass-clover leys and tillage crops, with and without arbuscular mycorrhizal associations and identify practical application methods for on farm use.
4 - Develop a process-based dynamic simulation model of P and K turnover in the soil-crop system that includes a description of P and K availability from non-soluble sources and evaluate using data from field experiments. Integrate whole farm nutrient budgeting with the simulation model to allow P and K
management decisions to be made for the whole farm.
5 - Provide guidelines for farmers on the use of phosphorus and potassium fertilisers for organic systems.
2.1 Achievement of these objectives
The objectives outlined above were met through a continuum of activities with members of the consortium supplying inputs directly to each component of the project at all stages. Meetings of the whole group were held twice a year in rotation around the sites, which monitored the progress of the project and ensured that the research remained focussed on the practical problems of organic farmers and advisors and also at the leading edge of scientific research in this area. The objectives were largely met on time and to schedule. However, the complex interactions between nutrient cycles in organic farming systems means that the process-based simulation model of P and K turnover was necessarily very simplified and should be integrated with work on C and N turnover before suitable for whole-farm decision making. However, practical guidelines could be drawn up for farmers and their advisors.
3.0 Materials and methods
3.1 Compilation of nutrient budgets
Farm gate budgets are among the simplest form of nutrient budgets (Jarvis, 1999). These only deal with nutrients bought or sold over the farm gate, e.g. feed, stock, seed, milk and grain. Farm gate budgets for P and K were collated using farm records, measurements and standard tables of nutrient contents for a number of organic farms and rotations on organic farms. The availability of measured values of nutrient content varied from system to system and for the rotations trials at Tulloch and Woodside, SAC, some measurements of crop P and K contents (Section 3.3.3) were made retrospectively and their impact on the calculation of the nutrient budgets investigated.
The difference between the sum of inputs and the sum of the outputs gives the farm/rotation nutrient budget. If the inputs and outputs balance, the farming system is considered to maintain soil fertility, while a surplus of nutrients can provide an indication of the potential for increased environmental losses of nutrients, and a deficit can raise questions of sustainability. The farm nutrient balance can also provide a guide to the efficiency with which imported nutrients are converted into produce (Watson & Stockdale, 1998).
The farm gate budget approach does not provide information on soil processes or biological inputs and outputs of nutrients, which are particularly important for N. For some farming systems, some internal flows were therefore also quantified. These flows may be associated with major losses from the system e.g. the loss of K from manure heaps during storage has been found to be particularly high. The use of more complex budgets therefore provided us with more information. However, as the complexity of the approach increased there was often a need to estimate increasing numbers of variables which can increase the errors associated with the overall budget. Temporal flows are also important as P and K inputs are often made to the ley phase of the rotation and then released into plant available forms throughout the whole rotation. An average P or K balance for the farm may also mask important differences between fields.
3.2 Compilation of data from soil analysis
Soils in England and Wales are routinely analysed for available P using Olsen-P (Section 3.3.3) and for available K using ammonium nitrate (Section 3.3.3) or ammonium acetate extraction. Soils can be grouped into categories, the soil index, where soil indices of 1 or less are thought to indicate a deficit of P or K in the soil . The soil P and K index is then used to indicate potential crop deficits, the likelihood of crop response to new P and K additions and to plan fertilisation strategies. Data is compiled by the Representative Soil Sampling Scheme (Skinner et al, 1992).
An alternative method for determining soil P is the series of Balzer-P extractions (Section 3.3.3). The K extracted in the double lactate extraction is also thought represent plant available K. For arable cropping and grassland, acceptable levels of P and K to maintain productivity are between 100 and 300 mg P kg-1 soil and between 100 and 200 mg K kg-1 soil, respectively, extracted in the double lactate extraction (EFRC, 1999). Data for both the standard and Balzer extractions on soils submitted for analysis to the Organic Advisory Service during 1997 were collated anonymously in an MS Access database. These results were compared with the data of the P and K status of UK arable soils compiled by the Representative Soil Sampling Scheme.
3.3 Experimental work
To maximise the value which could be obtained from the experimental work an integrated series of
experiments were planned (Figure 1), so that links could be drawn between the contrasting approaches and to other previous work.
Figure 1 Organisational chart showing how experimental designs were integrated
Comparison of extraction methods Selection of soils and sampling occasions
Incubation plant uptake Selection of soils and treatments
Greenhouse experiment 3 soils
Limited fertilisers and mixes
Field experiment
Duplicating sites and treatments of greenhouse Incubation experiment
4 soils
All fertilisers and mixes
3.3.1 Sites and soils
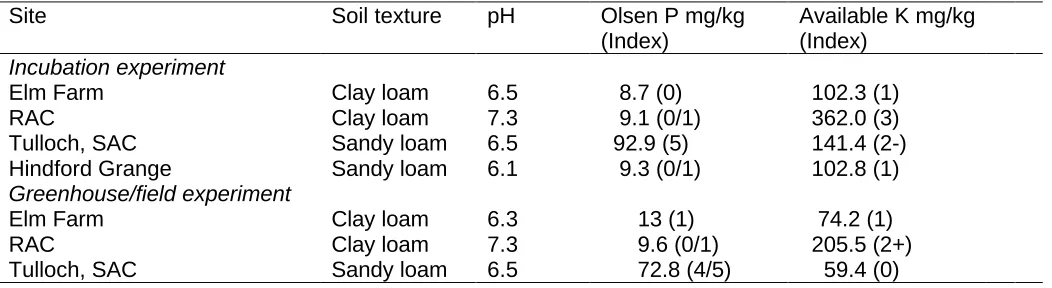
To maximise the number of fertilising materials that could be tested, the number of soils used was initially restricted to 4 key soils (Table 1). The soils chosen represent typical soils used in organic production in the UK with an expected contrast in both in nutrient supply and retention characteristics, related to texture, organic matter content and calcareous vs. non-calcareous sites. For the field trials, the Hindford Grange site
(Cheshire/Welsh border) was excluded, as this would have proved very difficult to service, due to its distance from the project partners, and the inclusion of a 4th soil in the greenhouse experiment would have increased the workload to an unfeasible level.
Table 1 Soil characteristics for sites used in the experimental work
Site Soil texture pH Olsen P mg/kg
(Index)
Available K mg/kg (Index)
Incubation experiment
Elm Farm Clay loam 6.5 8.7 (0) 102.3 (1)
RAC Clay loam 7.3 9.1 (0/1) 362.0 (3)
Tulloch, SAC Sandy loam 6.5 92.9 (5) 141.4 (2-)
Hindford Grange Sandy loam 6.1 9.3 (0/1) 102.8 (1)
Greenhouse/field experiment
Elm Farm Clay loam 6.3 13 (1) 74.2 (1)
RAC Clay loam 7.3 9.6 (0/1) 205.5 (2+)
Tulloch, SAC Sandy loam 6.5 72.8 (4/5) 59.4 (0)
3.3.2 Fertilisers
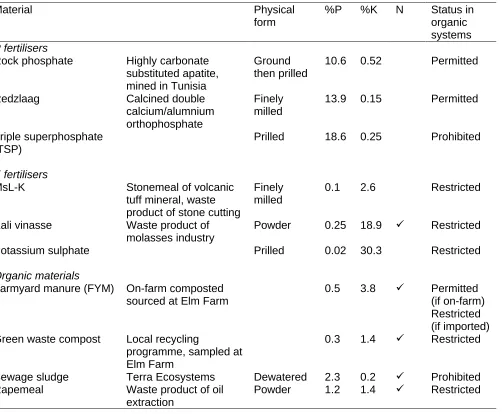
The fertilising materials used in the experimental work were selected to give a range of likely availabilities for plant uptake and to give a mix of mineral and organic sources of P and K (Table 2). Triple superphosphate was included in the incubation experiment to give a reference material, whose dynamics could be compared to other incubation studies. For K , potassium sulphate, which is included in the UKROFS standards as a
restricted material could be used as a reference. Although currently prohibited from use in organic farming systems, sewage sludge was included in the incubation experiment. This was originally intended to be a composted pelleted form, but this was not available at the timing required. A subset of these materials was then used in the greenhouse and field trials.
[image:5.595.24.550.458.602.2]Table 2 Characteristics of fertilising materials used in the experimental work
Material Physical
form
%P %K N Status in
organic systems
P fertilisers
Rock phosphate Highly carbonate substituted apatite, mined in Tunisia
Ground then prilled
10.6 0.52 Permitted
Redzlaag Calcined double
calcium/alumnium orthophosphate
Finely milled
13.9 0.15 Permitted
Triple superphosphate (TSP)
Prilled 18.6 0.25 Prohibited
K fertilisers
MsL-K Stonemeal of volcanic
tuff mineral, waste product of stone cutting
Finely milled
0.1 2.6 Restricted
Kali vinasse Waste product of molasses industry
Powder 0.25 18.9 ü Restricted
Potassium sulphate Prilled 0.02 30.3 Restricted
Organic materials
Farmyard manure (FYM) On-farm composted sourced at Elm Farm
0.5 3.8 ü Permitted
(if on-farm) Restricted (if imported) Green waste compost Local recycling
programme, sampled at Elm Farm
0.3 1.4 ü Restricted
Sewage sludge Terra Ecosystems Dewatered 2.3 0.2 ü Prohibited
Rapemeal Waste product of oil
extraction
Powder 1.2 1.4 ü Restricted
3.3.3 Analytical methods
The analytical methods for soils and plant material are presented in summary in this section. Because of the critical importance for many of these methods of exact replicability of procedures, the full experimental protocols of the methods used are given in Appendix 1, where possible.
Available P in soil (Olsen P)
5 g of air dried soil (<2mm) was weighed into a flask and 100 ml 0.5M sodium bicarbonate added. The flask was shaken at 20°C for exactly 30 minutes. The extract was then filtered immediately through Whatman 42 filter paper (MAFF, 1986, RB427). The filtered extracts were analysed immediately by continuous flow analysis (Skalar). Throughout the procedure the contact time and temperature is critical and should not be varied between batches.
Available K in soil (Ammonium nitrate extractable K)
10 g of air dried soil (<2mm) was weighed into a flask and 50 ml 1 M ammonium nitrate added. The flask was shaken (100 rpm) for 30 minutes at 20°C (MAFF, 1986, RB427). The extract was then filtered through Whatman 40 filter paper. The extracts were analysed by ICP and can be frozen prior to analysis.
‘Total’ P and K in soil (Aqua regia digest)
0.250 g of finely milled air dried soil was weighed into a graduated 25 ml test tube and 1 ml conc. nitric acid and 4 ml 25% HCl added (aqua regia). The tube was allowed to stand at room temperature for 2 hours and then digested overnight in a thermostatically controlled heating block. The digestion was completed in 5 ml of 25% HCl (McGrath and Cunliffe, 1985) and the digest analysed by ICP in a 5% HCl matrix.
Reserves of P in soil (Hedley fractionation)
The Hedley fractionation procedure is a series of sequential extraction procedures undertaken on the same aliquot of soil (Cross and Schlesinger, 1995). 0.50 g soil of finely milled soil was weighed into a centrifuge tube. Extractions were then carried out sequentially with 0.1 M calcium chloride, 0.5M sodium bicarbonate (16 hour extraction), 0.1 M sodium hydroxide, 1.0 M sodium hydroxide and 0.5 M sulphuric acid, which progressively extract less-plant available forms of P in soil. Inorganic forms of P in the extracts were determined by the ammonium molybdate-ascorbic acid method (Murphy and Riley, 1962) measured on a spectrophotometer and total P in the extracts was determined similarly following persulphate oxidation of the extracts, organic forms of P can then be determined by difference (Williams et al, 1995).
Reserves of P in soil (Balzer extractions)
The Balzer extraction procedure involves the extraction of P by three different solutions; 2% citric acid, double lactate, and sodium acetate and is thought to provideadditional information on soil P by determining soil reserve, plant available and water soluble P (Balzer & Balzer-Graf, 1984). These extractions are not carried out sequentially. The extractions cannot reliably be carried out on soils with pH >7. Exact method details are difficult to obtain and the method is notoriously sensitive to extraction times and conditions (as for Olsen P). Where this procedure was necessary, samples were therefore submitted to NRM laboratories who routinely carry out these extractions for the Organic Advisory Service.
Slowly available K (boiling nitric acid)
2.50g of finely ground soil was added to a digestion tube and 25 ml 1N nitric acid added. The tubes were placed in a water bath and the temperature gradually increased until the acid was just boiling. The acid was allowed to boil gently for 10 minutes. The soil and acid mixture was then filtered through a Whatman 42 and the soil washed with 4 x 15 ml 0.1 N nitric acid into a 100 ml volumetric flask. After cooling the solution was made up to 100 ml with deionised water. This method is also critically senstive to contact time between the soil and the 1.0 N acid; the cooling time between boiling and pouring of the acid should therefore be standardised.
Biomass P (fumigation-extraction)
Following fumigation of soil for 24 hours with chloroform (CHCl3) there is an increase in inorganic P
extractable by 0.5 M sodium bicarbonate. Biomass P can be estimated from this flush with correction made to account for adsorption of P on soil colloids (Brookes et al, 1982). Moist soil (equivalent to 5 g dry soil) was weighed out in triplicate, fumigated for 24 hours in a desiccator under vacuum. Extractions were then carried out as for Olsen P. Biomass P was calculated from the the difference between the inorganic P extracted from fumigated and unfumigated soils.
Total P, K and other trace elements in plant material (Nitric perchloric digest)
0.250 g of finely milled plant sample (0.500 g for grain) was weighed into a graduated 25 ml test tube and 5 ml nitric perchloric acid mixture added (85% conc. nitric acid 15% 70% perchloric acid). The tube was allowed to stand at room temperature for 2 hours and then digested overnight in a thermostatically
controlled heating block. The digestion was completed in 5 ml of 25% HCl and the digest analysed by ICP in a 5% HCl matrix.
Soil pH
10 g of soil (< 2mm) is weighed into a glass vial. Distilled/deionised water is added to give a soil: solution ratio of 2.5. the vial was shaken to mix and left to stand for 30 minutes. pH is read using a calibrated Whatman pH meter.
Soil mineral N (2M KCl extraction)
Approximately 12 g of field moist soil was weighed accurately into extraction bottles and 40 ml 2M KCl added, so that the ratio of extractant to dry soil was 4-5. The bottles were shaken for 1 hour and then allowed to settle for approximately 30 minutes to allow some of the suspended clay to settle before filtering through Whatman 1 filter paper. The extracts were analysed on the Skalar continuous flow analyser for nitrate and ammonium concentrations.
3.3.4 Incubation experiment
Topsoil (0-25 cm) was collected from Elm Farm, RAC, Tulloch Farm SAC, and Hindford Grange in October 1998 with approximately 200 kg of soil collected from each site and transferred to IACR-Rothamsted. The soil was sieved at field moisture content to pass a 0.5 cm sieve and units of 3.5 kg weighed into incubation
containers, which could be sealed to reduce moisture loss but gaseous exchange maintained.
All the fertilising materials identifed in Table 2 were used in this experiment. Incubations were carried out with rates approximating to those typically applied in one application under current farm practice (Lampkin and Measures, 1999) i.e. 78 kg P ha-1 for P fertilisers (= 180 kg P2O5 ha-1 applied on a rotational basis), 41.5 kg K ha-1 for K fertilisers (= 50 kg K2O ha-1 applied annually under restriction of certifying body), 25 t ha-1 fresh weight for farmyard manure and green waste compost, 8 t ha-1 dry solids for sewage sludge and 5 t ha-1 fresh weight for rape meal. Mixes of mineral fertilisers (P and K sources) and organic materials at these rates were also applied as treatments to investigate the possibility of interactive effects between the materials on
application. Additionally very high rates of the mineral fertilisers (equivalent to 750 kg P/K ha-1) were used to match rates commonly used in small-scale laboratory incubations, which have investigated the release characteristics of such materials (e.g. Kanabo and Gilkes 1988; Robinson and Syers, 1990).
Fertilisers were mixed uniformly with the soil in the incubation containers and soil sampled immediately and after 2, 4, 8, 16, 32 and 85 weeks (S0, S2 etc.). Soil was analysed fresh for biomass P, but for all other
determinations soil was dried and milled to pass a 2 mm screen. All treatments were analysed for available P and K (Section 3.3.3.) at each sampling, but other measurements were made for subsets of treatments on only some sampling occasions. After the final sampling a sub-set of treatments were selected (Table 3) and
[image:8.595.21.576.410.515.2]cropped with a grass-clover mixture. 400 g of soil were weighed into 3 replicate small pots, which were sown with a grass-clover ley mixture at 2x field rate to ensure sufficient germination. Pots were laid out in replicate blocks in a sand bed, which received natural rainfall, but was protected by a net cage from bird damage. Extra watering was provided as necessary. These soils were also subsampled and extracted for soil mineral N before cropping (Section 3.3.3). Grass-clover was cut to 1 cm above the soil surface on 25th September, 26th October and 13th February. Samples were weighed and dried. However, all the cuts were amalgamated before milling to give sufficient material for P and K analysis.
Table 3 Details of subset of treatments selected from incubation experiment for plant uptake study.
Soils Treatments
RAC Control FYM
Elm Farm Rock phosphate Compost
SAC Redzlaag Sewage sludge
Triple superphosphate Rape meal
MsL-K FYM and rock P
Kali vinasse FYM and MsL-K
Potassium sulphate
3.3.5 Greenhouse experiment
Intact cores (0-25 cm) were taken using sampling sleeves (plastic drainpipe of 11 cm internal diameter) from grass-clover swards (1-2 years old) in the area immediately adjacent to the field trials at Elm Farm, the Royal Agricultural College and Tulloch Farm, SAC (Section 3.3.6) in March 1999. Cores were transferred from all sites to IACR-Rothamsted, where they were randomly allocated to fertiliser treatments (6) and crop
rotations (4) (Table 4); there were 216 cores in total, with each treatment/rotation combination replicated 3 times. The fertiliser treatments were a subset of those included in the incubation trial. FYM was included due to its key role in on-farm recycling, and the interactions of FYM and rock P (the most appropriate form was chosen with regard to current advice on soil pH). The K fertilisers included were chosen to reflect the interest in slow release K sources (MsL-K) and renewable sources of nutrients for organic farming systems. The cropping rotations were selected to reflect simplified but typical rotations used in mixed organic farming
systems and also to allow a simple investigation of the effect of mycorrhizal associations on fertiliser recovery, as mustard does not form any mycorrhizal associations.
The cropped cores, which would be sown with oats or mustard, were emptied from the sampling sleeves and roughly broken through a 5 cm mesh sieve to simulate cultivation, fertilisers were mixed with the soil and the cores were repacked into the sampling sleeves. Fertilisers were surface applied to intact cores of grass-clover. The cores were stood in c. 250 g horticultural sand in plant pots with watering trays. The greenhouse was lighted with supplementary lighting if necessary between 5 am and 7 pm and the temperature minimum was set at 18°C during the day and 16°C overnight. Cores were watered daily using deionised water and more often in very warm weather.
Table 4 Treatments applied to cores from Elm Farm, RAC and SAC in the greenhouse experiment
Fertiliser treatments Crop rotations
Rock phosphate (redzlaag at RAC), 78.5 kg P ha-1 Intact grass-clover (2 ‘seasons’), Oats, Oats (GOO) Kali vinasse, 41.5 kg K ha-1 Intact grass-clover (2 ‘seasons’), Mustard, Oats (GMO) MsL-K, 41.5 kg K ha-1 Oats, Oats, Grass-clover (2 ‘seasons’) (OOG)
Farmyard manure (FYM), 25 t ha-1 Mustard, Oats, Grass-clover (2 ‘seasons’) (OMG) FYM and rock P, 25 t ha-1 and 78.5 kg P ha-1
Control, no fertiliser applied
After a fortnight the intact cores of grass-clover were cut to a height of 1 cm above the soil surface using scissors (Cut 1) and the cropped cores were sown with either black mustard or spring oats to give
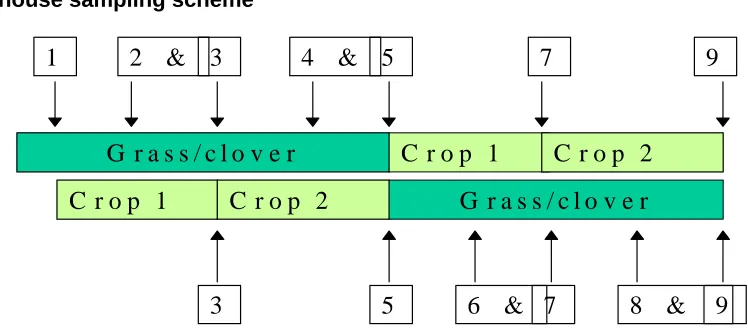
approximately 5 plants per core. Two harvests of grass-clover were taken for each crop harvest (Figure 2); the yield of these harvests was determined separately but they were combined for analysis. Following each crop harvest (cut at 1 cm above the soil surface) the cropped cores were emptied from the sampling sleeves, mixed through a 5 cm mesh sieve and repacked to simulate cultivation and soil samples (c. 100g) were taken for analysis (Cut 3 and 7). After Cut 5 all cores were ‘cultivated’ and soil samples taken. Cores were allowed to equilibriate after cultivation for a fortnight before the cores were sown with either mustard, oats or a grass-clover seed mix (33% white grass-clover, at 2x the field rate of 32 kg ha-1). The final harvest (Cut 9) was made in September 2000, cores were emptied and sieved (< 1 cm), roots were separated, soil was weighed
subsampled and dried.
Following each harvest, the plant material was separated (grass, clover, weeds or grain, straw, weeds as appropriate), dried at 80°C and milled (rotary mill with 1mm screen) before analysis of P and K content (Section 3.3.3). Soil samples were air-dried and ground to pass a 2mm screen before analysis for available P and K (section 3.3.3).
[image:9.595.107.481.508.674.2]Mycorrhizal colonisation of roots was determined on root samples taken from cores before the treatments were applied and at Cut 5, following either a continued grass-clover ley, two crops of oats or mustard followed by oats. Colonisation was determined using Trypan blue solution to stain fungal tissue (Koske and Gemma, 1989). Percentage colonsiation of roots was established using the gridline intersect method under a dissectin microscope (Giovanetti and Mosse, 1980).
Figure 2 Greenhouse sampling scheme
G r a s s / c l o v e r
C r o p 1
C r o p 2
G r a s s / c l o v e r
C r o p 1
C r o p 2
1
2 &
3
4 &
5
7
9
3
5
6 & 7
8 &
9
3.3.6 Field experiment
Experimental plots (18 per site) at least 3 x 5 m were established in grass-clover swards (1-2 years old) at Tulloch Farm, SAC; Elm Farm and RAC in Spring 1999. 6 fertiliser treatments were used with three replicates in a blocked design (duplicating those used in the greenhouse experiment, Table 4). The centre strip of each plot was cut using an Allen Scythe with a 1m cutting width at timings corresponding to the silage cuts on the adjacent farm-managed fields in 1999 and 2000 (Table 5). Fertilisers were surface applied by hand following a the 1st cut of silage in 1999, which was had been cut on a plot by plot basis as a baseline to indicate the variation in yield and vegetational composition between the plots before the treatments were applied. Soil samples were taken (0-25 cm) at the establishment of the trial and in the autumn of 1999 and 2000.
At each silage cut the total herbage yield for the harvested strip was measured on the field. A sub-sample was removed, separated (grass, clover, weeds), dried at 80°C and milled (rotary mill with a 1 mm screen) before analysis of P and K content (Section 3.3.3). Soil samples were air-dried and ground to pass a 2mm screen before analysis for available P and K (section 3.3.3).
Table 5 Dates of silage cuts on the field trials in 1999 and 2000
SAC Elm Farm RAC
July 2nd1999 May 20th 1999 June 17th 1999
September 7th 1999 July 22nd 1999 July 23rd 1999
October 8th 1999 October 11th 1999
9th June 2000 31st May 2000
21st August 2000 1st August 2000 21st September 2000
Trial abandoned after plot markers removed by accident
3.4 Development of farm assessment and recommendation system for P and K management
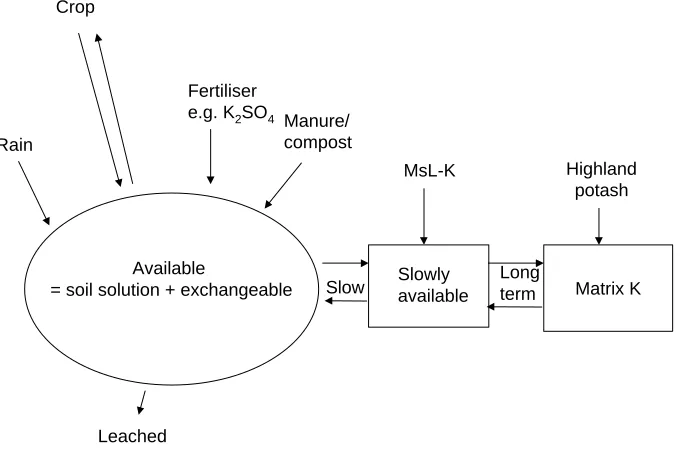
Information taken from a review of the literature was first used to construct simple flow diagrams (Figure 3) summarising current understanding of the critical pathways of P and K transport and transformation in soils with particular reference to low input or organic systems (e.g. Hedley et al, 1995). As far as possible the user inputs needed would be available from routine soil analysis and farm records – ie soil texture, available P and K pools etc. In the schematic flow diagrams, the available K pool represents that extracted by ammonium nitrate, while the available P extracted by Olsen (and called available P throughout this report) represents both the available and labile P pools. The available P pool is identified as that which would be extracted by CaCl2. Simple relationships and pedo-transfer functions were used to describe the pools and processes from these inputs, as far as possible obtained independently from the literature.
Once independent data was obtained from the greenhouse and field experiments it was used to evaluate both the underlying hypotheses of the models and model parameters where appropriate.
Figure 3 Processes described by simple relationships in a) soil K cycle
Matrix K
Slow Longterm
Rain Crop
Fertiliser e.g. K2SO4
Manure/ compost
Leached Available
= soil solution + exchangeable Slowly available
MsL-K Highland
potash
[image:10.595.40.387.511.736.2]b) soil P cycle
4.0 Results
The literature review highlighted that:
• there is lots of information on the availability and efficiency of use of soluble fertilisers; • there is some work on the use of rock phosphate but usually applied alone at high rates;
• work on manures has tended to concentrate on N use, and even this has only been interpreted in a limited way for farmers;
• the very variable nature of crop residues and manures between farms, due to management, housing and diet differences, which makes general recommendation difficult;
• there is little independent information on new materials and no standard ways of testing;
• the mixing of non-soluble fertilisers with organic sources may improve the release characteristics and availability of P and K sources.
4.1 Nutrient budgets
Budgets presented (except for Rotation 1 where all nutrient offtakes were measured) are anticipated to have an accuracy of ± 2 kg ha-1 year for P and ± 5 kg ha-1 year for K, and do not account for any supply of P or K from soil reserves.
4.1.1 Rotational budgets
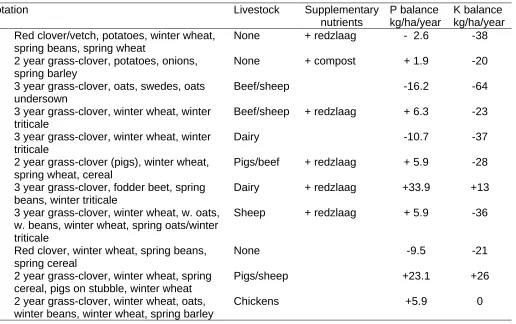
Where P and K budgets were compiled for rotations on organic farms around the UK, both surpluses and deficits are seen for P and K (Table 6, Appendix 2). These differences arise from the contrasting rotations, varied interactions with on-farm livestock and use of supplementary nutrients and are typically observed in similar studies of nutrient budgets in organic farming systems (e.g. Fagerberg et al, 1996; Nguyen et al, 1995; Nolte and Werner, 1994).
Where supplementary P is not applied, relatively large P deficits are seen (Rotations 3, 5 and 9). In Rotations 10 and 11 the use of supplementary feed for the non-ruminant livestock may have caused the P surpluses, even in the absence of supplementary P. However, imported feed was not accounted for directly in these rotational budgets. In most cases where supplementary P was applied, any P deficit was cancelled out. The large P surplus in Rotation 7 would be removed if the supplementary P fertiliser currently used was withdrawn from the system.
Significant K deficits are common. Only rotation 2 received any supplementary K (in compost). Both Rotations 7 and 10 received substantial inputs of slurry to the rotation which returned more K to the rotation
Slowly available
Deposition Crop
Rock P Manure/
compost
Leached
Available Labile
Biomass
Organic P
(mycorrhiza)
than was removed, while in the other livestock rotations inputs of K via manure were not sufficent to balance the removal in silage and other crops (except Rotation 11). The stockless rotations did not have the largest K deficits.
[image:12.595.41.557.256.580.2]P and K budgets varied greatly between rotational phases (Appendix 2), as would be expected. The largest P surpluses were seen in years where supplementary P fertiliser was applied. K deficits were largest where large crops of silage were removed from the field without any use of slurry (up to – 141 kg K ha-1), but this was usually offset by a large K application in another year of the rotation. It is therefore critical to consider budgets over complete rotations, and in conditions which represent the typical range of management practices and yields for the farming system.
Table 6 Summarised rotational budgets for organic farming systems (Full rotational information and detailed budgets in Appendix 2).
Rotation Livestock Supplementary
nutrients
P balance kg/ha/year
K balance kg/ha/year 1 Red clover/vetch, potatoes, winter wheat,
spring beans, spring wheat
None + redzlaag - 2.6 -38
2 2 year grass-clover, potatoes, onions, spring barley
None + compost + 1.9 -20
3 3 year grass-clover, oats, swedes, oats undersown
Beef/sheep -16.2 -64
4 3 year grass-clover, winter wheat, winter triticale
Beef/sheep + redzlaag + 6.3 -23
5 3 year grass-clover, winter wheat, winter triticale
Dairy -10.7 -37
6 2 year grass-clover (pigs), winter wheat, spring wheat, cereal
Pigs/beef + redzlaag + 5.9 -28
7 3 year grass-clover, fodder beet, spring beans, winter triticale
Dairy + redzlaag +33.9 +13
8 3 year grass-clover, winter wheat, w. oats, w. beans, winter wheat, spring oats/winter triticale
Sheep + redzlaag + 5.9 -36
9 Red clover, winter wheat, spring beans, spring cereal
None -9.5 -21
10 2 year grass-clover, winter wheat, spring cereal, pigs on stubble, winter wheat
Pigs/sheep +23.1 +26
11 2 year grass-clover, winter wheat, oats, winter beans, winter wheat, spring barley
Chickens +5.9 0
Analysis of the crop products (roots, grain, straw and silage) from the SAC rotational trials at Woodside and Tulloch (Rotation 3) showed that for these sites the average estimates of P and K contents slightly
overestimated grain and root P and K removal. The P content of silage and the K content of straw were significantly overestimated. Inclusion of the actual P and K contents decreased the rotational outputs by approximately 3 kg P ha-1 year-1 and up to 13 kg K ha-1 year-1. While this suggests that the actual P and K deficits would have been reduced, manure samples were not retained for analysis and consequently may also have contained lower concentrations of P and K than the average values used in the calculation of the
budgets. If this were the case rotational inputs of P and K would also have been reduced and the overall budget deficts may not have changed. Actual P and K contents also varied significantly with season.
4.1.2 Whole farm budgets for mixed farm systems
While rotational budgets can represent the whole farm nutrient budget for stockless systems, in mixed systems a consideration of all the nutrient flows across the farm gate is critical. Where P and K budgets were compiled for mixed farming systems around the UK (Table 7, Appendix 2), both P deficits and surpluses were seen, but in contrast to the rotational budgets only K surpluses were calculated. In these systems the import of nutrients to the farm system in supplementary feed for livestock (dominantly protein-rich rations) and in
materials (usually straw) for livestock bedding are substantial. This has also been observed in conventional dairy systems (Haygarth et al 1998), leading to recommendations for significantly reduced recommendations for P fertiliser use in such systems.
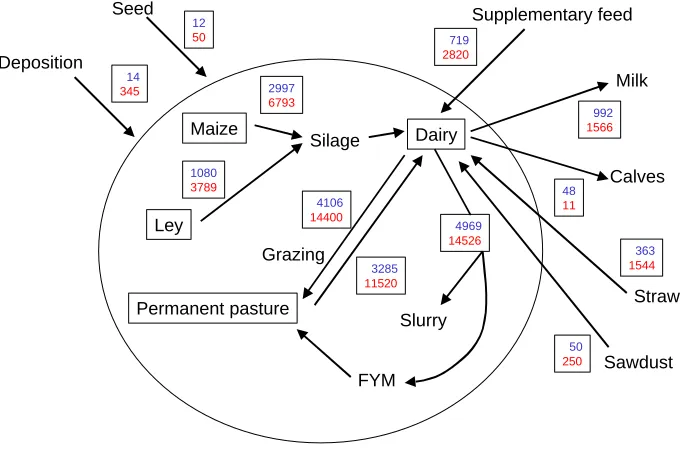
[image:13.595.20.568.334.401.2]Where the internal flows of P and K are considered (Figure 4), it can be seen that for any mixed livestock system (especially the intensive dairy system illustrated), the internal flows of P and K associated with livestock excreta, either returned to the field during grazing or handled as manure and slurry, are substantial. Manures represent a significant resource of P, K and other nutrients. Careful management during collection, storage and subsequent handling is critical to minimise losses and maximise their value to the farmer, as a curency which can be used to transfer nutrients both spatially and temporally around the farming system.
Table 7 Summarised farm gate budgets for mixed organic farming systems (Full farm information and detailed farm gate budgets in Appendix 2).
Farm type Location P balance kg/ha/year K balance kg/ha/year
Upland beef/sheep 1 Northumberland -0.2 + 4.7
Lowland beef/sheep/arable Gloucestershire +1.5 +20.3
Lowland dairy 1 Cheshire -3.9 + 6.2
Lowland dairy 2 Kent -1.2 +24.5
Figure 4 Internal flows budget for P (kg P year-1) and K (kg K year–1) for an intensive lowland dairy farm (Lowland Dairy 2).
4.1.3 Soil analysis results
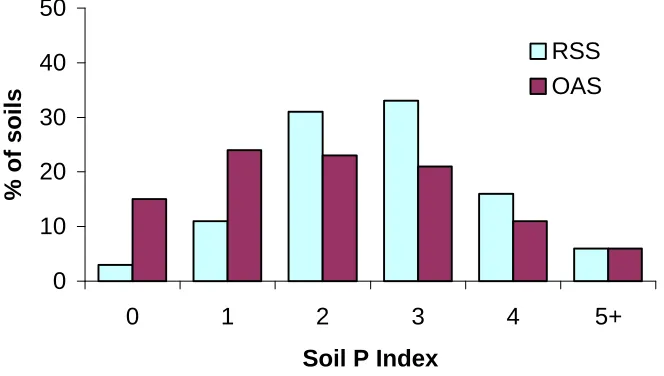
Data compiled from the 1997 analyses of soils submitted for analysis by the Organic Advisory Service samples from organic farms showed that 39% (Olsen-P) were at P index 0 or 1, with 23% at Index 2, and 38% at Index 3 or above (Figure 5). Double lactate extraction of P and K showed that 86% of soils were deficient in
Seed
Deposition
Grazing Maize
Ley
Permanent pasture
FYM Slurry
Dairy
Milk
Calves
Straw
Sawdust Supplementary feed
Silage
4969
14526
4106
14400
3285
11520
50
250
363
1544
48
11
992
1566
719
2820
1080
3789
2997
6793
14
345
12
50
[image:13.595.33.383.472.698.2]available P and 36% were deficient in available K. However, these data represent a mixture of land uses, including grassland, and may be biased, since farmers are more likely to send soils for analysis at the “lowpoint” in a rotation or when a deficiency is suspected.
In arable soils under conventional farming practice, only 15% were recorded at a P Index of 0 or 1
(deficient) compared to 30% at Index 2 (adequate) and 55% at or above Index 3 (Figure 5). For K, 30% of the soils tested were at index 0 or 1, 50% at Index 2 and 20% at 3 or above. A different situation exists for
[image:14.595.122.454.264.452.2]grassland, with 20-25% of soils at a P Index of 0 (Chambers et al., 1996). Although intensively managed grassland systems receive high inputs of fertiliser, 43 % of grassland in England and Wales receives no fertiliser (Burnhill et al., 1993; Burnhill et al., 1997).
Figure 5 Percentage of soils analysed as part of the Representative Soil Survey (RSS) or submitted for analysis to the Organic Advisory Service (OAS) in each P index category.
0
10
20
30
40
50
0
1
2
3
4
5+
Soil P Index
% of soils
RSS
OAS
Where available P and K were measured (Section 3.3.3) throughout one full rotation at Terrington (Rotation 1) no significant changes in these pools of P or K in soil could be measured despite the K deficit estimated in the nutrient budgets. There was also no significant change through the different phases of the rotation. In the rotations trials at SAC (Rotation 3) available P and K was measured using the modified Morgans method (Scottish standard procedure) . Again despite significant P and K deficits no significant changes were measured in these pools through the course of the rotation.
These data show that:
• P and K budgets provide a semi-quantitative way of assessing the impact of rotations/farming systems on soil reserves.
• However, nutrient budgets do not give information about the availability of the P or K for plant uptake or the seasonal dynamics of P and K.
• Organic farming systems can show both P and K surpluses and deficits depending on management. • Imports of supplementary feed and bedding materials provide a key route for nutrient supply to mixed
systems
• In mixed systems, manures represent a significant resource of both P and K, which can be used for both temporal and spatial distribution of these nutrients. However, manure handling also therefore gives significant opportunity for losses, particularly of K from the system.
• In rotations, the cutting of silage represents a major export of K from the field. Careful consideration needs to be given to the return of manure/slurry on a rotational basis to redress this export.
• K deficits are common in organic rotations. However, these are close to the level which can be sustained from the weathering of mineral reserves in many UK soils (Goulding and Loveland, 1986). However, more consideration needs to be taken of the potential of soils to supply K when rotations and management plans are designed.
• There is no reason why organic farming systems, operating within the current UKROFS standards, cannot achieve a nutrient budget in line with long-term sustainability of soil P and K.
• However, the implications for resource use sustainability of permitted inputs at a larger scale should be further considered.
• Continued monitoring of soil P and K levels in long-term organic trials is necessary to demonstrate these conclusions.
4.2 P
4.2.1 Release and plant uptake of P
In the incubation experiment, the largest differences in available P continued to be between the soils; available P was always considerably higher at SAC (Table 1). On the low P index soils, sewage sludge and triple superphosphate (TSP) increased available P significantly (+6.9 and +4.1 mg kg-1 respectively) and available P was also increased by the other organic materials (compost, +2.1, rape meal, +1.6, and FYM, +1.1 mg kg-1). Rock P and redzlaag increased available P slightly but not significantly. Available P increased slightly to S4 but there were then no further changes in the available P in the incubation soils in the absence of a P sink.
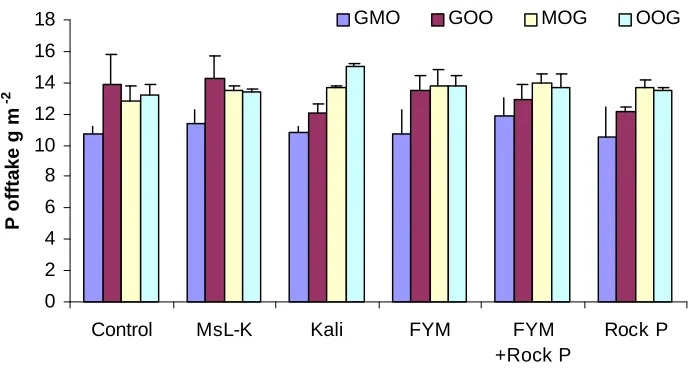
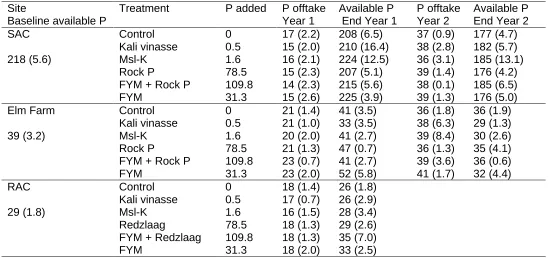
There were no significant effects of any fertiliser treatment on the P content of grass-clover swards or arable crops in the greenhouse (Figure 6) or field experiment. In all soils the P offtakes were not significantly increased above those of the control soil except where driven by increased yields – e.g. in the presence of FYM in the field experiment at Elm Farm (Table 8). This was almost certainly not a response to additional P supply. However, at Elm Farm there was some indication that available P in soil was increased slightly but not significantly following addtions of FYM and rock P, either separately or in combination (Table 8).
[image:15.595.42.392.536.723.2]In the greenhouse experiment P offtake seemed to be driven by plant demand rather than limited by soil supply. The mustard crop in the second cropping phase did not yield as well as the crop in the first phase and this caused a significantly lower P offtake for the GMO rotation as a whole. There were significant differences between sites with crops grown on soil taken from SAC and Elm Farm taking up more P than those from RAC, but again this reflected the yield levels achieved and consequent crop demand rather than the potential P supply on these soils.
Figure 6 Cumulative P offtake (g m-2) for four contrasting rotations on the cores taken from Elm Farm. Means of three replicates with standard errors.
0 2 4 6 8 10 12 14 16 18
Control MsL-K Kali FYM FYM
+Rock P
Rock P
P offtake g m
-2
GMO GOO MOG OOG
Table 8 Available P in soil (kg ha-1) and P offtake (kg ha-1) for field experiments. Means given with SE of the mean in brackets.
Site
Baseline available P
Treatment P added P offtake Year 1
Available P End Year 1
P offtake Year 2
Available P End Year 2
SAC Control 0 17 (2.2) 208 (6.5) 37 (0.9) 177 (4.7)
Kali vinasse 0.5 15 (2.0) 210 (16.4) 38 (2.8) 182 (5.7)
218 (5.6) Msl-K 1.6 16 (2.1) 224 (12.5) 36 (3.1) 185 (13.1)
Rock P 78.5 15 (2.3) 207 (5.1) 39 (1.4) 176 (4.2)
FYM + Rock P 109.8 14 (2.3) 215 (5.6) 38 (0.1) 185 (6.5)
FYM 31.3 15 (2.6) 225 (3.9) 39 (1.3) 176 (5.0)
Elm Farm Control 0 21 (1.4) 41 (3.5) 36 (1.8) 36 (1.9)
Kali vinasse 0.5 21 (1.0) 33 (3.5) 38 (6.3) 29 (1.3)
39 (3.2) Msl-K 1.6 20 (2.0) 41 (2.7) 39 (8.4) 30 (2.6)
Rock P 78.5 21 (1.3) 47 (0.7) 36 (1.3) 35 (4.1)
FYM + Rock P 109.8 23 (0.7) 41 (2.7) 39 (3.6) 36 (0.6)
FYM 31.3 23 (2.0) 52 (5.8) 41 (1.7) 32 (4.4)
RAC Control 0 18 (1.4) 26 (1.8)
Kali vinasse 0.5 17 (0.7) 26 (2.9)
29 (1.8) Msl-K 1.6 16 (1.5) 28 (3.4)
Redzlaag 78.5 18 (1.3) 29 (2.6)
FYM + Redzlaag 109.8 18 (1.3) 35 (7.0)
FYM 31.3 18 (2.0) 33 (2.5)
Mycorrhizal colonisation was significantly different between sites at the start of the greenhouse experiments with significantly greater % colonisation of roots at RAC (29% on average) than at Elm Farm (7%) or SAC (3%). However, at Cut 5 there were no significant differences between sites in % colonisation. RAC colonisation had increased slightly to 38%, while the warmer conditions in the greenhouse had favoured a highly significant increase in mycorrhizal colonisation in cores taken from SAC (34%). There was no significant effect of crop sequence or fertiliser treatment on mycorrhizal colonisation. Mycorrhizal colonisation was not reduced in the arable cores, despite soil disturbance, and the inclusion of mustard (a crop which does not form mycorrhizal associations) did not seem to reduce mycorrhizal colonisation in subsequent crops. There was some indication that mycorrhizal colonisation was maintained at a higher level in control treatments, and indications that fertiliser treatments may have behaved differently under different land use (arable, fertiliser incorporated versus grass, fertiliser surface applied) but these differences were not statistically significant in this experiment. Mycorrhizal activity is strongly seasonal, and varies between mycorrhizal species, thus the results obtained may have been strongly influenced by experimental design.
4.2.2 Prediction of P availability and soil analysis
Fractionation of the reserves of P in soil showed significant pools of organic P in soils treated with FYM, not revealed by any other method (Figure 7). While the largest increases in organic P were seen in the pool extracted in the step using NaOH, significant amounts of organic P were also extracted in the bicarbonate extraction of the Hedley fractionation procedure (Figure 7). Total amounts of P extracted using a 16 hour extraction were 3-4 times greater than the P extracted using the 30 minute standard extraction time for
available P (Section 3.3.3). However, the pattern of soil and treatment effects was similar whether a 16 hour or 30 minute extraction was used. In the SAC soil 30% of the total P extracted in a standard 30 minute Olsen extraction was in organic forms, at RAC 60% and at Hindford Grange and Elm Farm up to 70% of the P extracted was in organic forms. These would not normally be anlysed using standard procedures.
Biomass P was significantly greater at Elm Farm (57.1 mg P kg-1) than at Hindford Grange (31.1 mg P kg-1 ) and RAC (22.5 mg P kg–1). The very high available pool in the SAC soil interfered with determination of
biomass P. There were slight but not significant increases in the pool of biomass P where TSP, FYM or compost were applied. Biomass P had a significant –ve correlation with the available P in soil (r= -0.66). The biological activity of P index, which is developed from a ratio of the amounts of P extracted in the various Balzer extracts (Beyer et al, 1992), indicated the highest activity in the Hindford Grange soil (6.33), followed by Elm Farm (7.91), RAC (7.97) and SAC (10.95). However, for each soil type the index indicated the highest
biological P activity after 16 weeks incubation in soils treated with TSP and the lowest in soils treated with Rock P. An increasing ratio indicates the dominance of the less soluble P forms in soil determined by the suite of chemical extractions and it does not clearly relate to microbial biomass P or to contents of critical enzymes (Beyer et al, 1992).
[image:17.595.41.437.305.543.2]However, the P offtake data collected in the experiments did not allow a good test of the relationship of any of these measurements to crop offtake. The treatments did not create a strong gradient of P availability and the main difference remained that between soils, with signifcantly greater P offtakes from the SAC soil than the RAC soil in most cases. Elm Farm occupied an intermediate position and it is possible that the turnover of the larger biomass P pool in this soil was able to supply P for crop uptake which would not have been identified by the routine determination of available P. The complex interacting dynamics of the organic and inorganic pools of P in soil could not be further disentangled from the experiments carried out in this project.
Figure 7 Pools of P in soil (mg kg-1) fractionated using the Hedley Fractionation for the Hindford Grange soil treated with a range of materials after 16 weeks of incubation.
These data show that :
• Typical farm rates of FYM and compost increase the available P in soil.
• Rock P and Redzlaag did not significantly increase available P in the incubation experiment and no difference between their release characteristics could be determined even on calcareous soils at typical farm rates of application. However, there was some indication of slow release in the field.
• Sewage sludge is a potential major source of P for organic farming systems, if other factors preventing its use currently (heavy metal and organic pollutant contents, potential for disease transmission) can be overcome.
• Plant offtake did not seem to be limited by P availability even on low P index soils. Yield seemed to be limited by other factors and soil P supply was able to meet crop demand.
• Organic pools of P in soil can be significant and are likely to reflect a gradient of availabilty, as for organic N in soil. Organic P is not routinely measured by any extraction procedure.
• There is a negative correlation between biomass P and available P in soils; this may reflect an increasig importance of the cycling of organic P in low P status soils receiving regular inputs of organic materials. • The complex interacting dynamics of the organic and mineral P pools in soil could not be disentangled
using the data collected.
• Interpretation of the measured P index for organic farming systems is complex 0
2 0 0 4 0 0 6 0 0 8 0 0 1 0 0 0
C ontro l F YM TS P R o c k P R o c k P + F YM
P mg/kg
C a C l2 N a H C O 3 N a H C O 3 o rganic N a O H N a O H o rg a nic H 2 S O 4
4.3 K
4.3.1 Release and plant uptake of K (greenhouse and field)
Despite the contrasting K availability in the soils used in the incubation experiment (Table 2), there was no significant interaction between site and fertiliser treatment. Immediately after incorporation the pool of K in soil was increased where Kali (+65 mg kg-1 on average), MsL-K (+46 mg kg-1 on average), K2SO4 (+69 mg kg-1 on average), FYM (+84 mg kg-1 on average), compost (+123 mg kg-1 on average) and rapemeal (+26 mg kg-1 on average) were applied. About 5 times as much K had been applied in FYM and twice as much in compost than in the K fertilisers. There were no interactions between these sources when applied as mixtures and in the absence of a sink for K in the incubation, the levels of available K measured shortly after application of the materials did not change significantly throughout the incubation, even with the potentially ‘slow-release’ source of K (MsL-K).
The treatments used in the greenhouse and field experiment (Table 4) had a significant effect on the K offtake of crops. The application of FYM, either alone or with rock P, significantly increased K offtake and the application of Kali also increased K offtake; these results were replicated in the greenhouse (Figures 8 and 9) and in the field (Table 9). The effects of these fertilisers increased in the second phase of cropping in the greenhouse experiment and persisted throughout the two seasons of the field experiment. At the end of the first season of the field experiment, available K was significantly higher following the application of Kali and FYM at all sites, and at the end of the second field season available K was still higher following these treatments at SAC (Table 9). FYM and Kali also significantly increased the K content of herbage and other crop material in both experiments, indicating that the effect on K offtake was at least partly due to K supply, as well as the increased yield in these treatments possibly due to increased N supply. In the greenhouse
[image:18.595.18.579.472.731.2]experiment, grass-clover always took off significantly more K than the equivalent arable rotations, with mustard showing slightly (but significantly) lower K offtakes than oats. The rotations with grass-clover in the first phase had significantly greater K offtakes than those with grass-clover in the second phase of cropping (Figure 9).
Table 9 Available K in soil (kg ha-1) and K offtake (kg ha-1) for field experiments. Means given with the SE of the mean in brackets.
Site
Baseline available K
Treatment K
added
K offtake Year 1
Available K End Year 1
K offtake Year 2
Available K End Year 2
SAC Control 0 109 (21.5) 190 (6.1) 211 (33.2) 138 (8.3)
Kali vinasse 41.5 115 (22.1) 365 (65.1) 266 (31.8) 200 (30.0)
178 (2.7) Msl-K 41.5 105 (15.5) 196 (5.7) 207 (11.2) 156 (8.4)
Rock P 3.9 94 (22.7) 214 (8.0) 224 (13.1) 139 (3.6)
FYM + Rock P 241.4 102 (10.1) 497 (17.3) 282 (3.5) 225 (23.3)
FYM 237.5 112 (30.9) 383 (38.6) 291 (16.6) 225 (33.1)
Elm Farm Control 0 160 (14.4) 343 (5.0) 264 (8.1) 323 (13.5)
Kali vinasse 41.5 174 (6.7) 457 (42.2) 294 (46.8) 373 (20.5)
223 (2.4) Msl-K 41.5 155 (8.3) 414 (31.9) 288 (37.2) 296 (17.5)
Rock P 3.9 166 (9.3) 470 (56.7) 274 (19.7) 330 (34.5)
FYM + Rock P 241.4 196 (25.4) 509 (82.3) 311 (19.3) 311 (25.7)
FYM 237.5 200 (22.8) 853 (46.1) 354 (13.5) 419 (29.2)
RAC Control 0 127 (9.9) 718 (12.1)
Kali vinasse 41.5 140 (2.6) 902 (81.9)
617 (9.6) Msl-K 41.5 119 (18.7) 755 (56.5)
Redzlaag 0.8 134 (6.6) 735 (38.1)
FYM + Redzlaag 238.3 156 (3.7) 957 (96.8)
FYM 237.5 156 (22.7) 1023 (105.9)
Figure 8 Cumulative K offtake (g m-2) by GMO rotation for cores taken from three sites
Figure 9 Cumulative K offtake (g m-2) for four contrasting rotations on the cores taken from RAC
4.3.2 Prediction of K availability and soil analysis
Available K declined significantly through the cropping period in the soil cores in the greenhouse (Figure 10) and there was also some evidence of a decline in the field especially where fertilisers had significantly
increased the pool of available K. Available K in soil before the growing period was also strongly correlated with plant offtake of K in the pot trial following the incubation,in the field trial and in the greenhouse experiment (Figure 11). However, one simple relationship between available K and plant offtake does not hold across all soils. The large pool of available K measured at RAC does not seem to be as ’available’ for plant uptake as available K measured at SAC or Elm Farm (Figure 11); the largest K offtakes were always measured for Elm Farm. However, new additions of K behave similarly on all soils (Section 4.3.1).
0 10 20 30 40 50 60 70 80 90
Control Rock P MsL-K Kali FYM FYM +Rock
P
K offtake g m
-2
Elm Farm RAC SAC
0 10 20 30 40 50 60 70 80
Control Rock P MsL-K Kali FYM FYM
+Rock P
K offtake g m
-2
GOO GMO OOG MOG
[image:19.595.42.391.377.557.2]Figure 10 Available K in soil (mg kg-1) from soil cores taken from Elm Farm and sampled following a crop of mustard (S3), oats (S5) and grass-clover (S9).
Figure 11 Relationship between K offtake mg kg-1 by grass-clover (Cuts 6-9) in soil cores in the
greenhouse experiment and the available K (mg kg-1) measured in the soil at the start of this cropping period (S5).
In the sandy soil at SAC most of the K in soil (86%) is extracted by boiling nitric acid, reflecting the low clay content and hence low reserves of K held in clay minerals in this soil. At RAC (21%) and Elm Farm (17%) much less of the ‘total’ soil K is extracted by boiling nitric acid (Figure 12). There are highly significant differences between the soils in the proportion of nitric acid extracted K, which is in the available K pool 5.4, 4.3 and 30.9 % at RAC, SAC and Elm Farm respectively. Only a very small fraction of the total K in soil is available 1.2, 3.7 and 5.3 % at RAC, SAC and Elm Farm respectively. However, it is this pool which is
increased dramatically with the addition of FYM ( available K increased to 11% of total K in this treatment); the small increases seen in the nitric acid and ‘total’ K extracted are due to the extraction of the available pool
0 100 200 300 400 500 600 700
0 200 400 600 800 1000
Available K (kg/ha)
K offtake (kg/ha)
SAC Elm Farm RAC
0
100
200
300
Control
Rock P
FYM
+Rock P
FYM
MsL-K
Kali
Available K (mg kg
-1
)
S3 S5 S9
[image:20.595.45.403.464.684.2]within these extracts. Additions of K fertilisers have only a small impact which is not surprising since their total addition represents only ~ 14 mg kg-1 K. However, it can be seen than additions of MsL-K affect nitric acid extractable K more than available K, while Kali has the reverse impact.
Figure12 Pools of K (mg kg-1) in the soils taken from the field experiment. Baseline soils for SAC and RAC and soils taken at the end of year 1 to show the impact of treatments at Elm Farm.
These data show that:
• When applied at typical farm rates compost and FYM significantly increase available K. • Kali vinasse and rapemeal are also good supplementary sources of available K.
• Plant offtake of K was significantly increased by both FYM and Kali vinasse; we believe that the same would also hold for compost and rapemeal under similar conditions.
• The effects of Kali vinasse and FYM on available K in soil and plant K offtake were persistent and lasted longer than one season.
• Silage crops will tend to have he highest K demand wtihn a rotation. While application of K to a preceding arable phase did increase silage K offtake above those of the control, the best silage yields and K oftakes occurred where the K fertilising material was applied to the grass-clover itself. However, this result may be an artefact of the experiment design in the greenhouse and should be confirmed in the field.
• Available K measured by ammonium nitrate gives a good indication of the plant available K in soil, with crops showing a response to increasing available K and continued cropping causing a decline in the pool of available K in soil
• However, there is some indication that on some soils not all of the K extracted by ammonium nitrate is truly ‘available’ – this finding should be further investigated.
• The K index system can still be used as reasonable guide for organic systems, indicating soils where response to K may occur, if yields and K offtakes are expected to be significant (ie at high fertility points of the rotation)
4.4 Development of farm assessment and recommendation system for P and K management
In relation to the development of recommendation systems for P and K perhaps the most important finding from the project has been that response to P and K on low index soils is strongly governed by crop
establishment and growth and is stongly linked to N and C dynamics in soil. This makes it difficult to recommend for P or K in isolation without some better understanding of the situation in relation to other nutrients. In compiling the recommendation systems it has thus been necessary to rely on extraction of suitable relationships and parameters from published information. There is also an important interaction between spatial and temporal effects in relation to management. For example, crops which remove large quantities of K such as potatoes and cereals (if straw removed) are not always followed by crops which will
0 1000 2000 3000 4000 5000 6000 7000
SAC RAC Elm
-Control
Elm -FYM
Elm - Kali Elm -MsL-K
K (mg kg
-1 )
Total' K Nitric acid Available K
receive K inputs. As the rotation returns to the ley phase and nutrients are applied there will then be a time lag while nutrients are released into available forms. Data collected in this project was not long-term enough to allow a full evaluation of these factors.
In taking these factors into account, members of the OF0114 project team collaborated with an SAC based team working on the development of a whole farm nutrient budget model for nitrogen management. Using an Access based program, detailed management information at the individual field level is entered using a series of pull down menus. Information entered includes seed rates, cutting and grazing regimes (including grazing days), crop yields and nutrient offtakes, manure and supplementary nutrient applications. A nutrient budget is then calculated at the farm level using a combination of standard and specific (where available) analytical information. Examples of the data entry sheets are shown in Appendix 3. The nitrogen team is working
towards a 31 March 2001 deadline for a working model, which will now include N, P and K and it is anticipated that this deadline will be met.
A draft of an article prepared for the EFRC Bulletin is included as Appendix 4.
5.0 Possible future work
• Development of procedures by which new materials can be assessed for organic systems, including standard methods for assessing effectivity and life cycle type assessment as a criteria for use in organic systems.
• Further assessment of the benefits of mixing non-soluble fertilisers with organic residues, particularly composting approaches, including measurement of release characteristics and crop nutrition benefits and machinery, labour and full economic evaluation.
• Development of more extensive database for P and K contents of organic crop produce, especially horticultural
• Improved understanding of the interactions between organic and mineral cycles of P in soil. This will also have signifcant implications for conventional systems seeking to minimise P losses.
• Improved understanding of P and K use at rhizosphere scale, may well be important in improved nutrition of intercrops. This is particularly important for developing horticultural systems which are not reliant on large inputs of manure/supplementary nutrients.
• Improved understanding of role of AM fungi in crop rotations and their interaction with management (selection of crops/varieties, order of sequence, cultivations, manuring policies). This probably requires a combination of ecological, agronomic and molecular techniques.
• Improved understanding of the release of K in different soils and whether this can be manipulated in any way by management – expansion of work done by Goulding and Loveland (1986) to assess the long-term availability of K in relation to soil type.
• Further work to determine whether the ‘unavailable ‘ avaialble K story is replicated and what factors contol it. This has major implication for K use, if it holds.
• Knowledge transfer – transfer of process-based understanding of P and K cycles in soil and interactions of all nutrients in fertility management
• Knowledge transfer - advice on rotational/whole farm planning to avoid spatial deficiencies/excesses of P and K developing
• Knowledge transfer - improved interpretation of soil analysis (may also need some more research)
6.0 Actions resulting from the research
6.1 Impact on evaluation of ‘Organic Standards’
While not directly an objective of this project, during the project lifetime the project team sought to ensure that organic standards and practices continued to evolve to accommodate the best scientific knowledge available.
The P & K project has therefore:
• contributed to the debate on suitable methodologies for soil analysis on organic farms.
• discussed with the organic sector bodies the use of whole farm nutrient budgeting and its potential in conversion planning, certification and inspection.