J. Blanc-Talon et al. (Eds.): ACIVS 2005, LNCS 3708, pp. 138–145, 2005. © Springer-Verlag Berlin Heidelberg 2005
Using Support Vector Machine
Jang-Hee Yoo1, Doosung Hwang2, and Mark S. Nixon3
1
ETRI-Information Security Research Division, 161 Gajeong-Dong, Yuseong-Gu, Daejeon 305-700, South Korea
2
Department of Computer Science, Dankook University, San#29, Anseo-Dong, Cheonan, Chungnam 330-714, South Korea
3
School of Electronics and Computer Science, University of Southampton, Southampton SO17 1BJ, UK
Abstract. We describe an automated system that classifies gender by utilising a set of human gait data. The gender classification system consists of three stages:
i) detection and extraction of the moving human body and its contour from im-age sequences; ii) extraction of human gait signature by the joint angles and body points; and iii) motion analysis and feature extraction for classifying gen-der in the gait patterns. A sequential set of 2D stick figures is used to represent the gait signature that is primitive data for the feature generation based on mo-tion parameters. Then, an SVM classifier is used to classify gender in the gait patterns. In experiments, higher gender classification performances, which are 96% for 100 subjects, have been achieved on a considerably larger database.
1 Introduction
The study of human gait has generated much interest in fields including biomechan-ics, clinical analysis, computer animation, robotbiomechan-ics, and biometrics. Human gait is known to be one of the most universal and complex of all human activities. It has been studied in medical science [5, 10], psychology [6], and biomechanics [15] for decades. In computer vision, automated person identification by gait has recently been investigated [11]. The potential of gait as a biometric has further been encouraged by the considerable amount of evidence available, especially in medical [10, 14] and psychological studies [6]. As a biometric, human gait may be defined as a means of identifying individuals by the way they walk. Using gait has many advantages over other biometrics such as fingerprints, most notably that it is non-invasive and can be used at a distance. Various approaches [2, 11] for the classification and recognition of human gait have been studied, but human gait identification is still a difficult task.
recognising the gender of walker from moving light displays (MLDs) involving 3 male subjects and 3 female subjects all about the same height. Their results showed that humans were able to correctly identify gender using full body joint markers at 63% correctness on average, which is just better than chance (50%). In a later study, Mather and Murdoch [9] showed that frontal or oblique views are much more effec-tive than a side view for gender discrimination, and emphasised that male subjects trend to swing their shoulders more while female subjects tend to swing their hips, the results improved to an accuracy of 79%.
In this paper, we propose an automated gender classification system in human gait using Support Vector Machine (SVM). The large amount of human gait data was collected from DV cameras, and the human body and its contour is extracted from the image sequences. A 2D stick figure is used to represent the human body structure, and it is extracted from body contour by determining the body points. To extract the body points, joint angles of each segment are extracted from gait skeleton data by linear regression analysis, and gait motion between key-frames is described by tracking the moving points of locomotion. The body segments and moving points are basically guided by topological analysis with anatomical knowledge. Also, the features based on motion parameters are calculated from sequence of the stick figures, and then an SVM classifier is employed to classify gender in the gait patterns.
2 Extracting Human Gait Motion
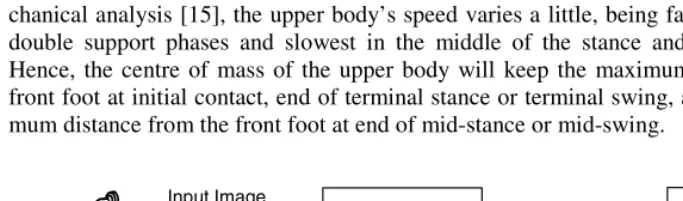
In computer vision, motion analysis of the human body usually involves segmenting, tracking and recovering the human body motion in an image sequence. Fig. 1 shows the system architecture used within this study. Here, a simplified 2D stick figure with six joint angles [16] is used to represent the human body structure for recovering and interpreting the human movement. Also, the horizontal centre of mass in the upper body is used as a gait symmetry point to detect the gait cycle. According to biome-chanical analysis [15], the upper body’s speed varies a little, being fastest during the double support phases and slowest in the middle of the stance and swing phases. Hence, the centre of mass of the upper body will keep the maximum distance from front foot at initial contact, end of terminal stance or terminal swing, and it has mini-mum distance from the front foot at end of mid-stance or mid-swing.
DV Camera
Input Image
Sequences Extracting Gait
Signature Body Contours
Pre-Processing Gait Images
Gait Motion Analysis Sequences of
Stick Figures
Feature Extraction and
Selection
Motion Parameters Classifying
Gender by Gait Patterns
[image:2.513.46.388.470.570.2]Gait Features
2.1 Human Gait Database
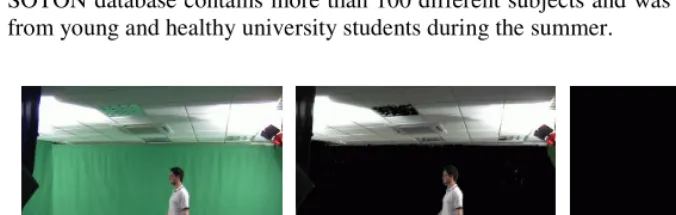
The SOTON database [12] developed by the ISIS Research Group is one of the recent databases within the DARPA Human ID at a Distance program. An image sequence in the database contains only a single subject walking at normal speed and was ac-quired at 25 fps with 720×576 colour pixels from good quality progressive scan DV cameras. All subjects in the database are filmed fronto-parallel (where the walking path is normal to the camera view) or at an oblique angle. Each subject has at least four image sequences and each image sequence contains at least one gait cycle, to-gether with background and other supporting data. The most recent version of the SOTON database contains more than 100 different subjects and was mostly acquired from young and healthy university students during the summer.
Fig. 2(a) shows sample image from the SOTON indoor database. As can be seen in the figure, a chroma-key laboratory was constructed to allow controlled lighting con-ditions. Due to the nature of both the capture and colour data in the database, the use of a colour specific extraction is possible. That is, human body extraction from the image sequences can be easily achieved through background subtraction as shown in Fig. 2(b). After that, the histogram projection profiles are analysed to estimate the position of a human body as shown in Fig. 2(c), and the body region is verified by prior knowledge such as size and shape. Thresholding and morphology are then used to extract the contour of a detected human body. Here, a thresholding method based on similarity measures between the background and the object image is used. Finally, the body contour is extracted by subtraction followed by dilation and erosion.
2.2 Extracting Gait Signature
The analysis of human motion often requires knowledge of the properties of body segments. To extract body points in a contour image, a skeleton data with body seg-ment properties is used. For a body height H, an initial estimate of the vertical posi-tion of the neck, shoulder, waist, pelvis, knee and ankle was set by study of anatomi-cal data to be 0.870H, 0.818H, 0.530H, 0.480H, 0.285H, and 0.039H, respectively [1]. The gait skeleton can be simply calculated by two border points of each body part p with a range constraint. The angles θp of body part p from skeleton data can be
[image:3.513.47.385.217.324.2]ap-(a) Sample Image (b) Background Subtraction (c) Object Detection
proximated by using the slope of the lines in linear regression equation. Also, each body point (position) can be calculated by
, cos( ) sin( )
p p i p p i p p
x y =⎣⎡x +L φ θ+ y +L φ θ− ⎤⎦ (1)
where φ is the phase shift, xi and yi are the coordinates of a previously established
position, and Lp is the length of body segments guided by anatomical knowledge [1].
Now we can extract a 2D stick figure with the nine body points from the skeleton data of each body segment. The body points are clearly extracted around three double supports [14], but the points around single support appear less well defined than those for the double support. Thus, a motion tracking method between double supports is used to extract body points at the lower limbs. To track knees and ankles, the left-most skeleton points around the knee region and the right-left-most skeleton points around the ankle region are considered. In addition, functional or physical constraints are used to improve the robustness of the method. For example, during the gait cycle, the other foot is in contact with the floor (and does not move forwards), and the crossover of the two legs is performed on two single supports during one gait cycle.
150 200 250 300 350 400 450 500 0 50 100 150 200 250 300 350
horizontal position in image plane
v e rt ic al pos it ion i n i m ag e pl ane
0 10 20 30 40 50 60 70 80 90 100 100 150 200 250 300 350 400 450 500
time (percent of gait cycle)
fo rw a rd di s p la c e m e nt hip knee ankle
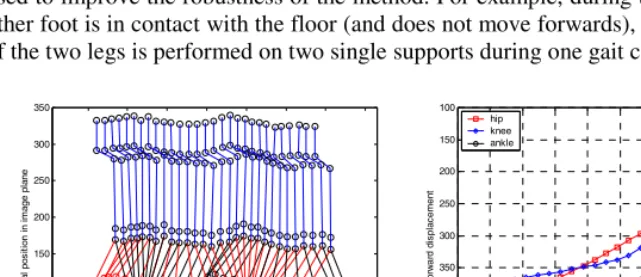
[image:4.513.58.379.263.401.2](a) Gait Signature (b) Forward Displacements
Fig. 3. Example of Extracted Gait Motion during One Gait Cycle
The extracted stick figures from an image sequence are shown in Fig. 3(a), and its forward displacement at hip, knee, and ankle shown in Fig. 3(b). The gait signature can be defined as a sequence of the stick figures obtained from gait silhouette data during one gait cycle. Here, the forward displacement of joints is consistent with medical data [5, 10, 14], and it is an important component for showing quality of the extracted gait signature. Also, the stick figure model is the most effective and well-defined representation method for kinematic gait analysis. Moreover, the stick figure is closely related to a joint representation, and the motion of the joints provides a key to motion estimation and recognition of the whole figure.
2.3 Feature Extraction and Selection
joint angles of the hip, knee and ankle have been considered as the most important kinematics of the lower limbs. By definition [15], the joint angles are measured as one joint relative to another, so the relative angles in each joint are computed from the extracted angle values. In normal walking, the trunk of a human body can be consid-ered to be almost vertical. Thus, the relative hip angle (θhip) is the same as that of the
extracted value (θH), and the knee angle can be calculated from the extracted hip
an-gle (θH) and knee angle (θK) as θknee=θH -θK.
Kinematic analysis of human gait usually characterises the joint angles between body segments and their relationship to the events of the gait cycle [14, 15]. In addi-tion, the trajectories of the gait signature contain many kinematic characteristics on human movement. The kinematic characteristics include linear and angular position, their displacements and the time derivatives, notably the linear and angular velocities and accelerations. Here, the kinematic parameters are obtained from the joint angles, which are interpolated by 4th-order trigonometric polynomials [16], during one gait cycle. In general, the kinematic parameters are time series data during the gait cycle, thus mean and standard deviation values of the time series can be used as gait fea-tures. Moreover, moments [4] are used to generate the features, which are invariant to translation and scaling of the hip and knee angles. The hip-knee cyclograms [4] repre-sent the movement of nearly the entire body, thus they can be reprerepre-sentative of the subject’s gait pattern.
The trajectories of gait signature also contain the general gait parameters such as stride length, cycle time (or cadence) and speed and provide a basic description of the gait motion [14]. These parameters present essential quantitative information about a human gait and give a guide to the walking ability of subject. In addition, each pa-rameter may be affected by such factors as age, sex, height, muscle strength, etc. The period of the gait is determined by number of frames during one gait cycle in image sequence, and the frame rate of the SOTON database was 1/25 seconds. The cycle time and the gait speed are given by
_ (sec) _ (frames) _ (frames / sec)
cycle time =gait period frame rate (2)
(m/sec) _ (m) _ (sec)
speed =stride length cycle time (3)
where the stride length can be directly estimated from the physical dimensions of the image plane. Namely, the stride length is determined by the coordinates of the for-ward displacements of the gait signature during one gait cycle.
3 Gender Classification by SVM
In gender classification, 100 different subjects (84 males and 16 females) with seven gait signatures of each subject, a total of 700 gait signatures (≈19,534 images), are used. A total of the 400, 100, and 200 feature vectors extracted from the gait signa-tures are used for training, cross validation and testing. Support vector machines (SVMs) and neural network are employed as classifiers for this gender classification task in a way of 10-fold cross validation (CV).
3.1 Support Vector Machines
Support vector machines can perform binary classification and regression estimation tasks. Given a set of two-class labelled data (xi, yi), i = 1, 2, .., n and yi= ±1, an SVM
learns a separating hyper-plane <w, x> + b = 0, where xi∈Rn, w∈Rn, and b∈R. In
the linear hyper-plane, the SVM looks for a discriminating plane that maximises the margin by minimising ||w||2/2, subject to yi(<w, xi> + b) ≥1 for all i. In the linear
non-separable case, the optimal separating hyper-plane can be computed by introduc-ing slack variables ξi= 1, 2, .., n and an adjustable parameter C and then minimising
(
)
2
i
w 2+C
∑
iξi, subject to yi 〈w, x〉+ ≥b 1- , and ξi ξi ≥0 for all .i (4) Lagrange multiplier αi is used for solving the non-separable case by introducing the dual optimisation. The separating hyper-plane of linear function is not adjustable in many practical cases and takes the kernel function K(•) such that K(xi, xj) =φ(xi)·φ (xj). This αi can be computed by solving the quadratic optimisation problem asi j
1 , 1
1
1
min ( )= (x , x )
2
.
s.t 0 and 0 , for all
n n
i i j i j
i i j
n
i i i
i
W y y K
y C i
α α α α
α α
= =
=
− +
= ≤ ≤
∑
∑
∑
(5)Support vectors are the training examples with αi > 0. Specifically unbounded support
xusv vectors [7] are with 0 < αi < C and bound support vectors with αi = C. The
pa-rameters of the separating hyper-plane are
1
w=
x and
w, x
.
n
i i i usv
i
usv
y
b
y
α
=
=
−
〈
〉
∑
(6)In the present study, the implementation of the SVM is based on the working set se-lection strategy of SVMlight and there kernels of linear (<xi, xj>), polynomial ((<xi,
xj> + 1)p) and radial basis function (exp(-||xi-xj||2 / p2)) are chosen. 3.2 Experimental Results
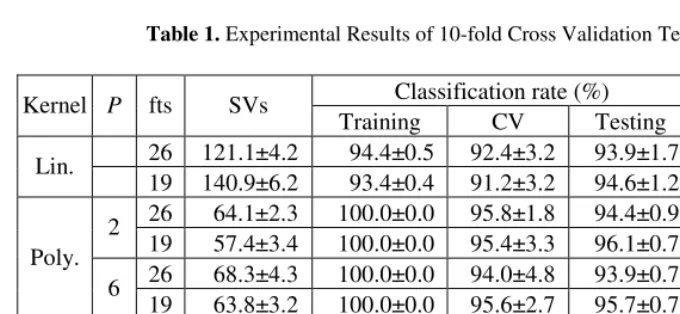
computa-tional cost of all experiments with change in the kernel parameter p. The computa-tional cost is measured by FLOP (floating point operation). The test result of 19 se-lected features is a little higher than that of 26 original features. The average accuracy of polynomial kernel (p = 6) was the best with around 100.0% for training, 95.0% for CV and 96.0% for testing in the 19 features. The error rate of the linear kernel was lower than that of other kernels in terms of classification rate and computational cost. The result shows that polynomial kernel is better than linear or RBF (Radial Basis Function) kernel [13] in this gender classification task.
Table 1. Experimental Results of 10-fold Cross Validation Test
Classification rate (%) Kernel P fts SVs
Training CV Testing FLOP
26 121.1±4.2 94.4±0.5 92.4±3.2 93.9±1.7 54.2±11.8 Lin.
19 140.9±6.2 93.4±0.4 91.2±3.2 94.6±1.2 67.2±15.2 26 64.1±2.3 100.0±0.0 95.8±1.8 94.4±0.9 1.6±0.5 2
19 57.4±3.4 100.0±0.0 95.4±3.3 96.1±0.7 1.9±1.3 26 68.3±4.3 100.0±0.0 94.0±4.8 93.9±0.7 0.9±0.4 Poly.
6
19 63.8±3.2 100.0±0.0 95.6±2.7 95.7±0.7 1.0±0.7 26 137.6±4.6 96.8±0.3 94.4±2.8 95.7±0.9 4.1±0.4 1.5
19 133.7±5.1 96.8±0.5 93.6±2.8 96.5±0.6 4.7±1.1 26 145.6±6.6 96.2±0.4 93.8±3.2 95.4±0.9 3.5±0.7 RBF
2.0
19 143.3±4.4 95.8±0.4 94.2±2.2 96.7±0.3 4.0±0.9
A 3-layer feed-forward neural network with resilient back-propagation learning al-gorithm was also tested for comparative study. The average accuracy with the 10-fold cross validation was 98.0% for training, 93.0% for CV and 92.0% for testing with the network topology of 19×28×2. The overall result is that SVM outperformed neural network in the given task. Naturally we seek to extend the technique in terms of bio-metric application capability as well as classifying gender for a large number of sub-jects in future. Notwithstanding this, the gender classification task can clearly handle a large number of subjects successfully. By this, these results show that people can be identified according to gender by their walking pattern. This accords with earlier psychological suggestions, and buttressing other similar results.
4 Conclusions
very good classification rates which were 96% for 100 subjects on average. As such, the automated gender classification system not only accords with psychological analysis in the results it can produce, but also confirms distinctiveness by gender - as earlier suggested in psychological studies. There is interest in gait analysis for medi-cal purposes as its convenience will also benefit analysis of children and elderly. Further, there is opportunity for greater realism in biometrics, though this will doubt-less require more sophisticated features and modelling strategies.
References
1. Dempster, W. T., and Gaughran, G. R. L.: Properties of Body Segments Based on Size and Weight. American Journal of Anatomy, 120 (1967) 33-54
2. Foster, J. P., Nixon, M. S., and Prügel-Bennett, A.: Automatic Gait Recognition using Area-based Metrics. Pattern Recognition Letters, 24(14) (2003) 2489-2497
3. Fukunaga K.: Introduction to Statistical Pattern Recognition. 2nd eds. Academic Press, San Diego (1990)
4. Goswami A.: A New Gait Parameterization Technique by Means of Cyclogram Moments: Application to Human Slop Walking. Gait and Posture, 8(1) (1998) 15-26
5. Inman, V. T., Ralston, H. J., and Todd, F.: Human Walking. Williams & Wilkins, Balti-more (1981)
6. Johansson, G.: Visual Perception of Biological Motion and a Model for Its Analysis. Per-ception and Psychophysics, 14(2) (1973) 201-211
7. Joachims, T.: Learning to Classify Text Using Support Vector Machines. Dissertation, Kluwer (2002)
8. Kozlowski, L. T., and Cutting, J. T.: Recognizing the Sex of a Walker from a Dynamic Point-Light Display. Perception and Psychology, 21(6) (1977) 575-580
9. Mather, G., and Murdoch, L.: Gender Discrimination in Biological Motion Displays based on Dynamic Cues. In Proceedings of the Royal Society of London, Vol.B (1994) 273-279 10. Murray, M. P., Drought, A. B., and Kory, R. C.: Walking Patterns of Normal Men. Journal
of Bone and Joint Surgery, 46A(2) (1964) 335-360
11. Nixon, M. S., Cater, J. N., Grant, M. G., Gordon, L., and Hayfron-Acquah, J. B.: Auto-matic Recognition by Gait: Progress and Prospects. Sensor Review, 23(4) (2003) 323-331 12. Shutler, J. D., et al: On a Large Sequence-based Human Gait Database. In Proceedings of
Recent Advances in Soft Computing, Nottingham, UK (2002) 66-71
13. Shin, M., and Park, C.: A Radial Basis Function Approach to Pattern Recognition and Its Applications. ETRI Journal, 22(2) (2000) 1-10
14. Whittle, M. W.: Gait Analysis: An Introduction. 3rd eds. Butterworth Heinemann (2002) 15. Winter, D. A.: The Biomechanics and Motor Control of Human Gait: Normal, Elderly and
Pathological. Waterloo Biomechanics, Ontario (1991)