S t a t i s t i c s i n f o c u s
Agriculture and fisheries
Authors: Carla MARTINS, Pol MARQUER
80/2008
Farm structure in Denmark - 2007
The agricultural area per holding increases by 14% since 2005
zzzzzzzzzzzzzzzzzzzzzzzzzzzzzzzzzzzzzzzzzzzzzzzzzzzzzzzzzzzzzzz
This Statistics in Focus is part of a series of country-specific publications on the results of the Farm Structure
Survey (FSS) 2007. It provides a brief but nevertheless comprehensive insight into the farm structure in
Denmark.
44 618 agricultural holdings were recorded in Denmark in the 2007 Farm Structure Survey (14% less than in
2005).This drop is due to the decrease in the number of all farms under 100 ha.
* * *
Due to the different coverage of the FSS across
Member States, the total number of surveyed farms
is not comparable between countries. This is why
the present analysis focuses on holdings of at least
one European Size Unit (ESU). See the
methodological notes for more information on the
concept of ESU.
In 2007, about
44 360
agricultural holdings
had
an economic size of at least 1 ESU, compared to
51 300 in 2005.
They made use of
2.66 million ha of utilised
agricultural area
, which represents on average
60
ha per holding, a 14% increase from the
2005 value of
52.7
ha/holding.
These holdings employed
55 700 AWUs
(annual work units), the equivalent of 55 700
people working full time;
They
had
4.58 million livestock units
(LSU) in
2007.
Amongst these
44 360
agricultural holdings:
-
53
% made use of less than one AWU, while
another
20
% made use of 2 or more AWUs;
-
4
% used less than 5 ha, while
34%
used 50 ha
or more;
- 38%
of the holdings specialised in cereals, oil
seed and protein crops;
- 17% were engaged in general field cropping;
- 10% of the holdings specialised in dairy
farming.
Amongst the sole holders:
- 12% were women in 2007;
- 45% were aged 55 or more, and 6% were
younger than 35 years;
- 48% of sole/main holders had another gainful
activity in 2007.
In Denmark in 2007, 71%
of the agricultural area
was owned by farmers;
133 115 ha (5% of the utilised agricultural area),
were organically farmed (compared to 5.2% in
2005);
The share of farms with another gainful activity
than agricultural production rose from 18% in 2005
to 23% in 2007.
The labour force has decreased by 8% from 2005
to 2007. Considering the regular labour force, the
reduction was 12.5% during the same period.
Distribution of the utilised agricultural area
0 200 400 600 800 1000 1200 1400 1600
<5 5-<10 10-<20 20-<30 30-<50 50-<200 >=200
Agricultural area size class (ha) 1000 ha
2005 2007
Description of the labour force in Denmark
Non Family labour force 21640 AWUs
Agricultural labour force
Family labour force 63270 persons of which 30% women 34100 AWUs
Working full time 17360 persons
Working part time 25770 persons
Not working on farm 290 persons
Working full time 1200 persons
Working part time 3210 persons
Working full time 17490 persons
Working part time 3960 persons Working full time
2770 persons
Working part time 12670 persons
Other family members 4410 persons of which 18% women 2100 AWUs
… regular
21450 persons of which 25% women 19470 AWUs
Holders
43410 persons of which 12% women 25790 AWUs
Spouses of the sole holders 15450 persons of which 84% women 6220 AWUs
… non regular 2170 AWUs
Distribution of the number of livestock units
0 500 1000 1500 2000 2500 3000
<5 5-<50 50-<100 100-<500 >=500
Size class (LSUs) 1000 LSUs
2005 2007
Denmark – 2007
Table 1 – Labour force by size of the farms
Agricultural area (ha) All Livestock (LSU*) <20 20-<50 50-<100 >=100 farms 0 >0-<50 50-<100 >=100
14.0 8.7 9.7 23.3 55.7 16.3 12.1 3.0 24.4
24.9 14.3 10.6 13.5 63.3 20.9 23.2 3.4 15.8
1000 annual work units 8.9 7.2 7.5 10.6 34.1 9.1 10.0 2.5 12.5
5.2 1.6 2.3 12.4 21.4 6.7 2.2 0.6 12.0
4.6 1.2 1.9 11.7 19.5 6.0 1.8 0.4 11.3
0.5 0.3 0.4 1.0 2.2 1.1 0.3 0.1 0.7
1000 18.6 10.5 7.1 8.2 44.4 16.4 16.2 2.3 9.4
(%) 16.2 9.3 6.9 7.8 11.5 11.2 15.0 7.5 7.0
- part-time: - under 50 % (%) 72.0 49.1 16.7 4.9 45.4 61.0 58.4 13.1 3.7
- part-time: - 50 % and over (%) 12.2 20.9 16.9 5.4 13.8 12.9 19.3 15.5 5.3
1000 18.3 10.3 7.0 7.9 43.4 16.0 16.0 2.3 9.2
(%) 16.4 9.5 7.1 8.2 11.8 11.5 15.3 7.7 7.2
(%)
- under 35 years 4.7 4.3 7.0 10.2 6.0 5.0 4.3 5.4 10.9
- from 35 to 44 years 20.4 18.3 22.3 27.5 21.5 18.6 20.4 18.6 29.2
- from 45 to 54 years 27.1 28.0 29.8 27.9 27.9 25.8 29.0 31.2 29.0
- from 55 to 64 years 24.3 25.8 25.8 21.1 24.3 24.9 25.0 31.5 20.2
- 65 years and over 23.4 23.6 15.1 13.3 20.3 25.7 21.3 13.3 10.7
- part-time: - under 50 % (%) 73.5 49.7 17.0 5.1 46.4 62.7 59.2 13.3 3.8
- part-time: - 50 % and over (%) 12.5 21.2 17.2 5.6 14.1 13.2 19.6 15.7 5.5
(%) 64.2 54.7 31.0 17.1 48.1 54.9 63.1 28.8 14.9
- as a main occupation 59.6 45.6 18.4 4.9 39.8 48.4 55.3 15.4 4.2
- as a subsidiary occupation 4.5 9.1 12.6 12.2 8.3 6.6 7.9 13.4 10.7
1000 5.8 3.2 2.7 3.8 15.4 3.9 6.2 0.8 4.6
(%) 76.2 84.6 89.4 90.1 83.6 82.9 77.9 88.0 91.1
(%)
- under 35 years 7.8 7.4 11.2 16.0 10.3 7.9 7.8 7.9 16.1
- from 35 to 54 years 57.6 53.9 57.5 57.8 56.9 48.9 58.9 56.6 60.9
– 55 years and over 34.6 38.7 31.4 26.2 32.9 43.2 33.3 35.5 23.0
- part-time: - under 50 % (%) 79.5 76.2 58.8 50.5 68.2 75.0 79.2 57.1 49.5
- part-time: - 50 % and over (%) 10.4 12.1 18.2 17.6 13.9 10.7 11.3 21.1 18.7
(%) 67.9 63.8 54.6 48.7 60.1 58.3 70.4 52.3 49.0
1000 0.8 0.8 0.9 1.9 4.4 1.0 1.0 0.3 2.1
(%) 28.0 19.5 18.0 13.6 18.3 16.7 26.9 17.8 15.0
- part-time: - under 50 % (%) 75.4 76.9 68.1 44.1 60.9 70.1 77.0 63.5 48.5
- part-time: - 50 % and over (%) 9.8 8.0 11.7 14.6 11.9 8.4 10.9 15.8 13.6
(%) 64.4 64.6 54.8 41.7 52.8 58.8 67.2 49.8 43.5
Size of the farms
- with another gainful activity1
- women
–distribution by age - women
–distribution by age
Sole/main holders
1000 persons
Non regular non family labour force Total labour force
- with another gainful activity - with another gainful activity
Other members of the holder’s family working on the holding Holding managers
- women
1000 annual work units
1000 annual work units
Spouse of sole holder
1000 persons
1000 annual work units
- women
Family labour force
Non-family labour regularly employed
*LSU = Livestock Unit
Denmark – 2007
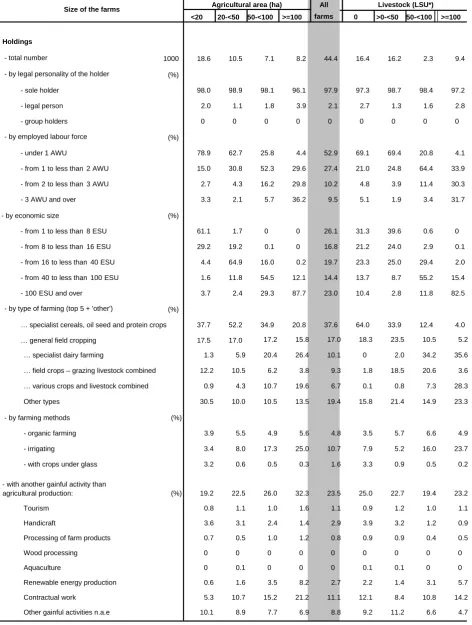
Table 2 – Agricultural holdings by size
"0" less than half of the unit or nil
*LSU = Livestock unit
All
<20 20-<50 50-<100 >=100 farms 0 >0-<50 50-<100 >=100
1000 18.6 10.5 7.1 8.2 44.4 16.4 16.2 2.3 9.4
(%)
- sole holder 98.0 98.9 98.1 96.1 97.9 97.3 98.7 98.4 97.2
- legal person 2.0 1.1 1.8 3.9 2.1 2.7 1.3 1.6 2.8
- group holders 0 0 0 0 0 0 0 0 0
(%)
- under 1 AWU 78.9 62.7 25.8 4.4 52.9 69.1 69.4 20.8 4.1
- from 1 to less than 2 AWU 15.0 30.8 52.3 29.6 27.4 21.0 24.8 64.4 33.9
- from 2 to less than 3 AWU 2.7 4.3 16.2 29.8 10.2 4.8 3.9 11.4 30.3
- 3 AWU and over 3.3 2.1 5.7 36.2 9.5 5.1 1.9 3.4 31.7
- by economic size (%)
- from 1 to less than 8 ESU 61.1 1.7 0 0 26.1 31.3 39.6 0.6 0
- from 8 to less than 16 ESU 29.2 19.2 0.1 0 16.8 21.2 24.0 2.9 0.1
- from 16 to less than 40 ESU 4.4 64.9 16.0 0.2 19.7 23.3 25.0 29.4 2.0
- from 40 to less than 100 ESU 1.6 11.8 54.5 12.1 14.4 13.7 8.7 55.2 15.4
- 100 ESU and over 3.7 2.4 29.3 87.7 23.0 10.4 2.8 11.8 82.5
(%)
… specialist cereals, oil seed and protein crops 37.7 52.2 34.9 20.8 37.6 64.0 33.9 12.4 4.0
… general field cropping
17.5 17.0 17.2 15.8 17.0 18.3 23.5 10.5 5.2
… specialist dairy farming 1.3 5.9 20.4 26.4 10.1 0 2.0 34.2 35.6
… field crops – grazing livestock combined 12.2 10.5 6.2 3.8 9.3 1.8 18.5 20.6 3.6
… various crops and livestock combined
0.9 4.3 10.7 19.6 6.7 0.1 0.8 7.3 28.3
Other types 30.5 10.0 10.5 13.5 19.4 15.8 21.4 14.9 23.3
(%)
- organic farming 3.9 5.5 4.9 5.6 4.8 3.5 5.7 6.6 4.9
- irrigating 3.4 8.0 17.3 25.0 10.7 7.9 5.2 16.0 23.7
- with crops under glass 3.2 0.6 0.5 0.3 1.6 3.3 0.9 0.5 0.2
(%) 19.2 22.5 26.0 32.3 23.5 25.0 22.7 19.4 23.2
Tourism 0.8 1.1 1.0 1.6 1.1 0.9 1.2 1.0 1.1
Handicraft 3.6 3.1 2.4 1.4 2.9 3.9 3.2 1.2 0.9
Processing of farm products 0.7 0.5 1.0 1.2 0.8 0.9 0.9 0.4 0.5
Wood processing 0 0 0 0 0 0 0 0 0
Aquaculture 0 0.1 0 0 0 0.1 0.1 0 0
Renewable energy production 0.6 1.6 3.5 8.2 2.7 2.2 1.4 3.1 5.7
Contractual work 5.3 10.7 15.2 21.2 11.1 12.1 8.4 10.8 14.2
Other gainful activities n.a.e 10.1 8.9 7.7 6.9 8.8 9.2 11.2 6.6 4.7
Size of the farms Agricultural area (ha) Livestock (LSU*)
- with another gainful activity than agricultural production:
Holdings
- total number
- by legal personality of the holder
- by employed labour force
- by type of farming (top 5 + 'other')
[image:4.595.65.538.86.712.2]Denmark – 2007
Table 3 – Land use by size of the farms
"0" less than half of the unit or nil
All
<20 20-<50 50-<100 >=100 farms 0 >0-<50 50-<100 >=100
(1000 ha)
241.6 374.8 543.2 1814.4 2974.0 865.6 559.2 167.0 1382.2
55.6 38.0 33.7 186.4 313.7 112.9 95.4 29.1 76.3
33.8 20.5 15.2 138.5 208.0 78.8 63.4 23.1 42.6
186.0 336.8 509.5 1628.0 2660.3 752.7 463.8 137.9 1305.9
139.7 299.7 470.1 1540.4 2450.0 702.5 391.9 119.3 1236.3
85.7 195.5 271.9 892.1 1445.2 464.1 239.4 61.4 680.3
Common wheat and spelt 28.2 76.1 122.5 464.9 691.7 229.0 97.3 21.9 343.4
Durum wheat 0 0 0 0 0 0 0 0 0
Rye 2.5 4.0 5.1 18.5 30.0 12.5 5.9 1.1 10.6
Barley 48.6 101.1 127.1 349.5 626.2 197.8 117.3 33.1 278.0
Oats 3.6 8.9 10.1 32.9 55.6 14.2 12.0 3.0 26.5
Grain maize 0 0 0 0 0 0 0 0 0
0.3 1.0 0.8 3.6 5.6 2.6 1.1 0.2 1.7
1.5 5.9 13.9 63.0 84.3 42.9 12.0 3.6 25.8
Potatoes 0.6 1.9 5.5 33.2 41.2 21.8 5.7 1.8 11.9
Sugar beet 0.7 3.1 7.2 28.4 39.3 21.0 5.7 0.9 11.8
Fodder root 0.3 0.8 1.3 1.4 3.8 0.1 0.6 1.0 2.1
5.5 18.6 31.2 124.8 180.1 58.5 25.0 5.1 91.4
Tobacco 0 0 0 0 0 0 0 0 0
Hops 0 0 0 0 0 0 0 0 0
Cotton 0 0 0 0 0 0 0 0 0
Rape and turnip 5.5 18.6 31.1 124.7 179.8 58.4 25.0 5.1 91.4
Sunflower 0 0 0 0 0 0 0 0 0
Soya 0 0 0 0 0 0 0 0 0
0.9 1.1 2.0 7.0 11.1 7.7 1.9 0.2 1.2
outside 0.8 1.1 2.0 7.0 11.0 7.6 1.9 0.2 1.2
under glass 0.1 0 0 0 0.1 0.1 0 0 0
0.4 0.1 0 0 0.5 0.4 0 0 0
outside 0.1 0 0 0 0.2 0.1 0 0 0
under glass 0.3 0 0 0 0.3 0.3 0 0 0
37.5 49.4 104.0 280.5 471.4 33.2 70.2 38.8 329.2
6.1 22.1 32.1 97.0 157.4 52.7 24.8 7.1 72.7
0 0 0 0 0 0 0 0 0
43.9 34.6 37.0 85.3 200.8 43.2 70.1 18.5 68.9
2.3 2.5 2.4 2.3 9.5 7.0 1.8 0.1 0.7
Fruit and berry plantation 1.7 1.8 1.7 1.7 6.8 5.0 1.2 0 0.6
Citrus plantation 0 0 0 0 0 0 0 0 0
Olive trees 0 0 0 0 0 0 0 0 0
Vineyard 0 0 0 0 0 0 0 0 0
(ha) 10.0 32.2 71.9 199.1 60.0 45.9 28.6 59.5 138.7
(%)
89.8 83.7 77.0 63.8 70.7 70.3 78.9 75.1 67.5
0 0 0 0 0 0 0 0 0
4.2 5.2 4.7 5.1 5.0 3.0 6.5 8.6 5.3
2.2 4.7 9.3 11.5 9.6 6.8 5.0 10.4 12.6
- D. Arable land
Livestock (LSU*) Agricultural area (ha)
Total area of agricultural holdings
· H. Other area
Wooded area
· Agricultural area
Size of the farms
Cereals
Dried pulses
Root crops
Industrial crops
Ratios
Flower and ornamental plants
Forage plants
Fallow land
- F. Permanent pasture and meadows
... organic farmed
... irrigated
Area
Agricultural area per holding
Agricultural area...
... own farmed
... in less favoured or mountain area
- E. Kitchen garden
Fresh vegetables, melons, strawberry
- G. Permanent crops
Denmark – 2007
Table 4 – Livestock by size of the farms
":" not available
"0" less than half of the unit or nil
Agricultural area (ha) All Livestock (LSU*)
<20 20-<50 50-<100 >=100 farms 0 >0-<50 50-<100 >=100
(1000 LSU) 506.5 291.1 775.8 3008.4 4581.8 0 202.7 167.0 4212.1
of which grazing (%) 21.4 46.2 35.5 22.2 25.9 : 90.5 78.7 20.7
(1000 heads)
30.8 11.3 4.9 5.2 52.2 0 42.6 4.1 5.6
118.3 185.7 377.2 885.0 1566.2 0 218.9 189.8 1157.5
Under 1 year 43.9 73.9 127.9 275.1 520.8 0 84.6 77.9 358.3
From 1 to less than 2 years 24.0 35.7 75.4 164.1 299.2 0 45.0 38.4 215.8
Dairy cows 9.7 28.3 129.3 378.1 545.4 0 9.3 40.9 495.2
Other cows 30.5 33.7 21.3 20.5 106.0 0 61.4 19.9 24.6
Other bovine animals 2 years and older 10.3 14.2 23.3 47.2 94.8 0 18.5 12.7 63.6
58.2 35.5 19.3 43.3 156.3 0 89.2 23.0 44.0
6.9 1.7 2.6 3.3 14.4 0 7.3 3.7 3.4
(1000 heads) 1626.1 556.9 1952.0 9588.5 13723.5 0 68.7 122.8 13532.0
Piglets < 20 kg 590.1 130.1 564.4 2985.5 4270.1 0 15.1 15.4 4239.5
Breeding sows 203.6 41.6 187.3 976.3 1408.8 0 4.7 4.8 1399.2
Other pigs 832.4 385.2 1200.3 5626.7 8044.6 0 48.8 102.5 7893.3
(million heads) 2.6 1.2 3.2 9.7 16.7 0 0.1 0.1 16.5
Broilers 1.5 0.3 2.2 7.6 11.8 0 0 0 11.7
Laying hens 0.8 0.8 0.8 1.8 4.2 0 0.1 0.1 4.0
Other poultry 0.3 0.1 0.1 0.2 0.8 0 0 0 0.7
(1000 heads) 0 0 0 0 0 0 0 0 0
(1000) 0 0 0 0 0 0 0 0 0
(head/holding)
Equidae (head/holding) 6.7 7.1 5.2 5.0 6.4 : 6.4 12.4 4.7
Cattle (head/holding) 23.4 47.6 117.9 257.3 100.3 : 24.2 100.4 248.6
Dairy cows (head/holding) 29.8 33.9 75.7 150.2 101.3 : 13.3 41.5 133.9
Other cows (head/holding) 7.3 12.8 16.3 19.0 11.5 : 8.5 25.1 20.5
Sheep (head/holding) 37.6 61.6 59.5 137.0 56.6 : 39.9 144.6 120.0
Goats (head/holding) 18.0 11.9 28.2 33.0 20.1 : 14.0 90.2 22.0
Pigs (head/holding) 1467.6 443.4 1177.3 3003.9 1902.6 : 56.7 213.5 2493.5
Breeding sows (head/holding) 339.9 76.5 265.6 557.9 391.5 : 7.6 29.4 497.1
Other pigs > 20 kg (head/holding) 791.2 318.3 729.7 1767.7 1134.8 : 44.2 180.2 1457.4
Rabbits, breeding females (head/holding) : : : : : : : : :
Laying hens (1000/holding) 0.5 1.2 2.4 7.1 1.5 : 0 0.6 9.5
Broilers (1000/holding) 16.6 7.1 42.8 83.1 41.1 : 0 0.3 74.4
Beehives (hive/holding) : : : : : : : : :
Total livestock
Grazing livestock
Equidae
Size of the farms
Bovine animals
Sheep
Goats
Pigs Granivores
Poultry
Rabbits, breeding females
Beehives
Average size of herds*
Denmark
–
2007 Table
5
–
Subsistence
farming
":" not available
*LSU = Livestock Unit
¾
METHODOLOGICAL NOTES
The survey on the structure of agricultural holdings in Denmark was
carried out in June 2007 on a sample basis. Prior to this survey, a
full-scale agricultural census was last conducted in 1999.The reference day
of the farm structure survey was the 15 June 2007 in the case of land
area, land use and livestock. For the labour force characteristics the
reference period was the 12 months preceding the reference day of the
survey.
According to the national definition, an agricultural holding is an economic
and technical unit which produces agricultural products and which can be
run by one person, by a group of persons or by a company. Units having
the agriculture as the secondary activity are also included.
On the basis of the Statistical Farm Register (that has been updated by
the subsequent sample surveys from 2001-2006), a stratified sample was
drawn. The holdings – including the newly established ones – have been
stratified into 8 groups by economic size of the farms [using standard
gross margin (SGM) at 1995 prices], by regions (9 regions) and by type of
farming (11 categories significant in Denmark). In practice 700 strata were
used (from the 792 possible). In each stratum farms are selected
randomly. The extrapolation factor is calculated simply as the number of
farms in the population divided by the number of farms in the sample
within each stratum. Some specific horticultural farms were covered
exhaustively (type of farming 21, 32 and 61). The selection ratio is also
100% for all the new and for big farms (with over 100 ha of agriculture
area). In 2007 the sample consisted of 24 865 units which, when
extrapolated, provided 44 618 farms.
The list of characteristics and their definitions were fully compliant with the
EU requirements concerning the Farm Structure Survey 2007. However,
when calculating the stratum by the type of farming, one group is
calculated differently from the common European standard. In Denmark
the farm type 61 includes all farms where more than 1/2 of the standard
gross margin (SGM) comes from the sum of horticulture and permanent
crops (except those farms which are classified under 21 and 32), instead
of considering type 61 all the farms with at least 1/3 of the SGM from
horticulture and another 1/3 from permanent crops.
In Denmark the FSS makes use of data from other registers in order to
reduce the burden on the farmers and also to diminish the expenses of
the survey. 44 characteristics of the FSS are drawn from the Integrated
Administration and Control System (IACS) register, the registrations of
bovine animals and the Organic Farm Register.
The data are controlled at different levels. They are checked manually for
major differences among farms included in previously surveys. The first
check covers 15 to 20% of the questionnaires, and the doubts are
removed by telephone contacts with the farmers. In a second step
unrealistic and missing data are checked automatically. A final control is
done on the aggregated results, compared with the previous ones by
checking the discrepancies.
Non-response is not a significant problem in the Danish FSS concerning
only 0.5%of the farms. For strata's with non-response the extrapolation
factor is corrected proportionately to the non-response. The information
from previous surveys and experts’ opinions were also used.
Between FSS 2005 and 2007 "maintaining land in good agricultural and
environmental conditions" (GAEC) became an agricultural activity and the
concerned land has been included in the agricultural area. In Denmark it
covers 2 100 ha, all the area being in farms with at least 1 ESU.
For each activity (`enterprise`) on a farm (for instance wheat, dairy cow or
vineyard), a SGM is estimated, based on the area (or the number of
heads) and a regional coefficient. The sum of such margins in a farm is its
economic size, expressed in European Size Units (ESU, 1 ESU is a
1200-euro standard gross margin).
Annual work unit (AWU) is equivalent to a worker employed on a full
time basis for one year. In Denmark it is 1800 hours (225 working days of
8 working hours per day).
Livestock Unit (LSU) is equivalent to a dairy cow. The number of
animals (number of heads) is converted into LSU using a set of
coefficients reflecting the feed requirements of the different animal
categories.
¾
REFERENCE PUBLICATIONS
Farm Structure Survey, 2007. National Methodological Report, Denmark
(available at request).
Website of the Statistics Denmark:
http://www.dst.dk/
Table bank for data:
www.statbank.dk
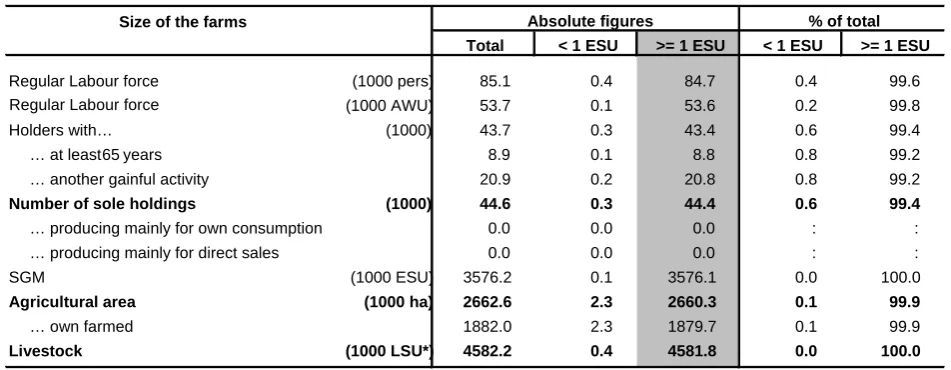
Size of the farms
(1000 pers) 85.1 0.4 84.7 0.4 99.6
(1000 AWU) 53.7 0.1 53.6 0.2 99.8
(1000) 43.7 0.3 43.4 0.6 99.4
… at least 65 years 8.9 0.1 8.8 0.8 99.2
… another gainful activity 20.9 0.2 20.8 0.8 99.2
(1000) 44.6 0.3 44.4 0.6 99.4
… producing mainly for own consumption 0.0 0.0 0.0 : :
… producing mainly for direct sales 0.0 0.0 0.0 : :
(1000 ESU) 3576.2 0.1 3576.1 0.0 100.0
(1000 ha) 2662.6 2.3 2660.3 0.1 99.9
… own farmed 1882.0 2.3 1879.7 0.1 99.9
(1000 LSU*) 4582.2 0.4 4581.8 0.0 100.0 < 1 ESU >= 1 ESU
% of total
Agricultural area
Absolute figures
Regular Labour force
Total < 1 ESU >= 1 ESU
Livestock
Holders with…
Number of sole holdings
SGM
[image:7.595.60.536.96.281.2]Further information
Data:
Eurostat Website
:
http://ec.europa.eu/eurostat
Select your theme on the left side of the homepage and then ‘Data’ from the menu.
Data:
EUROSTAT Website/Agriculture, forestry and fisheries
Agriculture, forestry and fisheries
Agriculture
Structure of agricultural holdings
Overview of agricultural holdings
Key farm variables
Journalists can contact the media support service:
Bech Building Office A4/125 L - 2920 Luxembourg
Tel. (352) 4301 33408 Fax (352) 4301 35349
E-mail:
[email protected]
European Statistical Data Support:
Eurostat set up with the members of the ‘European statistical system’ a network of
support centres, which will exist in nearly all Member States as well as in some EFTA
countries.
Their mission is to provide help and guidance to Internet users of European statistical
data.
Contact details for this support network can be found on our Internet site:
http://ec.europa.eu/eurostat/
A list of worldwide sales outlets is available at the:
Office for Official Publications of the European Communities.
2, rue Mercier
L - 2985 Luxembourg
URL:
http://publications.europa.eu
E-mail:
[email protected]
This publication has been written in collaboration with Maria BERGUA.
Manuscript completed on: 08.09.2008 Data extracted on: 05.05.2008 ISSN 1977-0316