Open Access
Research
Microsatellite polymorphism within
pfcrt
provides evidence of
continuing evolution of chloroquine-resistant alleles in Papua New
Guinea
Jeana T DaRe
1, Rajeev K Mehlotra
1, Pascal Michon
2, Ivo Mueller
2,
John Reeder
3, Yagya D Sharma
4, Mark Stoneking
5and Peter A Zimmerman*
1Address: 1Case Western Reserve University, Wolstein Research Building #4125, 2103 Cornell Road, Cleveland, OH 44106, USA, 2Papua New Guinea Institute of Medical Research, P.O. Box 60, Goroka, Papua New Guinea, 3Burnet Institute for Medical Research and Public Health, P.O. Box 2284, Melbourne, VIC 2001, Australia, 4Department of Biotechnology, All India Institute of Medical Sciences, Ansari Nagar, New Delhi-110029, India and 5Max Planck Institute for Evolutionary Anthropology, Deutscher Platz 6, D-04103, Leipzig, Germany
Email: Jeana T DaRe - [email protected]; Rajeev K Mehlotra - [email protected]; Pascal Michon - [email protected];
Ivo Mueller - [email protected]; John Reeder - [email protected]; Yagya D Sharma - [email protected]; Mark Stoneking - [email protected]; Peter A Zimmerman* - [email protected]
* Corresponding author
Abstract
Background: Polymorphism in the pfcrt gene underlies Plasmodium falciparum chloroquine resistance (CQR), as sensitive strains consistently carry lysine (K), while CQR strains carry threonine (T) at the codon 76. Previous studies have shown that microsatellite (MS) haplotype variation can be used to study the evolution of CQR polymorphism and to characterize intra- and inter-population dispersal of CQR in Papua New Guinea (PNG). Methods: Here, following identification of new polymorphic MS in introns 2 and 3 within the pfcrt gene (msint2 and msint3, respectively), locus-by-locus and haplotype heterozygosity (H) analyses were performed to determine the distribution of this intronic polymorphism among pfcrt chloroquine-sensitive and CQR alleles.
Results: For MS flanking the pfcrt CQR allele, H ranged from 0.07 (B5M77, -18 kb) to 0.094 (9B12, +2 kb) suggesting that CQ selection pressure was responsible for strong homogenisation of this gene locus. In a survey of 206 pfcrt-SVMNT allele-containing field samples from malaria-endemic regions of PNG, H for msint2 was 0.201. This observation suggests that pfcrt msint2 exhibits a higher level of diversity than what is expected from the analyses of pfcrt flanking MS. Further analyses showed that one of the three haplotypes present in the early 1980's samples has become the predominant haplotype (frequency = 0.901) in CQR parasite populations collected after 1995 from three PNG sites, when CQR had spread throughout malaria-endemic regions of PNG. Apparent localized diversification of pfcrt haplotypes at each site was also observed among samples collected after 1995, where minor CQR-associated haplotypes were found to be unique to each site.
Conclusion: In this study, a higher level of diversity at MS loci within the pfcrt gene was observed when compared with the level of diversity at pfcrt flanking MS. While pfcrt (K76T) and its immediate flanking region indicate homogenisation in PNG CQR parasite populations, pfcrt intronic MS variation provides evidence that the locus is still evolving. Further studies are needed to determine whether these intronic MS introduce the underlying genetic mechanisms that may generate pfcrt allelic diversity.
Published: 21 March 2007
Malaria Journal 2007, 6:34 doi:10.1186/1475-2875-6-34
Received: 12 December 2006 Accepted: 21 March 2007
This article is available from: http://www.malariajournal.com/content/6/1/34
© 2007 DaRe et al; licensee BioMed Central Ltd.
Background
Plasmodium falciparum chloroquine resistance (CQR) was first reported in Southeast Asia and South America during the late 1950's [1]. Since then, CQR parasites have spread worldwide, with corresponding increases in malaria mor-bidity and mortality [2]. CQR in Papua New Guinea (PNG) was first reported in 1976 [3,4]. By the early 1980's, in vivo studies indicated that CQR P. falciparum
was present in ~50% of the children, while in vitro assays revealed that ~80% of the isolates were CQR [5,6]. Recent molecular studies have shown that CQR-associated alleles had spread throughout PNG by the mid 1980's [7,8], and based on widespread chloroquine (CQ) treatment failure by the late 1990's [7,9,10], the PNG Ministry of Health changed its guidelines for malaria treatment in 2000 from CQ alone to CQ + sulphadoxine-pyrimethamine.
Genetic polymorphism associated with the CQR pheno-type in P. falciparum has been identified in the P. falci-parum chloroquine resistance transporter (pfcrt) gene, located on chromosome 7 [11-13]. The amino acid substi-tution at pfcrt codon 76 (K→T) has been shown to have the strongest association with the CQR phenotype, which can be both reversible and irreversible by verapamil [7,11,14-20]. The pfcrt gene encodes an integral mem-brane protein, which is localized to the parasite digestive vacuole [11] where haem molecules released during hae-moglobin digestion are detoxified by the formation of haemozoin, also known as malaria pigment; CQ is sug-gested to interfere with this process [21,22]. P. falciparum
CQR is suggested to involve mechanisms whereby pH sensitive physiologic processes inhibit formation of toxic CQ:haematin complexes in favor of haemozoin [22], or CQ efflux reduces drug concentration to the levels that are no longer parasiticidal [23-25].
In addition to pfcrt, P. falciparum multidrug resistance (pfmdr1, chromosome 5) and nine other putative trans-porter genes have been implicated in CQR [7,26-28]. Pol-ymorphisms in pfmdr1 play a modulatory role in CQR [29], while those in only one of the other nine transporter genes (G7, encoding an ATP-binding cassette transporter [PlasmoDB identifier: PF13-0271]) exhibit significant association with response to the antimalarial drug artesu-nate [28].
To understand further the population genetics of CQR P. falciparum in PNG, samples collected from six different provinces in the early 1980's and after 1995, in both com-munity and clinical settings, were analysed. P. falciparum
samples were classified by genotyping pfcrt codons 72–76 (CVMNK represents chloroquine-sensitive [CQS] allele, SVMNT and CVIET CQR alleles), and were further ana-lysed for pfcrt single nucleotide polymorphisms (SNPs) at codons 220 (A→S), 271 (Q→E), 326 (N→D), 356 (I→L),
and 371 (R→I) [11,30], as well as 152 (T→A) and 163 (S→R), which have been recently implicated in parasite's resistance to amantadine and modification of verapamil-reversible CQR phenotype [30]. A series of four microsat-ellite (MS) loci and the cg2 ω repeat region flanking the
pfcrt locus (-18 kb upstream to +19 kb downstream), and recently discovered MS loci within the pfcrt gene [31] were analysed to investigate the diversity and distribution of CQS and CQR alleles. MS markers occurring at regular 2– 3 kb intervals in the P. falciparum genome [32] have been recently used to analyse both intra- and inter-population relationships among drug-resistant P. falciparum strains, based on the extent of linkage disequilibrium (LD) and its decay rates [33-35]. In this study, these same approaches were used to provide new insight into the dispersal and continuing evolution of CQR P. falciparum strains in PNG.
Methods
Collection of samples
Samples were collected from both placental tissues and whole blood. Seven placental tissues samples were obtained from pregnant women living in the Eastern Highlands (n = 1), East Sepik (n = 3), Manus (n = 1), Milne Bay (n = 1), and Morobe (n = 1) provinces of PNG between 1982 and 1984 [36]. Clinical data were not avail-able for these placental samples. Peripheral blood sam-ples were collected into K+-EDTA containing Vacutainer tubes from individuals living in three malaria-holoen-demic regions of PNG [37,38]. These samples were col-lected from the Dreikikir region of East Sepik Province (ESP) in 1996 (n = 31), the Liksul region of Madang Prov-ince in 1996 (n = 22), and the Wosera region of ESP. The Wosera samples were collected in 1998 (n = 65) and 2002 (n = 182) during community surveys, and between 2001 and 2003 (n = 980) from symptomatic (e.g., fever, parasi-taemia) patients at the local health centers. Study proto-cols were reviewed and approved by the Medical Research Advisory Committee, Department of Health PNG, and the University Hospitals of Cleveland Institutional Review Board.
Genomic DNA preparation and parasite reference strains
DNA was extracted from the placental tissue samples by a standard phenol/chloroform extraction method [36], and from the whole blood (200 μl) using the QIAamp 96 Blood Kit (QIAGEN, Valencia, CA). For MS allele analy-ses, genomic DNA preparations of six P. falciparum labo-ratory-adapted strains (HB3, 3D7, Dd2, K1, 7G8, and PNG1917) were used as references.
PCR amplification and genotyping of pfcrt codons
Polymerase Chain Reactions (PCR) to amplify pfcrt
and conditions described in Additional File 1. PCR prod-ucts were genotyped for the above polymorphic codons using ligase detection reaction-fluorescent microsphere assay (LDR-FMA) as recently described [39-41]. The allele-specific probes used in LDR-FMA are provided in Addi-tional File 2.
PCR amplification and genotyping of cg2 ω repeat region and MS loci
Amplification and genotyping of MS flanking pfcrt
(B5M77, 2E10, 9B12, and 2H4), cg2 ω repeat region, and a putatively neutral locus PfPK2 (chromosome 12) were performed using semi-nested PCR strategies as previously described [8,42]. Pfcrt intronic MS msint1, also known as B5M47 [13], and the newly discovered intronic MS msint2 and msint3 were amplified using nested PCR strat-egies; primer sequences and conditions for these amplifi-cations are provided in Additional File 1. For each MS, one of the nest-2 amplification primers was 5' end-labeled with Cy5. PCR products were mixed 3:1 (vol/vol) with denaturing loading dye buffer (formamide 10 ml, bromophenol blue 10 mg, 0.5 M EDTA [pH 8.0] 200 μl) and denatured at 95°C for 10 min. Denatured products were run on a 6% denaturing polyacrylamide gel (6.3 M urea/32% formamide) for 3 h in a Gibco BRL sequencing apparatus (model S2, Gibco BRL Life Technologies) at 1900 V. The Cy5-labeled amplicons were visualized on the Storm 860 scanner using the software ImageQuant v5.2 (Molecular Dynamics, Sunnyvale, CA). Alleles present in the field samples were compared with those present in the six reference strains, and were numerically designated from 1 to 10, corresponding to their relative electrophoretic mobility positions on the gel (1 = slowest, largest product; 10 = fastest, smallest product). Base pair sizes of msint2 and msint3 PCR products were deter-mined for some of the reference strains (3D7 = 222 and 200; K1 = 190 and 184; PNG1917 = 217 and 147, respec-tively) (Su X-Z, personal communication). However, in this study, numbers from 1 to 10 were used to designate the alleles [8]. ImageQuant was used to score multiple alleles per locus if the minor fluorescent peaks were >25% of the height of the predominant peak present at each locus. Haplotypes were constructed using the predomi-nant allele observed at each locus.
Statistical analysis
The population genetics software Arlequin v3.0 [43] was used to compute the heterozygosity (H) at each locus (value ± SD), full-length haplotype diversity (value ± SE), and genetic differentiation (Fst), which measures variation between population groups, and LD between loci. H and
Fst values measure from 0 to 1, where 0 means that there is no difference between individuals or groups, and 1 means that all individuals are unique and population groups are distinct from each other.
Results
A total of 1287 samples were analysed in this study. Seven of these were placental samples, collected from the East-ern Highlands (n = 1), East Sepik (n = 3), Manus (n = 1), Milne Bay (n = 1), and Morobe (n = 1) provinces between 1982 and 1984. From our more recent field studies, 1280 blood samples were collected from the Dreikikir (n = 31), Liksul (n = 22), and Wosera (n = 1227) regions between 1996 and 2003. The P. falciparum infection status of each sample was diagnosed by genotyping pfcrt codons 72–76 using LDR-FMA. All samples from the early 1980's, Dreikikir, and Liksul surveys were P. falciparum-infected. Of the samples collected from the Wosera, 166 samples from community surveys and 595 samples from health center surveys were P. falciparum-infected. Prevalence of genotypically CQS (CVMNK) and CQR (SVMNT and/or CVIET) P. falciparum at each sample collection site is sum-marized in Table 1. Of all samples (n = 1287), 8.9% were infected with CQS parasites, 47.9% with CQR parasites, and 6.9% with mixed infections, while 36.2% were not infected with P. falciparum. Interestingly, the CQR-associ-ated pfcrt allele CVIET was observed in the Wosera com-munity samples (0.006, n = 1/166) and clinical samples (0.013, n = 8/595) collected after 2001. Previous studies did not observe the CVIET allele in any of the PNG P. fal-ciparum-infected samples [7,8].
Pfcrt-SVMNT allele carrying samples in both the early 1980's and post-1995 groups were further analysed for SNPs at codons 220, 271, 326, 356, and 371, as well as recently reported SNPs at codons 152 and 163 in exon-3 [30] by LDR-FMA. In this expanded SNP analysis of pfcrt -SVMNT allele, S220Q271D326L356R371 was the predominant haplotype (>0.900). No polymorphism at codons 152 and 163 was observed in any of the samples. There was some variation to the S220Q271D326L356R371 haplotype in the post-1995 samples, with 220A (0.044, n = 8/181), 271E (0.011, n = 2/176), 326N (0.006, n = 1/149), 356I (0.092, n = 18/195), and 371I (0.059, n = 11/185). Since minor alleles at one or more positions were present as mixed infections, 220_271_326_356_371 minor haplo-types could not be inferred.
to determine if one or both of these MS contributed to the size variation observed for the exon-3 containing PCR products, primers were designed to amplify these sequences using nested strategies. When these products were run on a polyacrylamide gel, it was found that both msint2 and msint3 simple sequence repeats displayed size variations.
In the samples carrying the CQS-associated CVMNK allele, eight different msint2 alleles were observed (pre-dominant alleles #7 [0.266] and #3 [0.241]). Eight differ-ent alleles of msint3 were also observed in these samples (predominant alleles #8 [0.395] and #6 [0.296]). In the samples carrying the CQR-associated SVMNT allele, eight msint2 alleles (predominant allele #3 [0.889]) and five msint3 alleles (predominant allele #8 [0.954]) were observed. In the samples carrying the CQR-associated CVIET allele, three msint2 alleles (predominant allele #2 [0.5]) and two msint3 alleles (predominant allele #8 [0.833]) were observed. Allele frequencies for both MS in each subset of samples are presented in Additional File 4.
To analyse the levels of diversity at MS loci across the 40 kb region containing pfcrt-SVMNT alleles, heterozygosity (H) values were calculated for each individual locus. H
ranged from 0 to 0.781 (Table 2), with the highest value observed at the 2H4 locus (0.71 to 0.781) positioned 19 kb downstream from pfcrt. Elevated H was also observed at the PfPK2 locus (0.617 to 0.769), which has been pre-viously analysed in broad P. falciparum population sur-veys as a neutral marker under no apparent selection pressure [33,44]. H observed at the MS loci in the CQS (pfcrt-CVMNK) samples ranged from 0.642 to 0.903. Con-sistent with observations documenting reduced variation
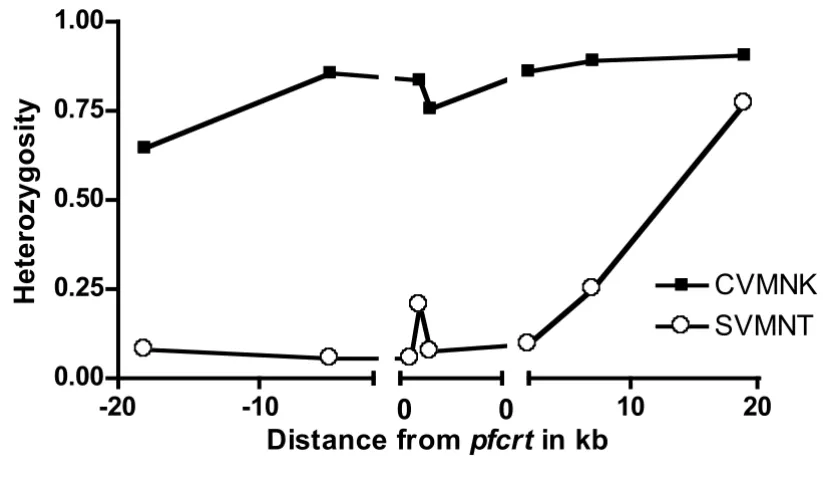
around P. falciparum genes associated with antimalarial drug resistance [45], the lowest values were observed for markers in the closest proximity to pfcrt (B5M77 to cg2; Figure 2). In contrast, elevated values were observed for the marker within pfcrt (msint2; Figure 2). Across the 40 kb region where pfcrt resides, significant LD (p < 0.05) was observed for eight of the pairwise comparisons (B5M77-B5M47, 2E10-(B5M77-B5M47, B5M77-pfcrt codon 371, 2E10-9B12, B5M47-2E10-9B12, B5M47-2H4, cg2ω-2H4, B5M47-PfPK2) in the CQR samples, and for four of the pairwise comparisons (pfcrt codon 220-pfcrt codon 356, 2E10-9B12, msint2-2H4, msint2-PfPK2) in the CQS samples. After a correction for multiple comparisons, significant LD was observed for two pairwise comparisons (B5M47-2H4, cg2ω-2H4; p < 0.0014) in the CQR samples, and for one pairwise comparison (pfcrt codon 220-pfcrt codon 356; p < 0.0009) in the CQS samples.
Fst values were then calculated for each MS locus between the geographically distinct sample collection sites to test for population subdivision, as might be expected between locations that are separated by distance and other geo-graphic factors that would reduce mixing of parasite pop-ulations by limiting human and/or mosquito travel. Results from these analyses (summarized in Table 3) showed similar Fst values for each pairwise comparison. Though locus-by-locus comparisons did show some sig-nificant Fst values, overall there is no clear-cut genetic var-iability among the three locations, suggesting no subdivision among CQR P. falciparum populations at these locations.
[image:4.612.53.559.99.247.2]Further, to examine the CQR parasite population structure and distribution among various locations, msint2_msint3 Table 1: Prevalence of pfcrt alleles (codons 72–76) in malaria-endemic regions of PNG
Early 1980'sa Post-1995
Community Clinical
Allele n = 7 Liksulb
n = 22
Dreikikirc
n = 31
Woserad
n = 166
Woserae
n = 595
CVMNK 0.143 0.045 0.484 0.241 0.097
SVMNT 0.857 0.955 0.516 0.572 0.791
CVIET 0 0 0 0.006f 0.013
CVMNK + SVMNT 0 0 0 0.181 0.086
CVMNK + CVIET 0 0 0 0 0.002
SVMNT + CVIET 0 0 0 0 0.012
a, b, c Samples with mixed infections were not included.
a Samples were collected from the Eastern Highlands (n = 1), East Sepik (n = 3), Manus (n = 1), Milne Bay (n = 1), and Morobe (n = 1) provinces of PNG between 1982 and 1984 and were previously reported [8].
b, c Samples were collected in 1996 and were previously reported [7].
d Samples were collected in 1998 and 2002. The 1998 samples were previously reported [7]. e Samples were collected between 2001 and 2003 in local health centers.
haplotypes in single infection samples were analysed (Table 4). In the early 1980's samples, three haplotypes were observed in the SVMNT samples (n = 6) (haplotype diversity, 0.467 ± 0.426), with the predominant haplo-type being 3_8 (0.667). It was of interest to note that the other two haplotypes (8_3 and 3_2) observed in these early samples were not observed in the later samples. Among the post-1995 SVMNT samples (n = 203), 11 hap-lotypes were observed (haplotype diversity, 0.103 ± 0.140), and the predominant haplotype was again 3_8 (from 0.667 to 0.955). In this intronic haplotype data analysis, it was observed that while the two predominant
[image:5.612.54.553.528.674.2]haplotypes (3_8 and 7_8) were present at all study sites, other low frequency haplotypes were segregated and were unique to each study site (Table 4). In the CVIET samples (n = 6), three haplotypes were present (haplotype diver-sity, 0.533 ± 0.468), with the predominant haplotype being 2_8 (0.5). Although this intronic haplotype was also observed in association with the SVMNT allele in the Wosera community survey samples (0.011), the other two haplotypes (1_8 [0.333] and 8_7 [0.167]) were unique to the CVIET samples; the 3_8 and 7_8 haplotypes that were predominant among the SVMNT samples were not observed in the CVIET samples. Finally, the intronic MS
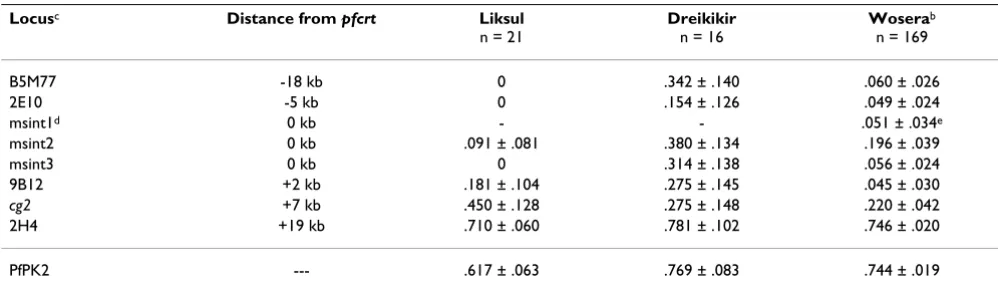
Table 2: Heterozygosity (± standard deviation) of MS loci associated with pfcrt-SVMNTa allele in post-1995 samples.
Locusc Distance from pfcrt Liksul
n = 21
Dreikikir n = 16
Woserab
n = 169
B5M77 -18 kb 0 .342 ± .140 .060 ± .026
2E10 -5 kb 0 .154 ± .126 .049 ± .024
msint1d 0 kb - - .051 ± .034e
msint2 0 kb .091 ± .081 .380 ± .134 .196 ± .039
msint3 0 kb 0 .314 ± .138 .056 ± .024
9B12 +2 kb .181 ± .104 .275 ± .145 .045 ± .030
cg2 +7 kb .450 ± .128 .275 ± .148 .220 ± .042
2H4 +19 kb .710 ± .060 .781 ± .102 .746 ± .020
PfPK2 --- .617 ± .063 .769 ± .083 .744 ± .019
a 21/22 infections in Liksul, 16/31 in Dreikikir, and 169/761 in Wosera carried the pfcrt-SVMNT allele. b Wosera group contains both clinical and community samples.
c PCR for Liksul samples was 100% for all loci except cg2 (.905). Frequency of amplification for each locus for Dreikikir and Wosera, respectively, were B5M77, 0.875, 0.970; 2E10, 0.813, 0.941; 9B12, 0.813, 0.941; cg2, 0.813, 0.976; 2H4, 0.875, 0.935; and PfPK2, 0.813, 0.935.
d MS also known as B5M47.
e Value based only on 78 of the 82 clinical samples and no community samples.
Agarose gel showing PCR products with size variability
Figure 1
haplotypes associated with the post-1995 CVMNK sam-ples were examined, and a total of 27 haplotypes in 54 samples were found (haplotype diversity, 0.772 ± 0.519), showing a much higher level of diversity than that observed among the SVMNT samples (Figure 2).
Discussion
Following the discovery of the association between pfcrt
K76T and P. falciparum CQR [11], Wootton et al. evalu-ated a number of MS loci flanking pfcrt (± 100 kb) of 87 laboratory-adapted strains collected from malarious regions around the world to investigate the impact of CQ selection pressure on the genetic diversity in this region of the genome [35]. Results of this study comparing CQS and CQR-associated alleles showed significant reduction in MS allelic diversity, increased LD, and uniform haplo-types for the markers in the closest proximity to the pfcrt
CQR allele [35]. They suggested that CQ was responsible for selection-driven "sweeps", homogenising genetic diversity at polymorphic sites in close physical linkage with CQR-associated alleles (hitchhiking) [35]. Similar observations have been made using MS flanking the alle-les associated with pyrimethamine resistance at the dihy-drofolate reductase gene (chromosome 4) [34,46-49] and quinine resistance at pfnhe-1, encoding a putative Na(+)/ H(+) exchanger (chromosome 13) [50]. A more recent study of MS flanking pfcrt, including some of the same samples analysed here, used these approaches to describe population subdivision between the early 1980's and late 1990's CQR P. falciparum strains in PNG [8].
With these observations in mind, it was expected that very low or no heterozygosity would be observed, similar to that reported by Wootton et al. for msint1 (B5M47), at msint2 and msint3 in CQR P. falciparum strains. Interest-ingly, this and a previous study [31] found higher levels of MS variability within the introns of the pfcrt gene than the variability at MS loci flanking pfcrt (Figure 2; msint2 vs. 2E10 or 9B12, [0.201 vs. 0.051 or 0.094]). As the flanking and intronic MS sites are similar in their length and nucle-otide content, two of the features associated with MS var-iability, it is not clear what genetic factors contribute to these higher levels of variability in pfcrt introns 2 and 3.
Intronic polymorphisms may provide important insights into maintenance of the pfcrt gene sequence. In addition to the MS length polymorphism reported now in pfcrt
msint2, msint3 and msint4, a review of genomic sequences currently available at GenBank for P. falciparum
strains 3D7 (GenBank accession number AL844506) and Dd2 (GenBank accession number AF030694) showed that simple sequence repeats were present within all pfcrt
introns. A comparison between 3D7 and Dd2 genomic sequences has shown additional length polymorphism for simple sequence repeats in introns 7 (T14 vs. T13), 9
(AT18 vs. AT15), 10 (T14 vs. T15), and two in intron-11 (T18 vs. T23 and T31 vs. T19). The highly AT-rich and polymor-phic characteristics of many intronic repeats has been described for a number of P. falciparum genes [51]. The high level of intronic diversity has been suggested to result from slippage of DNA polymerase [32,33]. Alternatively, repetitive AT-rich sequences that are palindromic have the potential to form intrastrand base-pairing, resulting in hairpins that are susceptible to breakage followed by mei-otic recombination [52]. Events of this nature could con-tribute to gene conversion where polymorphic exons are swapped between parental alleles in the formation of new progeny alleles [53,54]. Further evaluation of pfcrt in lab-oratory adapted strains and natural P. falciparum isolates may reveal sequence-based relationships supportive of the hypothesis that these loci promote recombination/ gene conversion within this genomic region [55].
In addition to evaluating pfcrt intronic MS, this study pro-vides the first evidence of the CQR-associated CVIET allele in PNG. While CVIET is the predominant CQR-associated
pfcrt allele in many parts of Southeast Asia [11,35], earlier studies in PNG [7,8] did not find this allele in any of the samples. Since the allele is found in nearby Indonesian regions [56,57], it is likely that this allele has been imported into PNG. When intronic MS loci in pfcrt -SVMNT and pfcrt-CVIET samples were compared, signifi-cant genetic differences were found between the two groups. The predominant msint2_msint3 haplotype 3_8 associated with pfcrt-SVMNT was not seen in pfcrt-CVIET samples. The haplotype diversity was significantly higher in the pfcrt-CVIET samples (0.533 ± 0.468) than in the
pfcrt-SVMNT samples (0.103 ± 0.14). Further, when flank-ing MS haplotype (from B5M77 to 2H4) diversity was compared between the two groups of samples from the Wosera, the extended haplotype diversity was also signifi-cantly higher in the pfcrt-CVIET samples (0.7 ± 0.728) than in the pfcrt-SVMNT samples (0.06 ± 0.077). These analyses rule out the possibility that the CVIET allele in PNG has arisen on the genetic background of more prev-alent SVMNT allele.
in different regions of PNG. These results are consistent with the results of a previous study [8], where significantly higher diversity was observed at the MS loci flanking pfcrt -SVMNT in the late 1990's samples than in the early 1980's samples. This suggests that although SVMNT remains the predominant CQR-associated pfcrt allele in PNG, its genetic background has accumulated significant diversity even under drug selection pressure.
Similar to the observations shown here, Vinayak et al. [31] found that a single major haplotype between pfcrt
msint2_msint4 (AT_TA repeats; frequencies 0.222–0.879) was distributed across their six Indian sample collection
[image:7.612.97.509.102.341.2]sites. The frequencies of the minor haplotypes ranged from 0.02–0.244; 12 of the 32 minor haplotypes were dis-tributed among sites separated by thousands of kilom-eters. In PNG, the major pfcrt msint2_msint3 haplotype (3_8) was present at all three sample collection sites at fre-quencies ranging from 0.667–0.955, while the 9 minor haplotypes were unique to each of the sites, and ranged in frequency from 0.011–0.048 (Table 4). Vinayak et al. [31] did not evaluate the polymorphism in msint3. Interest-ingly, when some of the same Indian samples were ana-lysed for msint2_msint3 haplotypes, it was found that the same haplotype predominant in PNG (3_8) was also present in Indian samples at a frequency of 0.917 (n = 22/
Table 3: Fst values to measure genetic diversity between groups of pfcrt-SVMNT samples from post-1995 collections
Locus Liksul-Dreikikir Liksul-Wosera Dreikikir-Wosera
B5M77 0.12* -0.01 0.17*
2E10 0.04 -0.02 0.04
msint2 0.03 -0.01 0.01
msint3 0.07 -0.01 0.12
9B12 -0.04 0.04 0.10
cg2 0.00 0.04 -0.01
2H4 0.07* 0.10* 0.08*
PfPK2 0.07* 0.01 0.03
* indicates that the value is significantly different from zero (p < 0.05).
[image:7.612.53.554.605.718.2]Heterozygosity of pfcrt intronic and flanking MS in pfcrt-CVMNK and SVMNT samples
Figure 2
Heterozygosity of pfcrt intronic and flanking MS in pfcrt-CVMNK and SVMNT samples. Graphic representation of heterozygosity values for pfcrt intronic and flanking MS in pfcrt-CVMNK and SVMNT samples from all study sites. Data for msint1 is available only from pfcrt-SVMNT clinical samples collected from the Wosera.
-20
-10
0.00
0.25
0.50
0.75
1.00
CVMNK
SVMNT
10
20
0
0
Distance from
pfcrt
in kb
24). This observation suggests a relationship between PNG and Indian CQR P. falciparum strains that should be further evaluated. Finally, although Vinayak et al. [31] observed overall reduced msint2_msint4 haplotype diver-sity in lower malaria transmission areas, in PNG the low-est msint2_msint3 diversity was observed in the Liksul region (Madang area), which is known to experience holoendemic malaria transmission. As malaria ecology is known to be very different between PNG and India, it is possible that local factors influencing P. falciparum trans-mission dynamics contribute to some of the overall differ-ences in frequency and distribution of intronic MS polymorphism between these two studies.
Recently, Ariey et al. used msint4 to look at the ancestry of CQR parasites at 16 survey sites throughout Africa [58]. By analysing the MS distribution in parasites carrying sensi-tive and resistant alleles, they reported a significant differ-ence in the level of variability with 17 MS alleles present in the sensitive parasites vs. two MS alleles present in the resistant parasites [58]. Because 123 of the 125 resistant parasites from wide ranging survey sites carried the same MS allele, Ariey et al. concluded that Africa was invaded by a single CQR P. falciparum strain [58]. While it is clear from Ariey et al. [58] that a single intron-4 MS allele pre-dominates among African CQR P. falciparum, results shown here and by Vinayak et al. [31] provide evidence that multiple intronic MS within pfcrt are polymorphic,
and they have differing levels of variability. Therefore, to fully understand the ancestry, dispersal, and population genetics of CQR P. falciparum in Africa, or throughout the world, more complete surveillance of pfcrt intronic MS should be conducted. It would also be interesting to examine earlier sample sets to determine if parasites with a single pfcrt intronic MS haplotype invaded Africa, or if multiple haplotypes occurred and only one became pre-dominant. Of further interest, given the recent reports that removal of CQ pressure in Africa is associated with a return of the wild-type pfcrt allele carrying strains and CQ sensitivity [59], analysis of polymorphisms in both intronic and flanking MS may provide useful insight regarding drug sensitivity distribution patterns.
Conclusion
In conclusion, highly polymorphic MS loci have been identified within the pfcrt gene. These new markers were used to reassess the relationships among P. falciparum in blood samples obtained from the early 1980's through 2003 from malaria-endemic sites in Madang and East Sepik Provinces of PNG. These results suggest that a single major haplotype associated with CQR has achieved wide-spread distribution in PNG, and that this sequence con-tinues to generate new polymorphism within localized regions. Although the analysis shown here has focused largely on MS polymorphism associated with the com-mon pfcrt-SVMNT allele, for the first time, the identifica-Table 4: Intronic haplotype frequencies for pfcrt-SVMNT and CVIET samplesa
Early 1980's Post-1995
Community Clinical
Liksul Dreikikir Wosera Wosera
Haplotype (msint2_msint3)
SVMNT nb = 6
SVMNT n = 22
SVMNT n = 21
SVMNT n = 88
SVMNT n = 82
CVIET n = 6
3_8 0.667 0.955 0.667c 0.898 0.951 0
7_8 0 0.045 0.095 0.057 0.037 0
8_3 0.167 0 0 0 0 0
3_2 0.167 0 0 0 0 0
7_4 0 0 0.048 0 0 0
3_3 0 0 0.048 0 0 0
3_6 0 0 0.048 0 0 0
6_6 0 0 0.048 0 0 0
10_8 0 0 0.048 0 0 0
8_8 0 0 0 0.023 0 0
9_8 0 0 0 0.011 0 0
2_8 0 0 0 0.011 0 0.500
4_8 0 0 0 0 0.012 0
1_8 0 0 0 0 0 0.333
8_7 0 0 0 0 0 0.167
a Total number of samples 215: early 1980's (6), Liksul (21), Dreikikir (16), Wosera community samples (85), Wosera clinical samples (81 SVMNT, 6 CVIET).
b "n" indicates the number of haplotype infections present, which may or may not be equal to the total number of samples due to mixed haplotypes in some samples. Overall, 225 haplotypes were found in 215 samples.
[image:8.612.53.554.100.338.2]tion of the pfcrt-CVIET allele in PNG is reported. These CVIET parasites contain intronic MS haplotypes that are not present in the SVMNT parasites, suggesting that the CVIET parasites may have been imported from neighbor-ing geographic regions. By usneighbor-ing pfcrt intronic MS as CQ susceptibility markers, the continuing evolution of pfcrt
can be monitored, the geographic and temporal patterns of CQS and CQR parasite populations can be further ana-lysed, and relative fitness of CQS and CQR P. falciparum
strains can be evaluated.
Authors' contributions
JTD and RKM performed the molecular typing of samples, data analysis, and interpretation, and wrote the manu-script. PM, IM, and JR collected and organised the PNG samples as well as developed the experimental design. YDS provided the Indian field samples and contributed to the experimental design. MS helped in data analysis and was involved in drafting the manuscript. PAZ was instru-mental in the experiinstru-mental design, data analysis, comple-tion of the manuscript, and raising funds for this study.
Additional material
Acknowledgements
We thank BT Grimberg and DT McNamara for providing helpful comments on the manuscript. Also, we thank TA Smith and JC Wootton for critical commentary and advice during the course of this study. This work was sup-ported by National Institutes of Health grant AI-52312.
References
1. Payne D: Spread of chloroquine resistance in Plasmodium fal-ciparum. Parasitol Today 1987, 3:241-246.
2. Trape JF: The public health impact of chloroquine resistance in Africa. Am J Trop Med Hyg 2001, 64:12-17.
3. Yung AP, Bennett NM: Chloroquine-resistant falciparum malaria in Papua New Guinea. Med J Aust 1976, 2:320-321. 4. Grimmond TR, Donovan KO, Riley ID: Chloroquine resistant
malaria in Papua New Guinea. P N G Med J 1976, 19:184-185. 5. Cattani JA, Tulloch JL, Vrbova H, Jolley D, Gibson FD, Moir JS,
Hey-wood PF, Alpers MP, Stevenson A, Clancy R: The epidemiology of malaria in a population surrounding Madang, Papua New Guinea. Am J Trop Med Hyg 1986, 35:3-15.
6. Dulay IS, Gibson FD, Eyeson-Annan MB, Narara A: Chloroquine resistance in Plasmodium falciparum and its geographical dis-tribution in Papua New Guinea. P N G Med J 1987, 30:281-290. 7. Mehlotra RK, Fujioka H, Roepe PD, Janneh O, Ursos LM, Jacobs-Lorena V, McNamara DT, Bockarie MJ, Kazura JW, Kyle DE, Fidock DA, Zimmerman PA: Evolution of a unique Plasmodium falci-parum chloroquine-resistance phenotype in association with
pfcrt polymorphism in Papua New Guinea and South Amer-ica. Proc Natl Acad Sci USA 2001, 98:12689-12694.
8. Mehlotra RK, Mattera G, Bhatia K, Reeder JC, Stoneking M, Zimmer-man PA: Insight into the Early Spread of Chloroquine-Resist-ant Plasmodium falciparum Infections in Papua New Guinea.
J Infect Dis 2005, 192:2174-2179.
9. Muller I, Bockarie M, Alpers M, Smith T: The epidemiology of malaria in Papua New Guinea. Trends Parasitol 2003, 19:253-259. 10. al-Yaman F, Genton B, Mokela D, Narara A, Raiko A, Alpers MP:
Resistance of Plasmodium falciparum malaria to amodi-aquine, chloroquine and quinine in the Madang Province of Papua New Guinea, 1990–1993. P N G Med J 1996, 39:16-22. 11. Fidock DA, Nomura T, Talley AK, Cooper RA, Dzekunov SM, Ferdig
MT, Ursos LM, Sidhu AB, Naude B, Deitsch KW, Su XZ, Wootton JC, Roepe PD, Wellems TE: Mutations in the P. falciparum digestive vacuole transmembrane protein PfCRT and evidence for their role in chloroquine resistance. Mol Cell 2000, 6:861-871. 12. Wellems TE, Walker-Jonah A, Panton LJ: Genetic mapping of the
chloroquine-resistance locus on Plasmodium falciparum chro-mosome 7. Proc Natl Acad Sci USA 1991, 88:3382-3386.
13. Su X, Kirkman LA, Fujioka H, Wellems TE: Complex polymor-phisms in an approximately 330 kDa protein are linked to chloroquine-resistant P. falciparum in Southeast Asia and Africa. Cell 1997, 91:593-603.
14. Djimde A, Doumbo OK, Cortese JF, Kayentao K, Doumbo S, Diourte Y, Dicko A, Su XZ, Nomura T, Fidock DA, Wellems TE, Plowe CV, Coulibaly D: A molecular marker for chloroquine-resistant falciparum malaria. N Engl J Med 2001, 344:257-263.
15. Pillai DR, Labbe AC, Vanisaveth V, Hongvangthong B, Pomphida S, Inkathone S, Zhong K, Kain KC: Plasmodium falciparum malaria in Laos: chloroquine treatment outcome and predictive value of molecular markers. J Infect Dis 2001, 183:789-795. 16. Mayor AG, Gomez-Olive X, Aponte JJ, Casimiro S, Mabunda S,
Dgedge M, Barreto A, Alonso PL: Prevalence of the K76T muta-tion in the putative Plasmodium falciparum chloroquine resistance transporter (pfcrt) gene and its relation to chloro-quine resistance in Mozambique. J Infect Dis 2001,
183:1413-1416.
17. Dorsey G, Kamya MR, Singh A, Rosenthal PJ: Polymorphisms in the Plasmodium falciparum pfcrt and pfmdr-1 genes and clini-cal response to chloroquine in Kampala, Uganda. J Infect Dis 2001, 183:1417-1420.
18. Babiker HA, Pringle SJ, Abdel-Muhsin A, Mackinnon M, Hunt P, Wal-liker D: High-level chloroquine resistance in Sudanese iso-lates of Plasmodium falciparum is associated with mutations in the chloroquine resistance transporter gene pfcrt and the multidrug resistance gene pfmdr1. J Infect Dis 2001,
183:1535-1538.
19. Chen N, Russell B, Staley J, Kotecka B, Nasveld P, Cheng Q:
Sequence polymorphisms in pfcrt are strongly associated with chloroquine resistance in Plasmodium falciparum. J Infect Dis 2001, 183:1543-1545.
20. Durand R, Jafari S, Vauzelle J, Delabre JF, Jesic Z, Le Bras J: Analysis of pfcrt point mutations and chloroquine susceptibility in iso-lates of Plasmodium falciparum. Mol Biochem Parasitol 2001,
114:95-102.
Additional File 1
Primers and PCR amplification conditions for pfcrt loci. Click here for file
[http://www.biomedcentral.com/content/supplementary/1475-2875-6-34-S1.doc]
Additional File 2
Ligase detection reaction primers for genotyping pfcrt codons. Click here for file
[http://www.biomedcentral.com/content/supplementary/1475-2875-6-34-S2.doc]
Additional File 3
Schematic of PCR primers used to characterise pfcrt intronic microsatel-lites.
Click here for file
[http://www.biomedcentral.com/content/supplementary/1475-2875-6-34-S3.eps]
Additional File 4
Allele frequencies of intron-2 and intron-3 microsatellites in malaria-endemic regions of Papua New Guinea.
Click here for file
21. Goldberg DE, Slater AF, Cerami A, Henderson GB: Hemoglobin degradation in the malaria parasite Plasmodium falciparum: an ordered process in a unique organelle. Proc Natl Acad Sci USA 1990, 87:2931-2935.
22. Dzekunov SM, Ursos LM, Roepe PD: Digestive vacuolar pH of intact intraerythrocytic P. falciparum either sensitive or resistant to chloroquine. Mol Biochem Parasitol 2000,
110:107-124.
23. Saliba KJ, Folb PI, Smith PJ: Role for the Plasmodium falciparum
digestive vacuole in chloroquine resistance. Biochem Pharmacol 1998, 56:313-320.
24. Krogstad DJ, Gluzman IY, Kyle DE, Oduola AM, Martin SK, Milhous WK, Schlesinger PH: Efflux of chloroquine from Plasmodium fal-ciparum: mechanism of chloroquine resistance. Science 1987,
238:1283-1285.
25. Sanchez CP, McLean JE, Rohrbach P, Fidock DA, Stein WD, Lanzer M:
Evidence for a pfcrt-associated chloroquine efflux system in the human malarial parasite Plasmodium falciparum. Biochem-istry 2005, 44:9862-9870.
26. Foote SJ, Kyle DE, Martin RK, Oduola AM, Forsyth K, Kemp DJ, Cow-man AF: Several alleles of the multidrug-resistance gene are closely linked to chloroquine resistance in Plasmodium falci-parum. Nature 1990, 345:255-258.
27. Mu J, Ferdig MT, Feng X, Joy DA, Duan J, Furuya T, Subramanian G, Aravind L, Cooper RA, Wootton JC, Xiong M, Su XZ: Multiple transporters associated with malaria parasite responses to chloroquine and quinine. Mol Microbiol 2003, 49:977-989. 28. Anderson TJ, Nair S, Qin H, Singlam S, Brockman A, Paiphun L,
Nos-ten F: Are transporter genes other than the chloroquine resistance locus (pfcrt) and multidrug resistance gene (pfmdr) associated with antimalarial drug resistance? Antimi-crob Agents Chemother 2005, 49:2180-2188.
29. Duraisingh MT, Cowman AF: Contribution of the pfmdr1 gene to antimalarial drug-resistance. Acta Trop 2005, 94:181-190. 30. Johnson DJ, Fidock DA, Mungthin M, Lakshmanan V, Sidhu AB, Bray
PG, Ward SA: Evidence for a central role for PfCRT in confer-ring Plasmodium falciparum resistance to diverse antimalarial agents. Mol Cell 2004, 15:867-877.
31. Vinayak S, Mittra P, Sharma YD: Wide variation in microsatellite sequences within each Pfcrt mutant haplotype. Mol Biochem Parasitol 2006, 147:101-108.
32. Su X, Ferdig MT, Huang Y, Huynh CQ, Liu A, You J, Wootton JC, Wellems TE: A genetic map and recombination parameters of the human malaria parasite Plasmodium falciparum. Science 1999, 286:1351-1353.
33. Anderson TJ, Su XZ, Roddam A, Day KP: Complex mutations in a high proportion of microsatellite loci from the protozoan parasite Plasmodium falciparum. Mol Ecol 2000, 9:1599-1608. 34. Nair S, Williams JT, Brockman A, Paiphun L, Mayxay M, Newton PN,
Guthmann JP, Smithuis FM, Hien TT, White NJ, Nosten F, Anderson TJ: A selective sweep driven by pyrimethamine treatment in southeast asian malaria parasites. Mol Biol Evol 2003,
20:1526-1536.
35. Wootton JC, Feng X, Ferdig MT, Cooper RA, Mu J, Baruch DI, Magill AJ, Su XZ: Genetic diversity and chloroquine selective sweeps in Plasmodium falciparum. Nature 2002, 418:320-323.
36. Stoneking M, Jorde LB, Bhatia K, Wilson AC: Geographic Varia-tion in Human Mitochondrial DNA from Papua New Guinea.
Genetics 1990, 124:717-733.
37. Mehlotra RK, Lorry K, Kastens W, Miller SM, Alpers MP, Bockarie M, Kazura JW, Zimmerman PA: Random distribution of mixed spe-cies malaria infections in Papua New Guinea. Am J Trop Med Hyg 2000, 62:225-231.
38. Mehlotra RK, Kasehagen LJ, Baisor M, Lorry K, Kazura JW, Bockarie MJ, Zimmerman PA: Malaria infections are randomly distrib-uted in diverse holoendemic areas of Papua New Guinea. Am J Trop Med Hyg 2002, 67:555-562.
39. Mehlotra RK, Ziats MN, Bockarie MJ, Zimmerman PA: Prevalence of CYP2B6 alleles in malaria-endemic populations of West Africa and Papua New Guinea. Eur J Clin Pharmacol 2006,
62:267-275.
40. McNamara DT, Kasehagen LJ, Grimberg BT, Cole-Tobian J, Collins WE, Zimmerman PA: Diagnosing infection levels of four human malaria parasite species by a polymerase chain reaction/ ligase detection reaction fluorescent microsphere-based assay. Am J Trop Med Hyg 2006, 74:413-421.
41. Carnevale EP, Kouri D, DaRe JT, McNamara DT, Mueller I, Zimmer-man PA: A Multiplex Ligase Detection Reaction-Fluorescent Microsphere Assay (LDR-FMA) for Simultaneous Diagnosis of Single Nucleotide Polymorphisms Associated with Plas-modium falciparum Drug Resistance. J Clin Microbiol 2007,
45:752-61.
42. Anderson TJ, Su XZ, Bockarie M, Lagog M, Day KP: Twelve micro-satellite markers for characterization of Plasmodium falci-parum from finger-prick blood samples. Parasitology 1999,
119:113-125.
43. Excoffier LGL, Schneider S: Arlequin ver. 3.0: An integrated soft-ware package for population genetics data analysis. Evolution-ary Bioinformatics Online 2005, 1:47-50.
44. Anderson TJ, Haubold B, Williams JT, Estrada-Franco JG, Richardson L, Mollinedo R, Bockarie M, Mokili J, Mharakurwa S, French N, Whit-worth J, Velez ID, Brockman AH, Nosten F, Ferreira MU, Day KP:
Microsatellite markers reveal a spectrum of population structures in the malaria parasite Plasmodium falciparum.
Mol Biol Evol 2000, 17:1467-1482.
45. Anderson TJ: Mapping drug resistance genes in Plasmodium falciparum by genome-wide association. Curr Drug Targets Infect Disord 2004, 4:65-78.
46. Roper C, Pearce R, Bredenkamp B, Gumede J, Drakeley C, Mosha F, Chandramohan D, Sharp B: Antifolate antimalarial resistance in southeast Africa: a population-based analysis. Lancet 2003,
361:1174-1181.
47. Roper C, Pearce R, Nair S, Sharp B, Nosten F, Anderson T: Inter-continental spread of pyrimethamine-resistant malaria. Sci-ence 2004, 305:1124.
48. Pearce R, Malisa A, Kachur SP, Barnes K, Sharp B, Roper C: Reduced variation around drug-resistant dhfr alleles in African Plas-modium falciparum. Mol Biol Evol 2005, 22:1834-1844.
49. Nash D, Nair S, Mayxay M, Newton PN, Guthmann JP, Nosten F, Anderson TJ: Selection strength and hitchhiking around two anti-malarial resistance genes. Proc Biol Sci 2005, 272:1153-1161. 50. Ferdig MT, Cooper RA, Mu J, Deng B, Joy DA, Su XZ, Wellems TE:
Dissecting the loci of low-level quinine resistance in malaria parasites. Mol Microbiol 2004, 52:985-997.
51. Volkman SK, Barry AE, Lyons EJ, Nielsen KM, Thomas SM, Choi M, Thakore SS, Day KP, Wirth DF, Hartl DL: Recent origin of Plasmo-dium falciparum from a single progenitor. Science 2001,
293:482-484.
52. Edelmann L, Spiteri E, Koren K, Pulijaal V, Bialer MG, Shanske A, Goldberg R, Morrow BE: AT-rich palindromes mediate the con-stitutional t(11;22) translocation. Am J Hum Genet 2001,
68:1-13.
53. Hartl DL: The origin of malaria: mixed messages from genetic diversity. Nat Rev Microbiol 2004, 2:15-22.
54. Nielsen KM, Kasper J, Choi M, Bedford T, Kristiansen K, Wirth DF, Volkman SK, Lozovsky ER, Hartl DL: Gene conversion as a source of nucleotide diversity in Plasmodium falciparum. Mol Biol Evol 2003, 20:726-734.
55. Kidgell C, Volkman SK, Daily J, Borevitz JO, Plouffe D, Zhou Y, John-son JR, Le Roch K, Sarr O, Ndir O, Mboup S, Batalov S, Wirth DF, Winzeler EA: A systematic map of genetic variation in Plasmo-dium falciparum. PLoS Pathog 2006, 2:e57.
56. Nagesha HS, Casey GJ, Rieckmann KH, Fryauff DJ, Laksana BS, Reeder JC, Maguire JD, Baird JK: New haplotypes of the Plasmodium fal-ciparum chloroquine resistance transporter (pfcrt) gene among chloroquine-resistant parasite isolates. Am J Trop Med Hyg 2003, 68:398-402.
57. Huaman MC, Yoshinaga K, Suryanatha A, Suarsana N, Kanbara H:
Short report: polymorphisms in the chloroquine resistance transporter gene in Plasmodium falciparum isolates from Lombok, Indonesia. Am J Trop Med Hyg 2004, 71:40-42. 58. Ariey F, Fandeur T, Durand R, Randrianarivelojosia M, Jambou R,
Legrand E, Ekala MT, Bouchier C, Cojean S, Duchemin JB, Robert V, Le Bras J, Mercereau-Puijalon O: Invasion of Africa by a single
pfcrt allele of South East Asian type. Malar J 2006, 5:34. 59. Laufer MK, Thesing PC, Eddington ND, Masonga R, Dzinjalamala FK,