Note
. This article will be published in a forthcoming issue of the
International Journal of Sports Physiology and Performance
. The
article appears here in its accepted, peer-reviewed form, as it was
provided by the submitting author. It has not been copyedited,
proofread, or formatted by the publisher.
Section: Original Investigation
Article Title: Playerload Variables are Sensitive to Changes in Direction and NotRelated to Collision Workloads in Rugby League Match-Play
Authors: Billy T. Hulin1,2, Tim J. Gabbett3,4, Rich D. Johnston5, and David G. Jenkins1
Affiliations: 1School of Human Movement and Nutrition Sciences, University of
Queensland, Brisbane, Australia. 2Football Department, St. George Illawarra Dragons Rugby
League Football Club, Wollongong, Australia. 3Gabbett Performance Solutions, Brisbane,
Australia. 4Institute for Resilient Regions, University of Southern Queensland, Ipswich,
Australia. 5School of Exercise Science, Australian Catholic University, Brisbane, Australia.
Journal: International Journal of Sports Physiology and Performance
Acceptance Date: February 26, 2018
©2018 Human Kinetics, Inc.
PLAYERLOAD VARIABLES ARE SENSITIVE TO CHANGES IN DIRECTION AND
NOT RELATED TO COLLISION WORKLOADS IN RUGBY LEAGUE
MATCH-PLAY
Submission type: Original investigation
Billy T. Hulin1,2, Tim J. Gabbett3,4, Rich D. Johnston5, and David G. Jenkins1
1School of Human Movement and Nutrition Sciences, University of Queensland, Brisbane,
Australia
2Football Department, St. George Illawarra Dragons Rugby League Football Club,
Wollongong, Australia
3Gabbett Performance Solutions, Brisbane, Australia
4Institute for Resilient Regions, University of Southern Queensland, Ipswich, Australia
5School of Exercise Science, Australian Catholic University, Brisbane, Australia
Preferred running head: Using PlayerLoad to measure activity profiles
Corresponding author: Billy Hulin
St. George Illawarra Dragons RLFC 1/5 Burelli Street
Wollongong, New South Wales, AUSTRALIA 2500 Tel: +61 413 224 667
Email: [email protected]
Abstract Word Count: 250
Word Count: 3,486
References: 28
Figure and Table: 2 and 1
ABSTRACT
Purpose: Determine: 1) how change of direction (COD) workloads influence PlayerLoad
variables when controlling total distance covered, and 2) relationships among collision
workloads and PlayerLoad variables during rugby league match-play. Methods: Participants
completed 3 protocols (crossover design) consisting of 10 repetitions of a 60 m effort in 15 s.
The difference between each protocol was the COD demands required to complete 1 repetition;
no COD (SL), 1 x 180º COD (1COD), or 3 x 180º COD (3COD). During rugby league matches,
relationships among collision workloads, tri-axial PlayerLoad (PLVM), anterior-posterior +
medio-lateral PlayerLoad (PL2D), and PLVM accumulated at locomotor velocities below 2
m.sec-1 (i.e. PLSLOW) were examined using Pearson correlations (r) with coefficients of
determination (R2). Results: Comparing 3COD to SL drills: PLVM.min-1 (d = 1.50 ± 0.49, large,
likelihood = 100%, almost certainly), PL2D.min-1 (d = 1.38 ± 0.53, large, likelihood = 100%,
almost certainly), and PLSLOW.min-1 (d = 1.69 ± 0.40, large, likelihood = 100%, almost
certainly) were greater. Collisions.min-1 demonstrated a distinct (i.e. R2 <0.50) relationship
from PLVM.min-1 (R2 = 0.30, r = 0.55), and PL2D.min-1 (R2 = 0.37, r = 0.61). Total distance.min1
demonstrated a very large relationship with PLVM.min-1 (R2 = 0.62, r = 0.79), and PL2D.min-1
(R2 = 0.57, r = 0.76). Conclusions: PlayerLoad variables demonstrate: 1) large increases as
COD demands intensify, 2) separate relationships from collision workloads, and 3) moderate
to very large relationships with total distance during match-play. PlayerLoad variables should
be used with caution to measure collision workloads in team sport.
INTRODUCTION
Wearable accelerometers, gyroscopes and magnetometers (i.e. microtechnology) are
now commonly used to measure the activity profiles of field-based team sport athletes.1,2
Tri-axial accelerometers measure the rate of acceleration across three anatomical planes;
anterior-posterior (Y-axis), mediolateral (X-axis), and vertical (Z-axis).1-3 Tri-axial vector-magnitude
PlayerLoad (PLVM) is calculated as the sum of the squared instantaneous rate of change in
acceleration in each of the three vectors (X-, Y- and Z-axis), which is then squared and divided
by 100.3 PlayerLoad in each individual plane can also been used by practitioners wishing to
measure vertical PlayerLoad (PLV) or anterior-posterior (PLAP) and mediolateral (PLML)
PlayerLoad in isolation and collectively as PL2D (i.e. PLAP + PLML).1
Gyroscope data and PLVM have also been used as part of an algorithm designed
specifically for rugby league, which can be used to quantify collision counts.4 This algorithm
is sensitive to detect 97.6% of collision events during professional rugby league match-play
and the typical error associated with measuring these events is 7.8%.4 Accurately quantifying
collision workloads is an important and evolving element of monitoring programs in collision
sports. Higher collision frequencies have been associated with greater team success in elite and
semi-elite rugby league match-play.5,6 Not surprisingly however, physical collisions are
associated with the majority of rugby league injuries during matches.7,8 Physical contact in
game-based activities produces more upper body neuromuscular fatigue, a greater and longer
lasting increase in plasma creatine kinase activity, and an increased perception of effort than
game-based activities involving no contact.9
Johnston et al.,9 demonstrated that game-based activities with contact produced higher
PL2D than game-based activities without contact. Furthermore, Cummins et al., (2017) recently
demonstrated that during positional drills, hit-up forwards experienced greater relative
two-dimensional accelerometer workloads than outside backs; which may not be surprising given
that hit-up forwards experience greater match-play collision demands than outside backs.10
However, running velocity is largely and positively related with PLVM during running circuits
designed to simulate soccer match-play; PLVM.min-1 is greater during sprinting efforts than
jogging and striding activities.11 In light of the available evidence, accelerometer derived
PlayerLoad variables are likely to increase with concomitant increases in any workload
variable (i.e. accelerations, decelerations, changes in direction, collision events, or locomotor
distance).
While the value and significance of measuring and monitoring PlayerLoad variables on
an individual level has been demonstrated in soccer and Australian football,1-3,12,13 their
relevance and importance to monitoring workloads in rugby league is not as clear. Before these
variables are used to inform monitoring practices in rugby league, sport scientists and
conditioning coaches need an understanding of what accelerometer-derived workloads truly
represent.14 For example, during professional Australian football matches, PLVM is strongly
correlated (R2 = 0.90) with total distance covered; this suggests that PLVM and total distance
are not distinct variables and provide the same information.15 The strong positive relationship
between PLVM and total distance is possibly due to the vertical (Z-axis) component of PLVM;
an increase in accumulated ground reaction forces while covering greater locomotor distance
will be coupled with an increase in PLV, which is one portion of PLVM. As such, PL2D is
provided, which hypothetically (but not undoubtedly) measures collision workloads by
disregarding PlayerLoad accumulated in the vertical axis (Z-axis).16
Additionally, Boyd et al.,2 used PLVM that was accumulated at locomotor velocities
below 2 m.sec-1 (i.e. PL
SLOW). These authors concluded that PLSLOW was a potential measure
of high-intensity activities that occur at low-velocity, such as contact and wrestling or
acceleration, deceleration and change of direction movements occurring in small spaces in
Australian football.2 Indeed, during game-based training in rugby league, PL
SLOW increased in
line with the amount of contact and wrestling efforts that players were required to perform.17
However, the relationship between PLSLOW and distance covered below the same velocity
threshold (2 m.sec-1) is yet to be established in professional rugby league players.
Although the relationships among collision workloads, PLVM, and PL2D have been
established in semi-professional rugby league players,10 more information may be provided by
investigating: 1) collision workloads in comparison with PlayerLoad in each individual plane
during professional rugby league matches, and 2) how change of direction workloads influence
all PlayerLoad variables. The purpose of this investigation was two-fold. First, we aimed to
determine how the addition of accelerations, decelerations and changes in direction influence
PlayerLoad variables when controlling for total distance covered. Second, we aimed to
examine the relationship between collision workloads and PlayerLoad in each anatomical plane
during professional rugby league match-play.
METHODS
Participants
Sixteen junior rugby league players (mean ± SD; age, 16.8 ± 0.8 yr; height, 178.7 ± 4.7
cm, mass, 85.9 ± 9.0 kg) participated in the first part of this study. These players were from the
development squad of a professional rugby league club. The second part of the study included
25 professional rugby league players (age, 25.6 ± 2.7 yr; height, 184.0 ± 5.0 cm, mass, 98.7 ±
8.9 kg) during 270 (10.9 ± 5.5 per player) individual appearances in Australian National Rugby
League (NRL) competition. The study was approved by an ethics committee at the University
of Queensland.
Experimental design
Part one
The influence of accelerations, decelerations and changes in direction on all PlayerLoad
variables when controlling for total distance covered was investigated by having each
participant complete 3 separate drills in a crossover design. Each drill required participants to
complete 10 repetitions of a 60 m effort in 15 s, on a 1:1 work:rest ratio (Figure 1). The
difference between each drill was the number of changes in direction required to complete one
repetition; drill A required no change in direction (straight line; SL), drill B required 1 x 180º
change in direction (1 COD), and drill C required 3 x 180º changes in direction (3 COD). After
each repetition, the participants had 15 seconds to walk a 5 m ‘out-and-back shuttle’ before
beginning the next repetition. The distance required to complete each drill was 700 m (140
m.min-1). The influence of change of direction workloads on acceleration and deceleration
activity was assessed by counting the total number of accelerations and decelerations in each
drill using global positioning system (GPS) technology that has demonstrated appropriate
accuracy for measuring these variables in team sports (Catapult, Optimeye S5, firmware
version 7.27, Melbourne, Australia).18
Each participant was randomly assigned to one of three groups and rotated through each
drill during three training sessions; a minimum of seven days separated each of the testing
sessions. Across the three sessions, the groups completed the drills in the following orders:
group 1, drills A, B, and C; group 2, drills B, C, and A; group 3, drills C, A, and B. A
standardised warm-up preceded each testing session and the participants were familiarised with
the speed at which they were required to run in order to complete each repetition in the required
15 seconds. The 15 second work and recovery times were controlled by an audible signal
emitted via a speaker. If participants ran at a speed that resulted in the completion of any
repetition faster than 15 seconds, their data were removed from the analysis (n = 2). All
variables were analysed relative to the duration of each drill.
Factorial analysis of variance (ANOVA) was used to identify differences in each
variable between the straight line, 1 COD, and 3 COD conditions. Any significant differences
were assessed with the use of Bonferroni adjusted confidence limits. Statistical significance
was set at P < .05. As multiple comparisons were being made, a practical approach determining
the scale of difference between each protocol was used. Specifically, all data were
log-transformed and compared using Cohen effect-size (d) statistic and 90% confidence intervals
(CI), which determined the magnitude of any differences.19,20 The magnitude of the d was
classified as trivial (<0.2), small (0.21–0.6), moderate (0.61–1.2), large (1.21–2.0), or very
large (>2.1). In the event that the 90% CI overlapped both positive and negative thresholds the
d was classified as unclear.19,20
Part two
The relationship between collision workloads and all PlayerLoad variables during
professional rugby league match-play was examined. A total number of 12,039 collision events
(481.6 ± 314.1 per player) were examined across all matches. Participants were fitted with
microtechnology equipment (Catapult, Optimeye S5, firmware version 7.27, Melbourne,
Australia) that has demonstrated accuracy for measuring collision counts during professional
rugby league match-play,4 and acceptable within- (CV 0.91 to 1.05%) and between-device
(1.02 to 1.90%) reliability for measuring rate of change in acceleration, which is used to
calculate PlayerLoad.3 These microtechnology devices have demonstrated a capacity to
identify 97.6% of collision events during rugby league match-play.4 Low-intensity (<1
PlayerLoad AU), and short duration (<1 s) collision reports were excluded, as this improves
the accuracy (92.7%) and typical error of estimate (7.8%) for these devices to detect collision
events during matches.4 In order for a collision to be detected by the microtechnology device,
a spike in instantaneous PlayerLoad ≥2 arbitrary units (AU) is required to occur along with a
change in orientation of the device (>60° forwards; >45° left or right; >30° backward), which
is measured using the gyroscopes axes for yaw, pitch, and roll.4,21
As collision events of a duration greater than 5 seconds have been reported,4 a measure
of overall collision intensity was also investigated; the PLVM accumulated during collision
events (i.e. collision-PLVM) was quantified. This was done by summating PLVM between the
commencement (i.e. initial spike in instantaneous PlayerLoad ≥2 arbitrary units [AU]) and the
conclusion (i.e. return of the device to an upright position) of each collision event.4
All data were log-transformed to reduce non-uniformity of error. Potential relationships
between the number of collisions sustained, PLVM accumulated during collision events (i.e.
collision-PLVM), all PlayerLoad variables, total distance covered, and distance covered <2
m.sec-1 during matches were determined using Pearson correlations (r), which were derived
using the Statistical Package for Social Sciences (SPSS). The magnitude of each relationship
(r) was classified as small (0.0-0.29), moderate (0.30-0.49), large (0.50-0.69), verylarge
(0.70-0.89), nearlyperfect (0.90-0.99), and perfect (1.00).19 Coefficients of determination (R2) were
also used to interpret the meaningfulness of any relationship; an R2 less than 0.5 (50%) indicates
that two variables are distinct and independent in nature.22
RESULTS
Part one
The total number of accelerations and decelerations was greater in the 3 COD condition
(83.0 ± 2.4), compared to 1 COD (71.1 ± 5.9; d = 1.55 ± 0.40, large, likelihood = 100%, almost
certainly) and straight line conditions (40.5 ± 5.5; d = 1.90 ± 0.17, large, likelihood = 100%,
almost certainly).
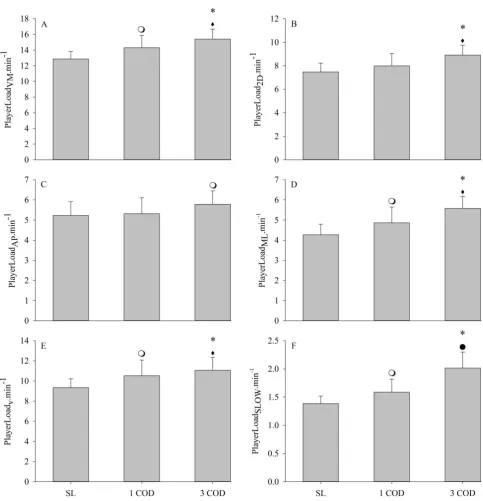
PLVM.min-1 was greater during the 3 COD condition than during 1 COD (d = 0.72 ±
0.64, moderate, likelihood = 91%, likely, P = 0.005) and straight line (d = 1.50 ± 0.49, large,
likelihood = 100%, almost certainly, P = 0.000) conditions (Figure 2A). During the 3 COD
protocol, PL2D.min-1 was greater than the 1 COD (d = 0.91 ± 0.61, moderate, likelihood = 97%,
very likely, P = 0.001), and straight line (d = 1.38 ± 0.53, large, likelihood = 100%, almost
certainly, P = 0.000) protocols (Figure 2B). PLML.min-1 was greater when completing 3 COD
than 1 COD (d = 0.96 ± 0.59, moderate, likelihood = 98%, very likely, P = 0.001) and straight
line running (d = 1.52 ± 0.45, large, likelihood = 100%, almost certainly, P = 0.000) protocols
(Figure 2D). There was a large increase in PLSLOW.min-1 during the 3 COD protocol, compared
with the 1 COD (d = 1.29 ± 0.54, large, likelihood = 100%, almost certainly, P = 0.000) and
straight line (d = 1.69 ± 0.40, large, likelihood = 100%, almost certainly, P = 0.000) protocols
(Figure 2F).
PLSLOW.min-1 (d = 0.91 ± 0.59, moderate, likelihood = 97%, very likely, P = 0.004),
PLML.min-1 (d = 0.83 ± 0.60, moderate, likelihood = 96%, very likely, P = 0.003), PLV.min-1 (d
= 0.84 ± 0.60, moderate, likelihood = 96%, very likely, P = 0.006), and PLVM.min-1 (d = 0.96
± 0.58, moderate, likelihood = 98%, very likely, P = 0.002) were greater during the 1 COD
protocol than the straight line condition (Figure 2). An unclear difference was found between
PLAP.min-1 (d = 0.11 ± 0.67, unclear, likelihood = 41%, possibly, P = 0.999) when comparing
the 1 COD and straight line conditions (Figure 2C).
Part two
The relationships between measures of collision, PlayerLoad, and locomotor activity
during professional rugby league match-play are displayed in Table 1. The number of
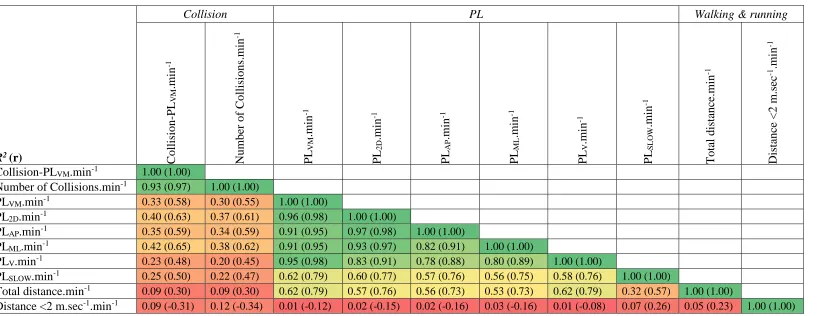
Collisions.min-1 were related with collision-PLVM.min-1 (R2 = 0.93, r = 0.97, nearly perfect).
Collisions.min-1 demonstrated a distinct (i.e. R2 <0.50) relationship from: PLVM.min-1 (R2 =
0.30, r = 0.55, large), PL2D.min-1 (R2 = 0.37, r = 0.61, large), PLAP.min-1 (R2 = 0.34, r = 0.59,
large), PLML.min-1 (R2 = 0.38, r = 0.62, large), PLV.min-1 (R2 = 0.20, r = 0.45, moderate),
PLSLOW.min-1 (R2 = 0.22, r = 0.47, moderate).
Total distance.min1 demonstrated a very large relationship with: PLVM.min-1 (R2 = 0.62,
r = 0.79, very large), PL2D.min-1 (R2 = 0.57, r = 0.76, very large), PLAP.min-1 (R2 = 0.56, r =
0.73, very large), PLML.min-1 (R2 = 0.53, r = 0.73, very large), PLV.min-1 (R2 = 0.62, r = 0.79,
very large).
PLSLOW.min-1 had a distinct (i.e. R2 <0.50) relationship from: the number of
Collisions.min-1 (R2 = 0.22, r = 0.47, moderate), Total distance.min1 (R2 = 0.32, r = 0.57, large),
and Distance <2 m.sec-1.min-1 (R2 = 0.07, r = 0.26, small).
DISCUSSION
We investigated whether PlayerLoad variables are influenced by change of direction
workloads, and examined the relationships among collision workloads and PlayerLoad
variables during professional rugby league match-play. Our findings demonstrate that all
PlayerLoad variables are sensitive to change of direction workloads. In addition, PL2D, PLVM,
PLAP, PLML, PLV, and PLSLOW each demonstrated a distinct relationship from collision
workloads during professional rugby league matches. As such, these variables should be used
with caution when quantifying the collision demands of rugby league match-play. Specifically,
when compared to collision workloads, all PlayerLoad variables demonstrated an R2 of <0.5,
which suggests that the variables are separate and independent.22 As such, although PlayerLoad
provides a summation of the rate of acceleration change occurring during activity, it does not
provide a valid measure of collision workload.
Total distance covered demonstrated a very large relationship (r > 0.70, R2 > 0.50) with
PLVM, PLAP, PLML, and PLV during professional rugby league match-play. However, the
magnitude of the relationship between total distance and PLVM was smaller in this study than
the nearly perfect relationships reported in Australian football (r = 0.94, R2 = 0.90),15 and
soccer (r = 0.93, R2 = 0.86).23 We believe that the differences in these relationships may be due
to dissimilarities in acceleration and contact demands between these sports.24 Relative to
match-play durations, rugby league players cover less total distance and complete a greater
number of acceleration efforts than Australian football and soccer players.24 Furthermore, the
relationship between PLVM and the number of collisions is stronger in positions where contact
demands are higher during rugby league match-play.10 Collectively, these findings demonstrate
that compared with other field-based team sports, PLVM provides a lower predictive value as a
surrogate measure of total distance covered during rugby league match-play. Furthermore,
PlayerLoad variables may be considered a better indication of ‘global’ external workload than
a quantification of various movements in isolation (i.e. collision events, acceleration,
deceleration or change of direction workloads).
PLSLOW demonstrated the greatest sensitivity to change of direction workloads. For
example, although all PlayerLoad variables demonstrated at least moderate effect size
differences between 1 COD and 3 COD protocols, PLSLOW was the only variable that
demonstrated a large effect size difference between these conditions. Furthermore, PLSLOW,
which is the accumulated PLVM below a locomotor velocity of 2 m.sec-1, was not related with
distance covered below the same velocity threshold (2 m.sec-1) during match-play. This finding
may be surprising given that overall total distance covered and PLVM had a very large
correlation and were not distinct variables. However, these findings collectively suggest that
PLSLOW may be capable of quantifying high intensity movements such as changes in direction
that occur at locomotor velocities below 2 m.sec-1. However, practitioners should consider that
increases in PLSLOW may be due to other activities such as contact and wrestling that occur at
low movement velocities.17
During rugby league matches, PL2D demonstrated: 1) nearly perfect relationships with
PLVM, PLAP, PLML, and PLV, and 2) a distinct relationship from collision workloads.
Furthermore, when controlling for total distance covered, large effect size differences were
demonstrated between PL2D during straight line and multiple change of direction efforts (3
COD). These findings indicate that PL2D does not provide any additional information on
collision workloads than other PlayerLoad variables. Although small-sided games with contact
produced greater PL2D than small-sided games without contact,9 increases in PL2D may not
always be the result of collision workloads; PL2D is sensitive to change in direction workloads
and has a separate relationship with collision workloads during rugby league matches.
Practitioners should use this variable with caution when quantifying collision workloads in
team sport.
PLAP revealed the weakest relationship with change of direction workloads; only
moderate differences were found between the straight line and 3 COD conditions, whereas
other PlayerLoad variables demonstrated large differences. This finding demonstrates that
when these change of direction tasks were completed, there was a greater increase in loading
in the medio-lateral and vertical planes than in the anterior-posterior plane. Considering that
PLAP is a component of PL2D, practitioners should note that both PLAP and PL2D may not be as
appropriate for quantifying change of direction workloads as PLML, PLV, and PLSLOW. Given
that greater blood lactate concentration, heart rate and oxygen uptake have been demonstrated
following running with change of direction requirements than straight line running,25-27 our
findings suggest that PlayerLoad variables may be capable of providing important information
on the demands of training sessions or matches in team sport.
Although the present study provides novel and practically applicable findings; there a
number of limitations that need to be considered. Firstly, we investigated the influence of
change of direction workloads on PlayerLoad variables during three conditions that were
standardised for total distance covered. However, we did not investigate the effect of
progressive increases in collision demands across three conditions on PlayerLoad variables.
This would likely have provided more information on the use of PlayerLoad to measure
collision demands. However, our findings still demonstrate that: 1) large differences were
evident in PlayerLoad variables when increases in change of direction were present, and 2)
collision counts during match-play were distinct from all PlayerLoad variables. Collectively,
these findings demonstrate that all PlayerLoad variables are incapable of providing accurate
measures of collision workloads during rugby league match-play and cannot be used to
measure contact workloads as they may be influenced by running demands.
PRACTICAL APPLICATIONS
This study provides a number of applications that have practical value to sport
scientists, conditioning coaches, and researchers in team sport. We have demonstrated that all
PlayerLoad variables are sensitive to change of direction workloads. During professional rugby
league matches, all PlayerLoad variables demonstrated: 1) separate relationships from collision
workloads, and 2) very large relationships with total distance covered. Furthermore, with the
exception of PLSLOW, all PlayerLoad variables demonstrated nearly perfect relationships
among each other; the application of these variables does not provide an additional measure of
activity profiles than PLVM during rugby league match-play. As such, the application of
PlayerLoad variables to measuring isolated collision workloads in team sport should be
conducted with restraint. Collectively, these findings demonstrate that no PlayerLoad variable
provides a valid measure of collision workload in team sport.
PLSLOW demonstrated the greatest sensitivity to change of direction workloads. As such,
movements such as accelerations, decelerations, and changes of direction that occur at low
velocities may result in an increase in PLSLOW. Additionally, PLSLOW showed a distinct
relationship from collision counts and total distance covered during rugby league matches,
rendering it less useful for quantifying these parameters during competition. Furthermore, PLAP
was not as sensitive to change of direction workloads as PLML and PLV. Practitioners
endeavouring to quantifying change of direction demands should consider PLML and PLV as
more appropriate than PLAP, and PL2D.
CONCLUSIONS
This study provides information on the ability of accelerometer-derived workloads to
quantify change of direction and collision workloads. We believe that this information can be
used to inform the monitoring of external workloads in team sport. However, we note that the
link between physiological and biomechanical measures of workload, and their associated
outcomes should be considered when implementing these findings in practice.28
Although PLVM and its associated alternatives provide an overall quantitation of the
workload associated with a given training session or match, no PlayerLoad variable is capable
of accurately quantifying collision events. With the exception of PLSLOW, all PlayerLoad
variables have a closer relationship with total distance covered than collision workloads.
Indeed, these variables can be used by practitioners to quantify the volume and intensity of
training sessions and matches. However, further investigation may be required if practitioners
need to identify what type of movements have caused variations in any PlayerLoad variable.
ACKNOWLEDGEMENTS
The authors would like to thank Nathan Pickworth, Ryan Bailey, the club staff and the players
that participated in this study. No sources of funding were used to conduct this research.
REFERENCES
1. Barrett S, Midgley A, Reeves M, Joel T, Franklin E, Heyworth R, Garrett A, Lovell R.
The within-match patterns of locomotor efficiency during professional soccer match
play: Implications for injury risk? J Sci Med Sport. 2016;19:810-5.
2. Boyd LJ, Ball K, Aughey RJ. Quantifying external load in Australian football matches
and training using accelerometers. Int J Sports Physiol Perform. 2013;8:44-51.
3. Boyd LJ, Ball K, Aughey RJ. The reliability of minimaxX accelerometers for
measuring physical activity in Australian football. Int J Sports Physiol Perform.
2011;6:311-321.
4. Hulin BT, Gabbett TJ, Johnston RD, Jenkins DG. Wearable microtechnology can
accurately identify collision events during professional rugby league match-play. J Sci
Med Sport. 2017;20:638-642.
5. Hulin BT, Gabbett TJ, Kearney S, Corvo A. Physical demands of match play in
successful and less-successful elite rugby league teams. Int J Sports Physiol Perform.
2015;10:703-710.
6. Hulin BT, Gabbett TJ. Activity profiles of successful and less-successful semi-elite
rugby league teams. Int J Sports Med. 2015; 36: 485–489.
7. Gabbett TJ. Severity and cost of injuries in amateur rugby league: a case study. J Sports
Sci. 2001;19:341–347.
8. Gabbett TJ. Influence of training and match intensity on injuries in rugby league. J
Sports Sci. 2004;22:409–417.
9. Johnston RD, Gabbett TJ, Seibold AJ and Jenkins DG. Influence of physical contact on
neuromuscular fatigue and markers of muscle damage following small-sided games. J
Sci Med Sport. 2014;17:535-540.
10. Gabbett TJ. Relationship between accelerometer load, collisions, and repeated
high-intensity effort activity in rugby league players. J Strength Cond Res. 2015;29:3424–
3431.
11. Barreira P, Robinson MA, Drust B, Nedergaard N, Raja Azidin RMF, Vanrenterghem
J. Mechanical Player Load™ using trunk-mounted accelerometry in football: Is it a
reliable, task- and player-specific observation? J Sports Sci. 2017;35:1674-1681.
12. Barrett S, Midgley A, Lovell R. PlayerLoad™: reliability, convergent validity, and
influence of unit position during treadmill running. Int J Sports Physiol Perform. 2014;
9:945-952.
13. Barrett S, Midgley A, Towlson C, Garrett A, Portas M, Lovell R. Within-match
PlayerLoad™ patterns during a simulated soccer match: potential implications for unit
positioning and fatigue management. Int J Sports Physiol Perform. 2015; 10:135-140.
14. Burgess DJ. The research doesn't always apply: practical solutions to evidence-based
training-load monitoring in elite team sports. Int J Sports Physiol Perform. 2017;
2(Suppl 2):S2136-S2141.
15. Aughey RJ. Applications of GPS technologies to field sports. Int J Sports Physiol
Perform. 2011;6:295-310.
16. Cummins C, McLean B, Halaki M, Orr R. Positional differences in external on-field
load during specific drill classifications across a professional rugby league pre-season.
Int J Sports Physiol Perform. 2016;11:1-27.
17. Johnston RD, Gabbett TJ, Jenkins DG. Influence of number of contact efforts on
running performance during game-based activities. Int J Sports Physiol Perform. 2015;
10: 740-745.
18. Varley MC, Fairweather IH, Aughey RJ. Validity and reliability of GPS for measuring
instantaneous velocity during acceleration, deceleration, and constant motion. J Sports
Sci. 2012; 30: 121–127.
19. Hopkins WG, Marshall SW, Batterham AM, Hanin J. Progressive statistics for studies
in sports medicine and exercise science. Med Sci Sports Exerc. 2009;41:3-13.
20. Cohen J. Statistical power analysis for the behavioural sciences. 2nd ed. Hillsdale, NJ:
Lawrence Erlbaum; 1988.
21. Reardon C, Tobin DP, Tierney P, Delahunt E. Collision count in rugby union: A
comparison of micro-technology and video analysis methods. J Sports Sci. 2017; 35:
2028-2034.
22. Thomas JR, Nelson JK, Silverman, SJ. Research methods in physical activity. 7th ed.
Champaign, IL; Human Kinetics; 2015.
23. Scott BR, Lockie RG, Knight TJ, Clark AC, Janse de Jonge XA. A comparison of
methods to quantify the in-season training load of professional soccer players. Int J
Sports Physiol Perform. 2013;8:195-202.
24. Varley MC, Gabbett T, Aughey RJ. Activity profiles of professional soccer, rugby
league and Australian football match play. J Sports Sci. 2014;32:1858-1866.
25. Buchheit M, Bishop D, Haydar B, Nakamura FY, Ahmaidi S. Physiological responses
to shuttle repeated-sprint running. Int J Sports Med. 2010 31;402-409.
26. Buchheit M, Haydar B, Hader K, Ufland P, Ahmaidi S. Assessing running economy
during field running with changes of direction: application to 20 m shuttle runs. Int J
Sports Physiol Perform. 2011;6:380-395.
27. Dellal A, Keller D, Carling C, Chaouachi A, Wong del P, et al. (2010) Physiologic
effects of directional changes in intermittent exercise in soccer players. J Strength Cond
Res. 2010;24:3219-3226.
28. Vanrenterghem J, Nedergaard NJ, Robinson MA. Training load monitoring in team sports: a novel framework separating physiological and biomechanical
load-adaptation pathways. Sports Med. 2017; 47: 2135–2142.
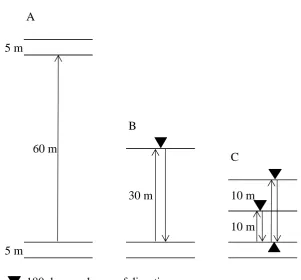
Figure 1. Design of 3 experimental protocols used to determine how the addition of changes in direction influence all PlayerLoad variables when controlling for total distance covered. One repetition of each drill involved a 60 m running effort completed in 15 seconds; drill A was a 60 m straight line effort, drill B was a 60 m shuttle run with 1 change of direction (1 COD), and drill C was a 60 m effort with 3 changes in direction (3 COD). The participants had 15 seconds to walk a 5 m ‘out-and-back’ recovery between each repetition.
A
5 m
B
C
5 m
180 degree change of direction 60 m
30 m
10 m 10 m
Figure 2. Differences in PlayerLoad variables when controlling for distance covered and adding change of direction tasks in junior rugby league players. Data are presented as mean ± SD.
SL = Straight line running at 140m/min; 1 COD = 140 m/min with 1 x 180º change of direction;
3 COD = 140 m/min with 3 x 180º changes of direction.
*Large effect size difference from SL; Large effect size difference from 1 COD; Moderate effect
size difference from SL; Moderate effect size difference from 1 COD.
[image:20.595.75.559.93.595.2]Table 1. Relationships between measures of collision, PlayerLoad (PL), and locomotor activity during professional rugby league match-play.
R2 (r)
Collision PL Walking & running
C oll isi on -PL VM .mi n -1 Numbe r of C oll isi ons .mi n -1 PL VM .mi n -1 PL 2D .mi n -1 PL AP .mi n -1 PL ML .m in -1 PL V .mi n -1 PL S LO W .mi n -1 Tota l di stanc e.mi n -1 Dist anc e < 2 m.s ec -1 .mi n -1
Collision-PLVM.min-1 1.00 (1.00)
Number of Collisions.min-1 0.93 (0.97) 1.00 (1.00)
PLVM.min-1 0.33 (0.58) 0.30 (0.55) 1.00 (1.00)
PL2D.min-1 0.40 (0.63) 0.37 (0.61) 0.96 (0.98) 1.00 (1.00)
PLAP.min-1 0.35 (0.59) 0.34 (0.59) 0.91 (0.95) 0.97 (0.98) 1.00 (1.00)
PLML.min-1 0.42 (0.65) 0.38 (0.62) 0.91 (0.95) 0.93 (0.97) 0.82 (0.91) 1.00 (1.00)
PLV.min-1 0.23 (0.48) 0.20 (0.45) 0.95 (0.98) 0.83 (0.91) 0.78 (0.88) 0.80 (0.89) 1.00 (1.00)
PLSLOW.min-1 0.25 (0.50) 0.22 (0.47) 0.62 (0.79) 0.60 (0.77) 0.57 (0.76) 0.56 (0.75) 0.58 (0.76) 1.00 (1.00)
Total distance.min-1 0.09 (0.30) 0.09 (0.30) 0.62 (0.79) 0.57 (0.76) 0.56 (0.73) 0.53 (0.73) 0.62 (0.79) 0.32 (0.57) 1.00 (1.00)
Distance <2 m.sec-1.min-1 0.09 (-0.31) 0.12 (-0.34) 0.01 (-0.12) 0.02 (-0.15) 0.02 (-0.16) 0.03 (-0.16) 0.01 (-0.08) 0.07 (0.26) 0.05 (0.23) 1.00 (1.00)
Coloured shading represents a correlation (r) that is:
Small Moderate Large Very large Nearly perfect Perfect