Copyright © 1998, American Society for Microbiology
Similar Levels of Human Immunodeficiency Virus Type 1
Replication in Human T
H
1 and T
H
2 Clones
JUDY A. MIKOVITS,
1DENNIS D. TAUB,
2SUSAN M. TURCOVSKI-CORRALES,
2AND
FRANCIS W. RUSCETTI
3*
Intramural Research Support Program, SAIC-Frederick,
1and the Laboratory of Leukocyte Biology,
3National Cancer
Institute-Frederick Cancer Research and Development Center, Frederick, Maryland, and Immunology Program,
National Institute of Aging, Baltimore, Maryland
2Studies on the development and function of CD4
1T
H
1 and T
H2 cells during the progression to AIDS may
increase the understanding of AIDS pathogenesis. The preferential replication of human immunodeficiency
virus (HIV) in either T
H1 or T
H2 cells could alter the delicate balance of the immune response. T
H1 (gamma
interferon [IFN-
g
] positive, interleukin-4 [IL-4] and IL-5 negative) and T
H2 (IFN-
g
negative, IL-4 and IL-5
positive) clones, developed from several healthy donors, pedigreed by reverse transcriptase PCR (RT-PCR) and
enzyme linked immunosorbent assay have similar levels of cell surface expression of CD4 and several
chemo-kine receptor cofactors necessary for viral entry. After activation by specific antigens and infection with
T-cell-tropic strains of HIV type 1 (HIV-1), T
H1 and T
H2 clones showed similar levels of viral entry and reverse
transcription. At days 3 through 14 postinfection, HIV replicated to similar levels in several T
H1 and T
H2
clones as measured by release of HIV p24 and total number of copies of gag RNA/total cell RNA as measured
by RT-PCR. When values were normalized for viable cell number in three clones of each type, there was up to
twofold more HIV RNA in T
H1 than T
H2 cells. In addition, several primary monocytotropic HIV-1 strains were
able to replicate to similar levels in T
H1 and T
H2 cells. These studies suggest that the importance of T
H1 and
T
H2 subsets in AIDS pathogenesis transcends clonal differences in their ability to support HIV replication.
During AIDS progression, CD4
1T cells are severely
re-duced first in biological responsiveness and then in cell
num-bers, leading to a degeneration of the patient’s ability to
gen-erate an effective immune response (22, 40). The propagation
of human immunodeficiency virus (HIV) in vivo is not
pre-vented by a strong cellular and humoral response against HIV
type 1 (HIV-1). Antibody production and cell-mediated
immu-nity are often reciprocal immune responses associated with
distinct patterns of cytokine production by two subsets of
CD4
1T-helper (T
H
) cells. Cells of the T
H1 subset secrete
interleukin-2 (IL-2) and gamma interferon (IFN-
g
) but not
IL-4 or IL-5 and are associated with cell-mediated responses
such as delayed-type hypersensitivity; T
H2 cells secrete IL-4
and IL-5 but not IFN-
g
and are associated with antibody and
allergic responses (36, 50, 51, 55, 57). These cytokines are also
secreted by other cell types, contributing to overlapping
pat-terns of cytokine expression which may complicate our
under-standing of mechanistic issues involved in the immune
re-sponse.
During microbial infections, particularly chronic persistent
infections, there can be a preferential development of one of
the T
Hlineages. Simply, infections by viruses and intracellular
pathogens are often better controlled by cellular (T
H1 and
cytotoxic T-cell) responses, whereas infections by parasites and
bacteria may be controlled more effectively by antibody-T
H2
responses (14, 15, 51, 57). However, while the development of
the correct immune response is critical in host resistance to
microbes, some infectious agents can stimulate inappropriate
cytokine responses, contributing to increased disease
pathol-ogy (1). As CD4
1T cells are the preferential targets of HIV,
much interest and controversy have developed regarding a role
for the T
H1 and T
H2 cells and cytokines during HIV infection
and their relationship to HIV pathogenesis (3, 9–12, 31, 43–46,
49, 56).
Studies by Maggi et al. (43) suggest that HIV replicates
preferentially in T
H2 and T
H0 rather than T
H1 clones in vitro.
This concept has been incorporated in recent models of HIV
pathogenesis (11, 49, 56). Since the complex nature of
virus-cell interactions as well as the extravirus-cellular environment can
often affect the kinetics and magnitude of viral replication,
HIV replication and cell survival were examined in a panel of
human antigen-specific CD4
1T
H
1 and T
H2 clones. After
ac-tivation by specific antigens and infection with HIV-1, T
H1 and
T
H2 clones, developed from healthy donors, showed similar
levels of strong-stop and full-length viral DNA. Regardless of
the tropism of virus used, HIV replicated to similar levels in
several T
H1 and T
H2 clones. When values were normalized for
viable cell number, there was up to twofold more HIV-1 RNA
in T
H1 than T
H2 cells, indicating that there is little difference
in the ability of T
H1 and T
H2 subsets to support HIV
replica-tion in vitro.
MATERIALS AND METHODS
Derivation and maintenance of antigen-specific human CD41T-cell clones.
Purified protein derivative (PPD)-specific, tetanus toxoid (TTx)-specific, keyhole limpet hemocyanin (KLH)- and Dermatophagoides pteronyssinus antigen (DP)-specific, and staphylococcal enterotoxin B (SEB)-reactive T-cell clones were generated as previously described (25, 28). PPD and TTx were purchased from Connaught, Inc. (Swiftwater, Pa.), SEB was purchased from the Sigma Chemical Company (St. Louis, Mo.), and DP and KLH were purchased from Miles, Inc. (Spokane, Wash.). Briefly, peripheral blood mononuclear cells (PBMCs) at a concentration of 53105cells/ml in clone medium (EHAA [Click’s] medium
supplemented withL-glutamine, 2-mercaptoethanol, 2% human AB serum, 10%
fetal calf serum, penicillin-streptomycin, nonessential amino acids, and sodium pyruvate; Life Technologies, Gaithersburg, Md.) were stimulated with either PPD (1mg/ml), TTx (10mg/ml), DP (10 IU/ml), or SEB (0.1mg/ml) in 24-well flat-bottom plates for 7 days. Many but not all of the TH1 and TH2 clones used
in these studies were derived in cultures supplemented with the THcell selective
cytokines, IL-4 and IL-12. For the generation of TH1 clones, these cultures were
supplemented with recombinant human IFN-g(rhIFN-g; 10 U/ml; Peprotech, Rocky Hill, N.J.), rhIL-12 (50 pg/ml; Roche, Nutley, N.J.), and anti-IL-4
mono-* Corresponding author. Mailing address: Laboratory of Leukocyte
Biology, NCI-Frederick Cancer Research and Development Center,
Bldg. 567, Rm. 254, Frederick, MD 21702-1201. Phone: (301)
846-1504. Fax: (301) 846-7034. E-mail: [email protected].
5231
on November 9, 2019 by guest
http://jvi.asm.org/
clonal antibody (MAb; 10mg/ml; R&D Systems, Minneapolis, Minn.) over the culture period. For TH2 clones, bulk cultures were supplemented with rhIL-4
(200 U/ml; Peprotech) and anti-IFN-gMAb (10mg/ml; R&D Systems). Forty-eight hours after the initiation of these cultures, rhIL-2 (10 U/ml) was added to each of the wells. After 7 days of incubation, the cultures were harvested, extensively washed, replated in fresh clone medium supplemented with addi-tional IL-2 (10 U/ml; Cellular Products, Buffalo, N.Y.), and incubated for an additional 7 to 10 days. Viable T cells were then plated in limiting-dilution cultures (0.5 cells/well) in 16 flat-bottom 96-well plates containing 23 105
irradiated (1,200 rads) syngeneic PBMC feeder cells, specific antigen, and IL-2 (10 U/ml) in a final volume of 200ml. The cultures were examined daily and supplemented with the TH1- and TH2-selecting cytokines (as described above) at
10-day intervals with feeder cells and IL-2. Individual clones were isolated and then characterized for lymphokine production by enzyme-linked immunosorbent assay (ELISA) and PCR analysis and for the ability to respond to specific antigen in combination with syngeneic irradiated (1,200 rads) feeder cells.
To maintain THclones, cells were restimulated every 14 to 21 days with
specific antigen in the presence of autologous PMBCs treated with mitomycin C at 25mg/ml to prevent outgrowth of feeder cells and IL-2 (20 U/ml). After 96 h of antigenic stimulation, cells were subjected to two successive Ficoll-Hypaque centrifugations to remove dead cells. All clones were tested for their cytokine profiles by ELISA after stimulation with a combination phorbol myristate acetate (PMA) and monoclonal anti-CD3 as well as with antigen and antigen-presenting cells to determine the phenotype of each clone.
Chemokine binding assays.Binding conditions for CC chemokines MIP-1a, MIP-1b, RANTES, MCP-1 and MCP-3 and the CXC chemokine IL-8 were as previously described (58, 61). Briefly, 23106cells were incubated in duplicate
or triplicate (depending on the availability of the clones) with increasing con-centrations of125I-labeled chemokines in a modified binding medium (RPMI
1640 with 1 mg of bovine serum albumin per ml, 25 mM HEPES, and 0.05% sodium azide [pH 7.4]) in a total volume of 200ml. The residual nonspecific binding was determined by parallel incubation of125I-labeled chemokine in the
presence of a 100-fold excess of unlabeled chemokine. After incubation at 4°C or room temperature for 90 min, the cells were pelleted through a 10% sucrose– phosphate-buffered saline (PBS) cushion. The tips of the tubes containing cells were cut, and radioactivity was quantitated in a gamma counter. The residual nonspecific bound radioactivity associated with cells in the presence of unlabeled chemokine was subtracted from the total bound radioactivity to yield specific binding. The data were analyzed with the Biosoft RADLIG program.
Chemokine receptor flow cytometric analysis.Phycoerythrin and fluorescein isothiocyanate-labeled rabbit antibodies specific for human CXCR4, CCR5, CXCR1, CXCR2, and CD4 were obtained from R&D Systems. Polyclonal rabbit anti-CCR1 antibody was generously provided by Richard Horuk (Berlex Bio-sciences, Richmond, Calif.). Flow cytometric staining and analysis were per-formed as previously described (52, 61). The data are expressed as percent positive (6standard deviation) and/or as mean channel fluorescence.
HIV infection of T-cell clones.Antigen-stimulated clones (23106cells/0.5
ml), 4 to 7 days postactivation (.95% viable by trypan blue exclusion), were inoculated with cell-free viral isolates with a total of 100 pg of HIV p24 and allowed to adsorb for 90 min at 37°C in a shaking water bath before complete aspiration of medium, washing with PBS, and addition of fresh growth medium containing IL-2 (20 U/ml). Cells were aliquoted at 106cells/ml in 24-well plates.
Three laboratory T-cell-tropic (syncytium-inducing [SI]) strains of HIV used were BP1 (48), IIIB, and MN (purified 1,000-fold; kindly provided by the AIDS vaccine program, Frederick, Md.). These viral stocks were grown in H9 cells. The primary monocytotropic (non-SI [NSI]) viruses, SF162, US657, US714, and US727, were obtained from the AIDS Reference and Reagent Program. These stocks were grown in primary PBMCs.
Quantitation of cytokine and p24 production by T-cell clones.Quantitative determinations for lymphokines (human IL-2, IL-4, IL-5, IL-10, and IFN-g) from the 48-h supernatants of antigen-stimulated T-cell clones were done by ELISA (Quantikine; R&D Systems) by following the manufacturers’ instructions. The results are expressed in either nanograms/milliliter or units/milliliter based on a standard curve determined by using recombinant cytokine within the ELISAs. Cytokine analyses after HIV infection were performed with cell-free superna-tants and were quantitated by ELISA for IL-4, IL-5 (R&D Systems), and IFN-g (Medigenix) with sensitivities of 3 pg/ml, 1 pg/ml, and 1 IU/ml, respectively. Viral p24 antigen was determined by ELISA (Cellular Products) with a sensitivity of 10 pg/ml. To determine the portion of the cells productively infected, flow cytometry for intracellular expression of HIV-1 p24 was performed with rhodamine-con-jugated anti-p24 antibody.
Detection of HIV-1 DNA in T-cell clones.For the detection of viral DNA, cell lysates were made by incubating 106cells in 100ml of lysis buffer (10 mM Tris
HCl [pH 8], 1 mM EDTA, 0.001 mM Triton X-100–sodium dodecyl sulfate, 1 mg of proteinase K per ml) at 60°C for 1 h followed by 99°C for 10 min to inactivate the proteinase K. Quantitative PCR amplification was performed with one oli-gonucleotide of each pair end labeled with33P, and 25 ng was used in each
reaction (53105to 53106cpm). The samples were denatured for 5 min at 94°C
followed by 25 cycles of denaturation for 1 min at 91°C and annealing-extension for 2 min at 65°C (63). Primers for minus strong-stop HIV-1 R and U5 (140 bp), sense (59-GGCTAACTAGGGAACCCACGT-39) and antisense (59-CTGCTAG AGATTTTCCACACTGAC-39), and for HIV-1 long terminal repeat (LTR) and
gag (200 bp), sense (59-CTGCTAACTAGGGAACCCACGT-39) and antisense (59-CCTGCGTCGAGAGAGCTCCTCTGG-39), were previously described by Zack et al. (63). The primers LA1 and LA2 (63) for humanb-globin were included as a control for amplification. Products were separated by electrophore-sis on an 8% nondenaturing acrylamide gel. Dried gels were analyzed on a PhosphorImager (Molecular Dynamics, San Diego, Calif.), quantitated with Im-ageQuant and Microsoft Excel software, and exposed to Kodak XAR-5 film at 270°C overnight. HIV-1 copy numbers per 50,000 cells/lane were estimated by comparing graded doses of ACH-2 DNA lysate; this cell line contains 1 proviral copy/cell (26).
RT-PCR analysis of cytokine and HIV-1 RNA.RNA was prepared from 106
cells by using RNA Stat 60 (Tel Test Inc., Friendswood, Tex.). Reverse tran-scription of 5mg of RNA was performed with Superscript II reverse transcriptase (RT) (Life Technologies). One to two microliters of the reaction mixture was used in each amplification. Primer pairs for cytokine detection were purchased as RT-PCR Amplimer sets (Clontech, Palo Alto, Calif.). Primers SK38 and SK39 for HIV gag (positions 1543 to 1570 and 1630 to 1657) (6) and glyceraldehyde-3-phosphate dehydrogenase (GAPDH) (371 to 388, 546 to 565) (29) were pre-FIG. 1. Characterization of human THclones by RT-PCR. Single-cell cloning
of human peripheral blood was performed as described in Materials and Meth-ods. Presence of mRNA for IFN-gand IL-4 in these clones was measured 7 days after antigen activation, using RT-PCR as described in Materials and Methods. (A) Clones isolated under TH1 conditions. Lane 1, IFN-g; lane 2, IL-4; lane 3,
GAPDH. Arrows indicate positions of cytokine standards. (B) Clones isolated under TH2 conditions. Lane 1, standard (STD) for IL-4 (427 bp); lane 2, standard
[image:2.612.316.541.71.219.2]for IFN-g(459 bp) (Clontech). GAPDH (not shown) was used as a loading control.
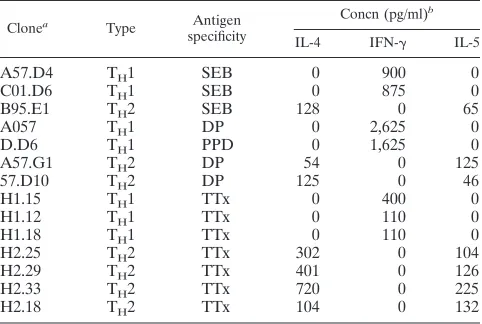
TABLE 1. Characterization of cytokine production in human T
H1
and T
H2 clones in vitro
Clonea Type Antigen
specificity
Concn (pg/ml)b
IL-4 IFN-g IL-5
A57.D4
T
H1
SEB
0
900
0
C01.D6
T
H1
SEB
0
875
0
B95.E1
T
H2
SEB
128
0
65
A057
T
H1
DP
0
2,625
0
D.D6
T
H1
PPD
0
1,625
0
A57.G1
T
H2
DP
54
0
125
57.D10
T
H2
DP
125
0
46
H1.15
T
H1
TTx
0
400
0
H1.12
T
H1
TTx
0
110
0
H1.18
T
H1
TTx
0
110
0
H2.25
T
H2
TTx
302
0
104
H2.29
T
H2
TTx
401
0
126
H2.33
T
H2
TTx
720
0
225
H2.18
T
H2
TTx
104
0
132
aT-cell clones with the indicated antigenic specificities were generated from PBMCs of three HIV-seronegative donors (SEB represents one donor, DP and PPD represent a second donor, and TTx represents a third donor) maintained and activated as described in Materials and Methods.
bCytokine production was determined by ELISA at 7 days after antigen activation.
on November 9, 2019 by guest
http://jvi.asm.org/
[image:2.612.308.549.515.677.2]viously described. Amplification was carried out in the presence of [32P]dCTP as
previously described (17). Products were separated by electrophoresis on an 8% nondenaturing acrylamide gel. Dried gels were analyzed on a PhosphorImager (Molecular Dynamics), quantitated with ImageQuant and Microsoft Excel soft-ware, and exposed to Kodak XAR-5 film at270°C for 1 to 4 h. GAPDH was always used as a control for amplification.
In vitro synthesis of HIV-1 RNA. HIV-1 RNA synthesized from a DNA template produced by the amplification of HIV-1 proviral DNA by using mod-ified HIV-1 gag region-specific primers SK38 and SK39 (64) was kindly provided by B. Poiesz (State University of New York, Syracuse). Briefly, primer SK38 was altered by the addition of the T3 RNA polymerase promoter sequence (59-CC CTATAGTGAGTCGTATTA-39), in inverse complementary orientation, to the 59 end of the original primer sequence. An additional five bases (GGTCG) upstream of the promoter site were included to ensure more efficient binding of the RNA polymerase. The modified primer, RPSK38, was used with primer SK39 to amplify 1mg of HUT 78/HIVAAVDNA by PCR. The resulting product
was separated by electrophoresis on and excised from a native 10% polyacryl-amide gel and eluted into 50ml of diethyl pyrocarbonate-treated H2O. Ten
microliters of this HIV-1 gag DNA was then mixed with 40ml of RNA synthesis cocktail containing 10ml of 53reaction buffer (Life Technologies), 400 U of RNasin (Promega, Madison, Wis.), 100 U of T7 RNA polymerase (Stratagene, La Jolla, Calif.), 2.5ml of 100 mM dithiothreitol, and 2ml each of 10 mM deoxynucleoside triphosphates in diethyl pyrocarbonate-treated H2O. After
in-cubation at 37°C for 1 h, 4 U of RQ1 DNase was added to digest the template DNA. The resulting HIV-1 single-stranded gag RNA was separated on and eluted from a native 10% polyacrylamide gel and serially used as an RNA standard in RT-PCR assays. For quantitation, RNA was diluted until its signal was in the linear range of the standard curve, using 1,000 to 2,000 RNA mole-cules, and dried gels were analyzed on a PhosphorImager (Molecular Dynamics), quantitated with ImageQuant and Microsoft Excel software, and exposed to Kodak XAR-5 film at270°C for 1 to 4 h.
Statistics.Means and standard error of the mean (SEM) were calculated for the results of HIV p24 antigen determination.
RESULTS
Generation and characterization of antigen-specific T
Hclones.
T
Hcell clones were derived from three different
non-HLA-matched healthy PBMC donors as described in Materials
and Methods. In contrast to mice, human T
H1 and T
H2
phe-notypes are less restricted in cytokine expression in that both
subsets produce IL-2 and IL-10 (14, 55, 56). Therefore, we
used RT-PCR to in addition to ELISAs to pedigree each of
these antigen-specific T-cell clones. Using these criteria, we
found numerous T
H0 clones regardless of whether T
H1- or
T
H2-promoting media were used (Fig. 1). The T
H1 clones used
in these studies were specific for either TTx, DP, SEB, or PPD,
while T
H2 clones were specific for DP or TTx. All of the T-cell
clones used expressed similar cell surface phenotypes (CD4
1,
CD8
2, CD3
1, CD19
2, CD56
2, CD16
2, and CD14
2) as
de-termined by flow cytometric analysis and were found to
pro-liferate in response to specific but not irrelevant antigens (data
not shown). All T
H1 clones used were negative for IL-4 and
IL-5 and positive for IFN-
g
by ELISA (Tables 1 and 2) and
IL-4 negative and IFN-
g
positive by RT-PCR (representative
clones are shown in Fig. 1A). Similarly, all of the T
H2 clones
used were negative for IFN-
g
and positive for IL-4 and IL-5 by
ELISA (Tables 1 and 2) and IFN-
g
negative and IL-4 positive
by RT-PCR (representative clones are shown in Fig. 1B). All
T
H1 and four of seven T
H2 clones also produced IL-2. All
clones producing a combination of T
H1 and T
H2 lymphokine
mRNAs were designated T
H0 (Fig. 1; Table 2) and not used
for HIV infection.
Similar levels of HIV receptors on the cell surface of
anti-gen-activated T
Hcell clones.
The recent demonstration that
CC chemokines can inhibit HIV-1 infection (13) followed by
the finding that selected CC and CXC chemokine receptors (8,
16, 19, 20, 23, 38) act as cofactors with CD4
1to mediate viral
entry into cells represents a significant advance in our
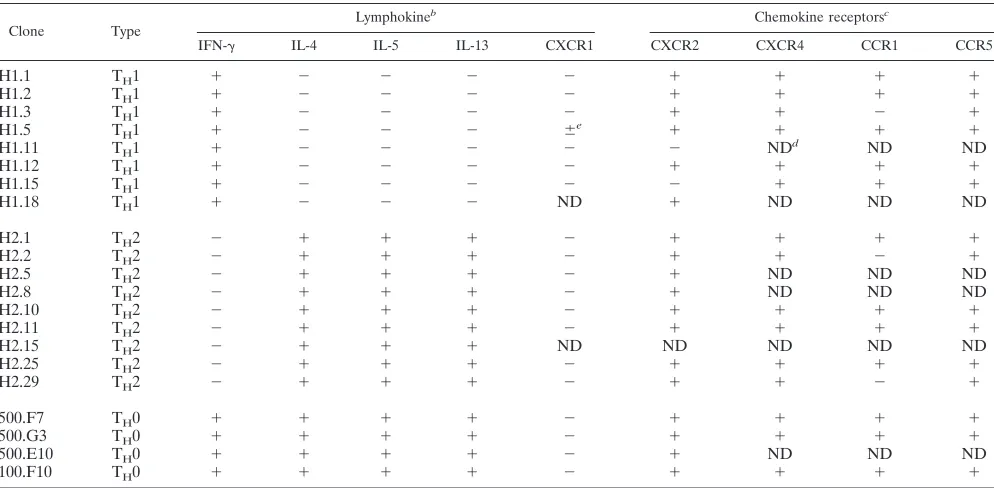
under-TABLE 2. Phenotypic summary of T
Hcell clones derived from two different human donors
aClone Type Lymphokine
b Chemokine receptorsc
IFN-g IL-4 IL-5 IL-13 CXCR1 CXCR2 CXCR4 CCR1 CCR5
H1.1
T
H1
1
2
2
2
2
1
1
1
1
H1.2
T
H1
1
2
2
2
2
1
1
1
1
H1.3
T
H1
1
2
2
2
2
1
1
2
1
H1.5
T
H1
1
2
2
2
6
e1
1
1
1
H1.11
T
H1
1
2
2
2
2
2
ND
dND
ND
H1.12
T
H1
1
2
2
2
2
1
1
1
1
H1.15
T
H1
1
2
2
2
2
2
1
1
1
H1.18
T
H1
1
2
2
2
ND
1
ND
ND
ND
H2.1
T
H2
2
1
1
1
2
1
1
1
1
H2.2
T
H2
2
1
1
1
2
1
1
2
1
H2.5
T
H2
2
1
1
1
2
1
ND
ND
ND
H2.8
T
H2
2
1
1
1
2
1
ND
ND
ND
H2.10
T
H2
2
1
1
1
2
1
1
1
1
H2.11
T
H2
2
1
1
1
2
1
1
1
1
H2.15
T
H2
2
1
1
1
ND
ND
ND
ND
ND
H2.25
T
H2
2
1
1
1
2
1
1
1
1
H2.29
T
H2
2
1
1
1
2
1
1
2
1
500.F7
T
H0
1
1
1
1
2
1
1
1
1
500.G3
T
H0
1
1
1
1
2
1
1
1
1
500.E10
T
H0
1
1
1
1
2
1
ND
ND
ND
100.F10
T
H0
1
1
1
1
2
1
1
1
1
aHuman T-cell clones were obtained through limiting-dilution analysis as described in Materials and Methods. All of the H-series clones are TTx specific, while the remaining clones are KLH specific.
bSupernatants obtained from activated T-cell clones were tested for the production of various cytokines by ELISA, and cytokine mRNA expression was tested by RT-PCR analysis as described in Materials and Methods.
cBoth quiescent and activated T-cell clones were examined by flow cytometric analysis for the presence of various chemokine receptors on their cell surface. In addition, many of these clones were also examined by radiolabeled binding assays for chemokine binding sites and affinity as described in Materials and Methods.
dND, not determined. e6, not consistently positive.
on November 9, 2019 by guest
http://jvi.asm.org/
[image:3.612.51.548.80.324.2]standing of HIV infectivity. Different strains of HIV-1 use
different chemokine receptors for cell entry:
macrophage-tropic HIV-1 strains mainly use CCR5 (8, 16, 20) and to a
lesser extent CCR3 and CCR2b (19), while T-cell-tropic strains
use CXCR4 (23, 38). Therefore, we analyzed the cell surface
expression of HIV-1 receptors on T
H1, T
H2, and T
H0 clones 4
to 5 days after antigen activation. Regardless of the T
Hsubset
of the clones, they expressed detectable levels of CXCR4 and
CCR5 by flow cytometry analysis whereas expression of
CXCR1 and CCR1 was variable (Table 2). The densities (the
amount of antigen as measured by the mean channel
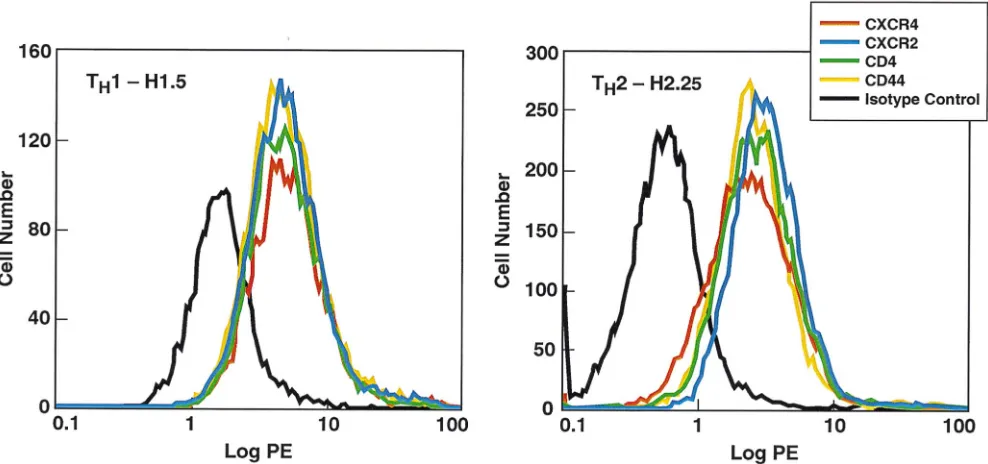
fluores-cence) of these molecules as well as CD4 and CD44 expression
on the cell surface were also similar on T
H1 and T
H2 clones
(Fig. 2; Table 3). The density of CXCR4 was consistently
higher than the density of CCR5 on these activated T
Hcells
regardless of subset. Scatchard analysis showed that the
num-ber and affinity (K
d) of binding sites for CC and CXC
chemo-kines were similar on T
H1 and T
H2 clones (Table 4).
Similar levels of HIV-1 entry in antigen-activated T
Hcell
clones.
Three different T
H1 and T
H2 clones were exposed to a
filtered RNase-free DNase I-treated preparation of HIV-1
IIIBfor 90 min at 37°C, washed, and recultured. At various time
points postinfection (p.i.), aliquots of cells (10
5) were removed
and lysates were prepared for PCR analysis of HIV-1 DNA. In
the PCR method previously described by Zack et al. (63),
primer pairs were designed to detect certain steps of the
re-verse transcription process by using the accepted model for
reverse transcription of retroviral RNA. Amplification using
the R-U5 primer pair detects a DNA region representing
ini-tial reverse transcription, and nearly complete reverse
tran-scription is detected with the LTR-gag primer pair. The
sensi-tivity of the amplification was similar in T
H1 and T
H2 clones,
[image:4.612.53.547.72.304.2]equaling 5 to 10 copies of HIV DNA. As there is evidence that
HIV-1 virions can contain short transcripts and DNA (42, 60),
we used a heat-inactivated virus preparation as a control in all
infections. No signal was detected either in this control or in
FIG. 2. Flow cytometric analysis of a human TH1 clone and a human TH2 clone for cell surface expression of chemokine receptors. A total of 106cells of each of
the T-cell clones H1.5 and H2.25 were suspended in PBS containing 1% heat-inactivated human AB serum and 0.5% sodium azide and stained with phycoerythrin (PE)-labeled anti-CXCR2, -CXCR4, -CD4, or -CD44 or an isotype control labeled immunoglobulin G antibody. After staining, the cells were extensively washed and then fixed with 1% paraformaldehyde. The clones were analyzed on a FACStar Plus flow cytometer.
TABLE 3. Chemokine receptor expression by human TTx-specific T
H1 and T
H2 clones
aClone % Positive (mean channel fluorescence)
b
Control CXCR1 CXCR2 CXCR4 CCR1 CCR5
H1.1
4.2 (3.2)
3.5 (3.4)
88.9 (42.2)
98.7 (106.7)
43.5 (38.6)
55.3 (96.2)
H1.3
2.1 (4.3)
2.7 (4.4)
87.4 (37.8)
96.5 (118.7)
3.3 (5.6)
43.2 (94.1)
H1.15
5.6 (3.5)
ND
c6.7 (4.2)
97.4 (123.5)
49.6 (46.2)
64.7 (98.2)
H1.5
2.1 (3.2)
11.4 (3.6)
67.4 (54.2)
99.2 (114.2)
52.3 (37.2)
49.6 (76.4)
H2.5
1.4 (2.4)
2.2 (2.4)
78.9 (32.1)
97.6 (122.3)
ND
69.5 (96.2)
H2.25
3.2 (1.6)
3.2 (2.1)
84.3 (42.3)
98.9 (118.7)
39.8 (34.5)
54.3 (78.6)
H2.29
2.4 (2.6)
2.6 (2.2)
89.5 (45.7)
99.2 (123.4)
5.8 (3.6)
88.4 (97.2)
aA total of 106cells were suspended in PBS and stained with fluorescein isothiocyanate-labeled MAb to CXCR1, CXCR2, CXCR4, CCR1, or CCR5. After staining,
the cells were washed and then fixed with 1% paraformaldehyde. bAll were analyzed on a FACStar Plus flow cytometer. cND, not determined.
on November 9, 2019 by guest
http://jvi.asm.org/
[image:4.612.51.548.593.692.2]aliquots taken 90 min after HIV exposure (data not shown). By
24 h p.i., 2,000 to 5,000 copies of R-U5 and 100 to 500 copies
of LTR-gag DNA (Fig. 3) were seen. No significant differences
in copy number of R-U5 or LTR-gag DNA were observed
between T
H1 and T
H2 clones at 24 h (Fig. 3), indicating similar
levels of viral entry and reverse transcription in these
antigen-specific T
H1 and T
H2 clones.
Similar levels of replication by SI HIV strains in
antigen-activated T
Hcell clones.
Next, the ability of these clones to
support HIV replication in vitro was evaluated. Clones (
.
95%
viable following Ficoll-Hypaque separation) were infected
be-tween 4 and 7 days after antigen stimulation, using the specific
antigen and mitomycin C-treated autologous PBMC feeder
cells. Using two T-cell-tropic laboratory viral strains, BP1 (48)
and IIIB, all seven T
H1 and seven T
H2 clones released
sub-stantial amounts of extracellular p24 at days 7 and 14 p.i.
(Table 5). At day 7, for example, infected T
H1 and T
H2 clones
released similar levels of virus, with ranges of p24 being 22,500
to 47,500 pg/ml for T
H1 clones and 23,000 to 57,000 pg/ml for
T
H2 clones (Table 5). Furthermore, results obtained with
clones infected with the BP1 strain (Table 5, clones 1 to 7)
were indistinguishable from those obtained with clones
in-fected with the IIIB strain (Table 5, clones 8 to 14). Inin-fected
T
H1 cells (day 10 p.i.) maintained a T
H1 phenotype in that the
infected cultures were positive for IFN-
g
mRNA but not for
IL-4 mRNA; infected T
H2 cells remained IFN-
g
negative and
IL-4 mRNA positive (data not shown). By
fluorescence-acti-vated cell sorting analysis, for HIV-1 p24, the number of
pos-itive cells at day 7 ranged from 47 to 72%, with no differences
seen between infected T
H1 and T
H2 clones (data not shown).
In addition, the number of HIV gag RNA molecules per
microgram of total RNA was determined by using a dilution of
a standard number of RNA molecules determined as
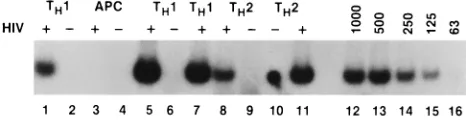
previ-ously described (64) (Fig. 4). At day 2 p.i. HIV-1-infected T
H1
cells had approximately 500 gag RNA molecules/
m
g of RNA
(Fig. 4, lane 1), while mitogen-stimulated mitomycin-treated
feeder cells expressed no viral RNA (Fig. 4, lane 3). At day 7,
a substantial number of gag RNA molecules were present in
both T
H1 and T
H2 clones (Fig. 4). To obtain more precise
numbers, the viral RNA was diluted to 1,000 to 2,000
mole-cules/reaction so that the signal obtained under the
amplifica-tion condiamplifica-tions used was in the linear range of the standard
curve. Using this approach, we determined that similar
num-bers of gag RNA molecules were present in different T
H1 and
T
H2 clones throughout the duration of the infection (Table 6).
Thus, although different clones varied two- to threefold in
number of mRNA molecules present (8,000 to 25,000
mole-cules/
m
g of RNA), neither the kinetics nor the magnitude of
HIV expression in T
H2 clones was significantly higher than in
T
H1 clones regardless of the viral isolate used to infect the
clones (Tables 5 and 6). We also investigated whether the
antigen specificity of the clones made a difference by
measur-ing RNA at day 7 p.i.; in the case of a SEB T
H1 and T
H2 clone,
there was little difference in number of viral RNA molecules
(9,500 versus 10,800).
[image:5.612.308.549.81.242.2]Since accelerated cell death has been seen in HIV-infected
T cells following in vitro stimulation (2, 24, 32, 39, 47, 59), it is
possible that if the data were based on input cell number, the
results could vary between clones. When the number of HIV
FIG. 3. HIV-1 DNA detection in TH1 and TH2 clones. Lysates were
pre-pared 24 h p.i. A primer pair was used to detect the earliest region of DNA formed by reverse transcription (141 bp of the minus strong-stop strand). An-other primer pair was used to detect full-length HIV-1 DNA (200 bp of LTR-gag). The sense primers of each pair were radiolabeled. Three different TH1
(H1.12, H1.15, and H1.18) and TH2 (H2.25, H2.29, and H2.33) clones shown for
[image:5.612.50.289.89.180.2]each infection are representative of three separate experiments. Tenfold serial dilutions of the ACH-2 cell line, containing one integrated copy of HIV-1 DNA per cell, were made in a background of uninfected T cells and shown for estimation of copy number.
FIG. 4. Analysis of HIV gag mRNA in HIV-infected TH1 and TH2 clones.
HIV infection of antigen-activated T-cell clones, RT-PCR analysis, and use of HIV gag RNA standards were performed as described in Materials and Methods. Cells were infected with HIVMN. Lanes 1 and 2, TH1 H1.15 with and without
HIV, day 2; lanes 3 and 4, mitogen-stimulated antigen-presenting cells (APC) with and without HIV, day 2; lanes 5 and 6, TH1 H1.15 with and without HIV,
day 7; lane 7, TH1 H1.12 with HIV, day 7; lanes 8 and 9, TH2 H2.29 with and
without HIV, day 7; lane 10, TH2 H2.29; lane 11, TH2 H2.29 with HIV, day 14;
[image:5.612.311.544.592.652.2]lanes 12 to 16, RNA standard curve.
TABLE 4. Similar numbers of cell surface chemokine binding sites
on human T
H1 and T
H2 clones
aChemokine H1.5 H2.25
Receptors/cell Kd(nM) Receptors/cell Kd(nM)
MIP-1
a
1,525
0.8
2,143
1.1
MIP-1
b
890
0.8
1,334
1.0
RANTES
2,156
0.6
3,420
0.7
MCP-1
1,325
0.8
2,132
0.9
MCP-3
3,467
1.2
4,786
0.9
IL-8
3,216
1.2
4,556
1.4
aBinding conditions for the CC chemokines MIP-1a, MIP-1b, RANTES, MCP-1, and MCP-3 and the CXC chemokine IL-8 were as described in Materials and Methods. The data were analyzed with the Biosoft RADLIG program.
TABLE 5. Replication of HIV-1 in human T
H1 and T
H2 clones
Clonea
Type specificityAntigen HIV p24 (pg/ml) b
No. Name Day 7 Day 14
1
A57.D4
T
H1
SEB
47,500
6
7.3
35,000
6
4.2
2
C01.D6
T
H1
SEB
31,500
6
2.4
34,000
6
4.3
3
B95.E1
T
H2
SEB
42,000
6
5.7
39,500
6
2.7
4
A057
T
H1
DP
27,000
6
3.1
34,000
6
1.9
5
D.D6
T
H1
PPD
22,500
6
1.5
27,000
6
3.3
6
A57.G1
T
H2
DP
57,000
6
8.1
42,000
6
5.1
7
57.D10
T
H2
DP
49,500
6
6.3
37,000
6
3.5
8
H1.15
T
H1
TTx
23,000
6
1.6
17,000
6
1.5
9
H1.12
T
H1
TTx
37,000
6
2.9
35,000
6
3.7
10
H1.18
T
H1
TTx
43,500
6
5.5
42,000
6
5.2
11
H2.25
T
H2
TTx
23,000
6
2.1
29,500
6
3.3
12
H2.29
T
H2
TTx
45,000
6
6.7
41,000
6
5.2
13
H2.33
T
H2
TTx
54,000
6
7.3
61,000
6
8.3
14
H2.18
T
H2
TTx
29,000
6
3.3
23,500
6
1.7
aT-cell clones were generated, maintained, and activated as described in Materials and Methods.
bClones were infected with either HIV-1
BP1(clones 1 to 7) or HIV-1IIIB
(clones 8 to 14) as described in Materials and Methods. At day 7, 80% of the medium was replaced with fresh growth medium and cell-free supernatants were used for HIV p24 assays (SEM [103] for triplicates of two experiments).
on November 9, 2019 by guest
http://jvi.asm.org/
[image:5.612.64.280.595.643.2]gag molecules per 10
5viable cells (measured by trypan blue
exclusion and Ficoll-Hypaque separation) was determined, the
infected T
H1 cells were found to contain roughly twofold more
RNA molecules than infected T
H2 clones (Table 7). In
addi-tion, when a T
H1 clone activated with either specific antigen or
PMA–anti-CD3 was infected with HIV, similar levels of
rep-lication were observed in this T
H1 clone (Table 7). Thus, even
when potential differences in cell viability or polyclonal
activa-tion are taken into account, we did not observe any
preferen-tial replication of HIV-1 in T
Hsubsets.
Infection of T
H1 and T
H2 clones by primary NSI HIV-1
strains.
The different tropism (primary macrophages and T
cells but not T-cell lines) of primary NSI strains from SI strains
suggested a possible difference in infecting different T-cell
clones. To investigate this, we infected three T
H1 and three
T
H2 clones highly susceptible to infection by laboratory SI
strains with four primary well-characterized NSI isolates. As
discussed earlier, amplification using the R-U5 primer pair
detects a DNA region representing initial reverse transcription
and nearly complete reverse transcription is detected with the
LTR-gag primer pair (Fig. 5). At 12 h p.i., the SF162 strain did
not show detectable viral entry in two of three clones of each
type, while the other three NSI strains showed equivalent
strong-stop DNA in each clone, with little variation between
T
H1 and T
H2 clones. At 7 days p.i., the amount of full-length
viral DNA present in the cells (Fig. 5) and the amount of
HIV-1 p24 in the supernatant (Table 8) show clear clonal
variations in ability to support viral infection. The T
H1 clones
H1.20 and H1.25 and the T
H2 clones H2.10 and H2.5
sup-ported vigorous replication with three of four NSI viral
iso-lates, while the T
H1 clone H1.15 and the T
H2 clone H2.33
poorly supported NSI viral replication (Table 8). There was
also variation between viral isolates, with SF162 being poorly
replicative in the four clones in which the three other NSI
viruses replicated well.
DISCUSSION
CD4
1T cells, the preferential targets of HIV-1, can be
divided into functional T
H1 and T
H2 subsets which are
respon-sible for initiating the immune response against different
classes of foreign invaders (14, 15, 50, 51, 57). Since alterations
in the T
H1 and T
H2 responses can increase microbial
patho-genesis, much effort has gone into determining the role of T
H1
and T
H2 cells and cytokines during HIV infection and their
relationship to HIV pathogenesis. Whether there is an
alter-ation in T
H1 and T
H2 responses during AIDS progression
remains controversial (3, 9–12, 31, 43–46, 49, 56).
One study by Maggi et al. (43) has suggested that HIV
repli-cates preferentially in T
H2 and T
H0 clones rather than T
H1 clones
in vitro. This concept could have major implications in AIDS
pathogenesis and has been incorporated in recent models of HIV
pathogenesis (11, 49, 56). As the kinetics and magnitude of a viral
infection can often be affected by the nature of virus-cell
interac-tions as well as extracellular environment, we examined HIV
infectivity in a panel of defined human T
Hcell clones derived
from different donors. Since cytokine secretion by T
Hcells is a
continuum and T
H2 and T
H1 subsets represent the polar ends of
the T
Hcell spectrum (36, 51, 55, 57), we used well-defined T
H1
clones (IFN-
g
1IL-4
2IL-5
2) and T
H
2 clones (IFN-
g
2IL-4
1IL-5
1) in this study. Neither mitogen (PMA–anti-CD3)
treat-ment nor HIV infection altered the cytokine patterns produced
by T
H1 and T
H2 clones.
We observed no significant differences between T
H1 and
T
H2 clones with respect to (i) the cell surface expression of
[image:6.612.49.291.82.172.2]CD4 and the chemokine receptor cofactors (both CXC and CC
classes), (ii) viral entry and reverse transcription (measured by
strong-stop and full-length HIV-1 DNA), and (iii) HIV
repli-cation (measured by release of HIV p24 and total number of
copies of gag RNA per total cell RNA). The results were
similar whether the virus used was a laboratory SI strain or a
primary NSI strain. In the case where a virus replicated poorly,
TABLE 6. Levels of HIV gag mRNA in T
H1 and T
H2 clones
Clonea Type Antigen
specificity
HIV gag RNA (mol/mg of RNA)b
Day 2 Day 5 Day 10
H1.15
T
H1
TTx
10,600
25,300
41,000
H1.12
T
H1
TTx
8,400
20,100
36,800
H1.18
T
H1
TTx
9,100
23,700
39,200
H2.25
T
H2
TTx
11,700
31,100
52,600
H2.29
T
H2
TTx
2,000
10,800
19,100
H2.33
T
H2
TTx
7,300
21,400
37,700
aDerivation, antigen activation, and HIV
IIIBinfection of T-cell clones were
performed as described in Materials and Methods.
bConstruction and use of an RNA standard and RT-PCR analysis are de-scribed in Materials and Methods. For quantitation of number of HIV gag mRNA molecules, the gel was scanned on a PhosphorImager (Molecular Dy-namics), using ImageQuant and Microsoft Excel programs, in comparison to a standard curve in a linear range on each gel. Viral samples were diluted to fall within the standard curve.
TABLE 7. Levels of HIV gag mRNA/10
5viable cells in T
H1 and
T
H2 clones after HIV-1 infection
Clonea Type Antigen
specificity
HIV gag RNA (mol/105viable cells)b
Day 7 Day 14
H1.19
T
H1
TTx
7,300
108,000
H1.19
T
H1
PMA–anti-CD3
8,400
205,000
H1.15
T
H1
TTx
12,700
231,000
H1.18
T
H1
TTx
9,700
196,000
H2.29
T
H2
TTx
4,600
87,000
H2.33
T
H2
TTx
5,300
95,000
H2.25
T
H2
TTx
3,800
79,000
aDerivation, antigen activation, and HIV
IIIBinfection of T-cell clones were
performed as described in Materials and Methods. The H1.19 clone was not previously described.
[image:6.612.308.549.89.180.2]bConstruction and use of an RNA standard and RT-PCR analysis are de-scribed in Materials and Methods. For quantitation of number of HIV gag mRNA molecules, the gel was scanned on a PhosphorImager (Molecular Dy-namics), using ImageQuant and Microsoft Excel programs, in comparison to a standard curve on each gel. Viable cells were separated by Ficoll-Hypaque density centrifugation.
TABLE 8. Replication of NSI HIV-1 strains in human T
H1 and
T
H2 clones
Clonea HIV p24 (pg/ml)b
No. Name SF162 US657 US714 US727
1 H1.20 30060.3 12,50061.3 15,20061.5 22,00062.3 2 H1.25 0 21,50061.7 29,70062.3 27,00063.3 3 H1.15 55060.5 42060.5 1,30061.0 60060.5 4 H2.10 2,10061.3 18,50061.7 21,00063.0 23,00062.7 5 H2.33 0 1,70060.7 2,20061.5 95060.3 6 H2.5 2,50061.3 23,00062.7 17,00061.7 34,50063.3 aT-cell clones were generated, maintained, and activated as described in Materials and Methods.
bClones were infected with the indicated viral isolates as described in Mate-rials and Methods. At day 7, cell-free supernatants were used for HIV p24 assays (SEM [103] for triplicates of two experiments).
on November 9, 2019 by guest
http://jvi.asm.org/
[image:6.612.49.290.546.652.2]it did so in both types of T
Hcells. Even though the amount of
gag mRNA molecules could be an overestimate due to the
presence of some viral genomic RNA, there is unlikely to be
significantly more genomic RNA in one subset than another.
Thus, we did not observe any preferential HIV infection of
activated T
H2 over T
H1 clones in vitro. In the production of
viral p24, additional parameters, such as the use of different
T-cell donors for cell cloning and the use of different antigenic
specificities, had no effect on the results. The presence of
substantial amounts of CD4, CD44 (21), and CCR5 (8, 16, 19,
20) on the cell surface of T
H1 and T
H2 clones used supports
the similar production seen with monocytotropic HIV-1 strains
and suggests these T-cell clones are more like primary T cells
(30, 63) than T-cell lines.
In using NSI strains of HIV to infect these clones, we found,
as previously reported, clonal variation in that some clones
would not support replication of these viruses (27, 44) very well
as well as variation in the ability of these viruses to replicate in
permissive clones. However, these differences were not
re-stricted to either T
H1 or T
H2 clones. Thus, there are not likely
to be any intrinsic differences in the ability of different types of
T-cell clones to support HIV-1 replication. However, there
could be many environmental reasons for differences in HIV
replication, such the amount of chemokines released (13, 22),
the absence of coreceptors on certain types of clones (41), and
the ability of immune stimulation to preferentially
downregu-late the CCR5 coreceptor (4, 7).
In the study by Maggi et al. (43) and other studies (34, 54, 57),
T
Hclones were activated by mitogens (such as PMA–anti-CD3),
as it was believed that cells express a more heterogeneous
cyto-kine pattern after mitogen activation than after antigen activation.
Therefore, mitogen stimulation would result in uncovering more
T
H0 clones. However, we did not find any difference between
antigen and mitogen activation on viral replication or cytokine
production in T
H1 clones. Indeed, our results are similar to those
of other studies which, when measuring cytokine production at
the single-cell level, found no qualitative differences in cytokine
profiles between antigen and mitogen stimulation (36, 54). In
addition, HIV-infected T
H1 and T
H2 clones still maintained the
same phenotype as measured by cytokine profile 10 days after
infection. Recent evidence that memory and naive CD4
1T cells
(precursors of both T
H1 and T
H2 cells) from HIV-infected
indi-viduals have similar rates of decline during AIDS progression (45,
46), and the ability to obtain high percentages of both T
H1 and
T
H2 clones from PBMCs of late-stage AIDS patients (43, 47, 56)
despite the daily loss and replacement of CD4
1T cells during
HIV infection (33, 62) makes it unlikely that there is preferential
infection of CD4
1T
H
cell subsets in vivo during AIDS
progres-sion.
Maggi et al. (43), who found no evidence for in vitro
infec-tion of T
H1 clones by HIV, examined only one time period (20
days p.i.) in their study. While the differences between the two
studies could be due to several factors (differences in
experi-mental design, differences in the panel of clones used, methods
of T-cell activation, etc.), the time point used to measure
HIV-1 production is close to the limit of T-cell clone survival
without further stimulation with antigen and feeder cells. Since
both infected and uninfected T cells from HIV-infected
indi-viduals undergo activation induced apoptosis in vitro (2, 24, 32,
39, 47, 59) probably through Fas-mediated killing (5, 18, 34, 35,
37, 53), one possible reason for the discrepancy between the
two studies is differential cell death of the infected T
H1 and
T
H2 clones. Differences in virus production in vitro at later
times of infection could be due to more rapid killing of one
subset. However, when values were normalized for viable cell
number, more gag RNA molecules were found in T
H1 cells.
These studies indicate that any role of T
H1 and T
H2 subsets in
AIDS pathogenesis transcends clonal differences in their
abil-ity to support HIV replication.
ACKNOWLEDGMENTS
We thank Bernard Poiesz for providing the HIV gag RNA standard
and Cari Petrow, Jason Troxell, and Anne Meyers for excellent
tech-nical assistance. The HIV primary isolates were obtained through the
AIDS Research and Reference Reagent Program, Division of AIDS,
NIAID, NIH.
REFERENCES
1. Aggarwal, B., and R. Puri (ed.). 1995. Human cytokines: their role in disease and therapy. Blackwell Science, Cambridge, Mass.
2. Ameisen, J. 1992. Programmed cell death and AIDS: from hypothesis to experiment. Immunol. Today 13:388–391.
3. Barcellini, W., G. Rizzardi, M. Borghi, C. Fain, A. Lazzarin, and P. Meroni. 1994. TH1 and TH2 cytokine production by peripheral blood mononuclear cells from HIV-infected patients. AIDS 8:757–762.
4. Bleul, C., L. Wu, J. Hoxie, T. Springer, and C. MacKay. 1997. The HIV coreceptors CXCR4 and CCR5 are differently expressed and regulated on human T lymphocytes. Proc. Natl. Acad. Sci. USA 94:1925–1930. 5. Brunner, T., R. Mogli, D. LaFace, N. Yoo, A. Mahboubi, F. Echeverri, S.
Martin, W. Force, D. Lynch, C. Ware, and D. Green.1995. Cell-autonomous Fas (CD95)/Fas-ligand interaction mediates activation-induced apoptosis in T-cell hybridomas. Nature 373:441–444.
6. Byrne, B., J. Li, J. Sninsky, and B. Poiesz. 1988. Detection of HIV RNA sequences by in vitro DNA amplications. Nucleic Acids Res. 16:4165. 7. Carroll, R., J. Riley, B. Levine, Y. Feng, S. Kaushal, D. Ritchey, W.
Bern-stein, O. Weislow, C. Brown, E. Berger, C. June, and D. St. Louis.1997. Differential regulation of HIV-1 fusion cofactor expression by CD28 co-stimulation of CD41T cells. Science 276:273–276.
8. Choe, H., M. Farzan, Y. Sun, N. Sullivan, B. Rollins, P. D. Ponath, L. Wu,
C. R. Mackay, G. LaRosa, W. Newman, N. Gerard, C. Gerard, and J. Sodroski. 1996. Theb-chemokine receptors CCR3 and CCR5 facilitate infection by primary HIV-1 isolates. Cell 85:1135–1148.
9. Clerici, M., and G. Shearer. 1993. A TH1-TH2 switch is a critical step in the
etiology of HIV infection. Immunol. Today 14:107–110.
10. Clerici, M., F. Hakim, D. Venzon, S. Blatt, C. Hendrix, T. Wynn, and G.
Shearer. 1993. Changes in interleukin-2 and interleukin-4 production in asymptomatic, human immunodeficiency virus-seropositive individuals. J. Clin. Invest. 91:759–765.
11. Clerici, M., and G. Shearer. 1994. The Th1-Th2 hypothesis of HIV infection: new insights. Immunol. Today 15:575–581.
12. Clerici, M., T. Wynn, J. Berzofsky, S. Blatt, C. Hendrix, A. Sher, R. Coffman,
[image:7.612.135.465.68.131.2]and G. Shearer.1994. Role of interleukin-10 in T helper cell dysfunction in asymptomatic individuals infected with human immunodeficiency virus. J. Clin. Invest. 93:768–775.
FIG. 5. HIV-1 DNA detection in TH1 and TH2 clones. Lysates were prepared at 10 and 24 h p.i. A primer pair was used to detect the earliest region of DNA formed
by reverse transcription (141 bp of the minus strong-stop strand). Another primer pair was used to detect full-length HIV-1 DNA (200 bp of LTR-gag) and human b-globin. The sense primers of each pair were radiolabeled. Two different TH1 (H1.20 and H1.25) and TH2 (H2.10 and H2.25) clones are shown. Lanes: A, control;
B, SF162 infection; C, US657; D, US714; E, US727. Tenfold serial dilutions of the ACH-2 cell line, containing one integrated copy of HIV-1 DNA per cell, were made in a background of uninfected T cells and shown for estimation of copy number.
on November 9, 2019 by guest
http://jvi.asm.org/
13. Cocchi, F., A. L. DeVico, A. Garzino-Demo, S. K. Arya, R. C. Gallo, and P.
Lusso.1995. Identification of RANTES, MIP-1a, and MIP-1bas the major HIV-suppressive factors produced by CD81T cells. Science 270:1811–1815.
14. Del Prete, G., M. De Carli, C. Mastromauro, D. Macchia, R. Biagiotti, M.
Ricci, and S. Romagnani.1991. Purified protein derivative of Mycobacterium tuberculosis and excretory-secretory antigen(s) of Toxocara canis expand in vitro human T cells with stable and opposite (type 1 T helper or type 2 T helper) profile of cytokine production. J. Clin. Invest. 88:346–352. 15. Del Prete, G., and S. Romagnani. 1994. The role of TH1 and TH2 subsets in
human infectious diseases. Trends Microbiol. 2:4–6.
16. Deng, H., R. Liu, W. Ellmeier, S. Choe, D. Unutmaz, M. Burkhart, P.
Marzio, S. Marmon, R. Sutton, C. Hill, C. Davis, S. Peiper, T. Schall, D. Littman, and N. Landau.1996. Identification of a major co-receptor for primary isolates of HIV-1. Nature 381:661–666.
17. Derse, D., J. Mikovits, M. Polianova, B. K. Felber, and F. Ruscetti. 1995. Virions released from cells transfected with a molecular clone of human T-cell leukemia virus type I give rise to primary and secondary infections of T cells. J. Virol. 69:1907–1912.
18. Dhein, J., H. Walczak, C. Baumler, K. Debatin, and P. Krammer. 1995. Autocrine T-cell suicide mediated by APO-1/(Fas/CD95). Nature 373:438–441. 19. Doranz, B., J. Rucker, Y. Yi, R. Smyth, M. Samson, S. Peiper, M.
Parmen-tier, R. Collman, and R. Doms.1996. A dual-tropic primary HIV-1 isolate that uses fusin and theb-chemokine receptors CKR-5, CKR-3 and CKR-2b as fusion cofactors. Cell 85:1149–1158.
20. Dragic, T., V. Litwin, G. Allaway, S. Martin, Y. Huang, K. Nagashima, C.
Cayanan, P. Maddon, R. Koup, J. Moore, and W. Paxton.1996. HIV-1 entry into CD41cells is mediated by the chemokine receptor CC-CKR-5. Nature 381:667–673.
21. Dukes, C., Y. Yu, E. Rivadeneira, D. Sauls, D. H.-X. Liao, B. Haynes, and J.
Weinberg.1995. Cellular CD44S as a determinant of human immunodefi-ciency virus type 1 infection and cellular tropism. J. Virol. 69:4000–4005. 22. Fauci, A. 1996. Host factors and the pathogenesis of HIV-induced disease.
Nature 384:529–534.
23. Feng, T., C. C. Broder, P. E. Kennedy, and E. A. Berger. 1996. HIV-1 entry cofactor: functional cDNA cloning of a seven-transmembrane, G protein-coupled receptor. Science 272:872–877.
24. Finkel, T., G. Tudor-Williams, N. Banda, M. Cotton, T. Curiel, C. Monks, T.
Baba, R. Ruprecht, and A. Kupfer.1995. Apoptosis occurs predominately in bystander cells and not in productively infected cells of HIV- and SIV-infected lymph nodes. Nat. Med. 1:129–134.
25. Fitch, F., and T. Gajewski. 1991. Production of T cell clones, p. 3.13.1–3.13.9. In J. Coligan, A. Kruisbeek, D. Margulies, E. Shevach, and W. Strober (ed.), Current protocols in immunology. John Wiley & Sons, Inc., New York, N.Y. 26. Folks, T., D. Powell, M. Lightfoote, S. Benn, M. Martin, and A. Fauci. 1986. Induction of HTLV-III/LAV from a non-virus producing T cell line: impli-cations for latency. Science 231:600–602.
27. Fouchier, R., L. Meyaard, M. Brouwer, E. Hovenkamp, and H.
Schuite-maker.1996. Broader tropism and higher cytopasticity for CD41T cells of a syncytium-inducing compared to a non-syncytium-inducing HIV-1 isolate as a mechanism for accelerated CD41T cell decline in vivo. Virology
291:87–95.
28. Gajewski, T. F., D. W. Lancki, R. Stack, and F. W. Fitch. 1994. “Anergy” of TH0 helper T lymphocytes induces downregulation of TH1 characteristics
and a transition to a TH2-like phenotype. J. Exp. Med. 179:481–491.
29. Gendelman, H., R. Friedman, S. Joe, L. Baca, J. Turpin, G. Dveksler, M.
Meltzer, and C. Dieffenbaker.1990. A selective defect of interferon-alpha production in human immunodeficiency virus-infected monocytes. J. Exp. Med. 172:1433–1440.
30. Granelli-Piperno, A., B. Mose, M. Pope, D. Chen, Y. Wei, F. Isdell, U.
O’Doherty, W. Paxton, R. Koup, S. Mojsov, N. Bhardwaj, I. Clark-Lewis, M. Baggiolini, and R. M. Steinman.1996. Efficient interaction of HIV-1 with purified dendritic cells via multiple chemokine coreceptors. J. Exp. Med.
184:2433–2438.
31. Graziosi, C., G. Pantaleo, K. Gantt, J. Fortin, J. Demarest, O. Cohen, R.
Sekaly, and A. Fauci.1994. Lack of evidence for the dichotomy of TH1 and
TH2 predominance in HIV-infected individuals. Science 265:248–252.
32. Groux, H., G. Torpier, D. Monte, Y. Mouton, A. Capron, and J. Ameisen. 1992. Activation-induced death by apoptosis in CD41T cells from human
immunodeficiency virus-infected asymptomatic individuals. J. Exp. Med.
175:331–340.
33. Ho, D., A. Neumann, A. Perelson, W. Chen, J. Leonard, and M. Markowitz. 1995. Rapid turnover of plasma virions and CD4 lymphocytes in HIV-1 infection. Nature 373:123–126.
34. Ju, S.-T., D. Panka, H. Cul, R. Ettinger, M. El-Khatib, D. Sherr, B. Stanger,
and A. Marshak-Rothstein.1995. Fas(CD95)/FasL interactions required for programmed cell death after T-cell activation. Nature 373:444–448. 35. Katsikis, P. D., E. S. Wunderlich, C. A. Smith, L. A. Herzenberg, and L. A.
Herzenberg.1995. Fas antigen stimulation induces marked apoptosis of T lymphocytes in human immunodeficiency virus-infected individuals. J. Exp. Med. 181:2029–2036.
36. Kelso, A. 1995. Th1 and Th2 subsets: paradigms lost? Immunol. Today
16:374–379.
37. Kobayashi, N., Y. Hamamoto, N. Yamamoto, A. Ishii, M. Yonehara, and S.
Yonehara.1990. Anti-Fas monoclonal antibody is cytocidal to human immu-nodeficiency virus-infected cells without augmenting viral replication. Proc. Natl. Acad. Sci. USA 87:9620–9624.
38. Lapham, C. K., J. Ouyang, B. Chandrasekhar, N. Y. Nguyen, D. S. Dimitrov,
and H. Golding.1996. Evidence for cell-surface association between fusin and the CD4-gp120 complex in human cell lines. Science 274:602–605. 39. Laurent-Crawford, A., B. Krust, S. Muller, Y. Riviere, M. Cuille, J. Bechet,
L. Montanier, and A. Hovanessian.1991. The cytopathic effect of HIV is associated with apoptosis. Virology 185:829–839.
40. Levy, J. 1993. HIV pathogenesis and long-term survival. AIDS 7:1401–1410. 41. Loetscher, P., M. Uguccioni, L. Bondoli, M. Baggiolini, B. Moser, C.
Chiz-zolini, and J. Dayer.1998. CCR5 is characteristic of Th1 lymphocytes. Na-ture 391:344–345.
42. Lori, F., F. Veronese, A. Del Vico, P. Lusso, M. Reitz, and R. Gallo. 1992. Viral DNA carried by human immunodeficiency virus type 1 virions. J. Virol.
66:5067–5074.
43. Maggi, E., M. Mazzetti, A. Ravina, F. Annunziato, M. De Carli, M. Piccinni,
R. Manetti, M. Carbonari, A. Pesce, G. Del Prete, and S. Romagnani.1994. Ability of HIV to promote a Th1 to Th0 shift and to replicate preferentially in Th2 and Th0 cells. Science 265:244–248.
44. Meyaard, L., R. Fouchier, M. Brouwer, E. Hovenkamp, and F. Miedema. 1996. Syncytium-inducing HIV-1 replicate equally well in all types of T-helper cell clones. AIDS 10:1598–1600.
45. Meyaard, L., E. Hovenkamp, I. P. M. Keet, B. Hooibrink, I. H. deJong, S. A.
Otto, and F. Miedema.1996. Single-cell analysis of IL-4 and IFN-g produc-tion by T cells from HIV-infected individuals. J. Immunol. 157:2712–2718. 46. Meyaard, L., S. Otto, B. Hooibrink, and F. Miedema. 1994. Quantitative
analysis of CD41T cell function in the course of human immunodeficiency virus infection. J. Clin. Invest. 94:1947–1952.
47. Meyaard, L., S. Otto, R. Jonker, M. Mijnster, R. Keet, and F. Miedema. 1992. Programmed death of T cells in HIV-1 infection. Science 257:217–219. 48. Mikovits, J., Raziuddin, M. Gonda, M. Ruta, N. Lohrey, H.-F. Kung, and F.
Ruscetti.1990. Negative regulation of human immune deficiency virus rep-lication in monocytes. J. Exp. Med. 171:1705–1720.
49. Mosmann, T. 1994. Cytokine patterns during the progression to AIDS. Science 265:193–194.
50. Mosmann, T., H. Cherwinski, M. Bond, M. Giedlin, and R. Coffman. 1986. Two types of murine helper T-cell clones. I. Definition according to profiles of lymphokine activities and secreted proteins. J. Immunol. 136:2348–2355. 51. Mosmann, T., and R. Coffman. 1989. TH1 and TH2 cells: different patterns of lymphokine secretion lead to different functional properties. Annu. Rev. Immunol. 7:145–173.
52. Murphy, W., Z. Tian, O. Asai, R. Strieter, S. Kunkel, D. L. Longo, and D.
Taub.1996. Chemokines and lymphocyte activation. II. Facilitation of hu-man cell trafficking in severe combined immunodeficiency mice. J. Immunol.
156:2104–2111.
53. Nagata, S., and P. Golstein. 1995. The Fas death factor. Science 267:1449– 1456.
54. Openshaw, P., E. Murphy, N. Hosken, V. Maino, K. Davis, K. Murphy, and
A. O’Garra.1995. Heterogeneity of intracellular cytokine synthesis at the single cell in polarized T helper 1 and T helper 2 populations. J. Exp. Med.
182:1357–1367.
55. Romagnani, S. 1991. Human TH1 and TH2: doubt no more. Immunol. Today 12:256–261.
56. Romagnani, S., E. Maggi, and G. Del Prete. 1994. An alternative view of the Th1/Th2 switch hypothesis in HIV infection. AIDS Res. Hum. Retroviruses
10:iii–ix.
57. Swain, S. 1994. Generation and in vivo persistence of polarized TH1 and TH2
memory cells. Immunity 1:543–552.
58. Taub, D. D., A. Lloyd, J. M. Wang, and J. Oppenheim. 1995.a andb chemokines, p. 6.12.1–6.12.28. In J. Coligan, A. Kruisbeek, D. Margulies, E. Shevach, and W. Strober (ed.), Current protocols in immunology. John Wiley & Sons, Inc., New York, N.Y.
59. Terai, C., R. Kornbluth, R. C. Pauza, D. Richman, and D. Carson. 1991. Apoptosis as a mechanism of cell death in cultured T lymphoblasts acutely infected with HIV-1. J. Clin. Invest. 87:1710–1715.
60. Trono, D. 1992. Partial reverse transcripts in virions from human immuno-deficiency and murine leukemia viruses. J. Virol. 66:4893–4900.
61. Wang, J. M., D. McVicar, J. Oppenheim, and D. Kelvin. 1993. Identification of RANTES receptors on human monocytic cells: competition for binding and desensitization by homologous chemotactic cytokines. J. Exp. Med.
177:699.
62. Wei, X., S. Ghosh, M. Taylor, V. Johnson, E. Emini, P. Deutsch, J. Lifson, S.
Bonhoeffer, M. Nowak, B. Hahn, M. Saag, and G. Shaw.1995. Viral dynam-ics in human immunodeficiency virus type 1 infection. Nature 373:117–122. 63. Zack, J. A., S. J. Arrigo, S. R. Weitsman, A. S. Go, A. Haislip, and I. S. Chen. 1990. HIV-1 entry into quiescent primary lymphocytes: molecular analysis reveals a labile, latent viral structure. Cell 61:213–222.
64. Zhang, H., Y. Zhang, T. Spicer, L. Abbott, M. Abbott, and B. Poiesz. 1993. Reverse transcription takes place within extracellular HIV-1 virions: poten-tial biological significance. AIDS Res. Hum. Retroviruses 9:1287–1296.