City, University of London Institutional Repository
Citation
:
Bernardi, M., Leonard, H.C., Hill, E. L. and Henry, L. (2016). Brief report: Response inhibition and processing speed in children with motor difficulties and developmental coordination disorder. Child Neuropsychology, 22(5), pp. 627-634. doi: 10.1080/09297049.2015.1014898This is the accepted version of the paper.
This version of the publication may differ from the final published
version.
Permanent repository link:
http://openaccess.city.ac.uk/6707/Link to published version
:
http://dx.doi.org/10.1080/09297049.2015.1014898Copyright and reuse:
City Research Online aims to make research
outputs of City, University of London available to a wider audience.
Copyright and Moral Rights remain with the author(s) and/or copyright
holders. URLs from City Research Online may be freely distributed and
linked to.
City Research Online: http://openaccess.city.ac.uk/ [email protected]
1
Running Head: RESPONSE TIMING AND DCD
Brief Report: Response inhibition and processing speed in children with motor
difficulties and developmental coordination disorder
Marialivia Bernardia*, Hayley C. Leonardb*, Elisabeth L. Hillb* & Lucy A. Henrya*
a
Division of Language and Communication Science, City University London, UK
b
Department of Psychology, Goldsmiths, University of London, UK
Acknowledgements: This work was supported by The Waterloo Foundation under grant
1121/ 1555, awarded to L. Henry at London South Bank University. We would like to thank
all of the children, parents, teachers, headteachers and classroom assistants who kindly
assisted with this project, as well as The Dyspraxia Foundation for providing help with
recruitment. We are grateful for the assistance of Hanna Adeyinka, Helen Baker and Jacki
Rutherford in collecting and inputting data, and Mark Mon-Williams, Sarah Astill, Rachel
Coates and Oscar Giles at the University of Leeds for providing testing space and support for
the research.
*Joint first authors.
Corresponding author:
Marialivia Bernardi
Division of Language and Communication Science
City University London
London, EC1V 0HB
United Kingdom
Email: [email protected]
2
Running Head: RESPONSE TIMING AND DCD
Brief Report: Response inhibition and processing speed in children with motor
3
Abstract
A previous study reported that children with poor motor skills, classified as
having motor difficulties (MD) or Developmental Coordination Disorder (DCD), produced
more errors in a motor response inhibition task compared to typically-developing (TD)
children, but did not differ in verbal inhibition errors. The present study investigated whether
these groups differed in the length of time they took to respond in order to achieve these
levels of accuracy, and whether any differences in response speed could be explained by
generally slow information processing in children with poor motor skills. Timing data from
the Verbal Inhibition Motor Inhibition test were analyzed to identify differences in
performance between the groups on verbal and motor inhibition, as well as on processing
speed measures from standardized batteries. Although children with MD and DCD produced
more errors in the motor inhibition task than TD children, the current analyses found that
they did not take longer to complete the task. Children with DCD were slower at inhibiting
verbal responses than TD children, while the MD group seemed to perform at an intermediate
level between the other groups in terms of verbal inhibition speed. Slow processing speed did
not account for these group differences. Results extended previous research into response
inhibition in children with poor motor skills by explicitly comparing motor and verbal
responses, and suggesting that slow performance, even when accurate, may be attributable to
an inefficient way of inhibiting responses, rather than slow information processing speed per
se.
KEYWORDS: Response inhibition, processing speed, motor difficulties, Developmental
Coordination Disorder, executive functioning
4
Brief Report: Response inhibition and processing speed in children with motor
difficulties and developmental coordination disorder
Developmental Coordination Disorder (DCD) occurs in between 1.8-6% of the
population (Lingam, Hunt, Golding, Jongmans, & Emond, 2009; American Psychiatric
Association: APA, 2013). It is defined by motor impairment that has an impact on activities
of daily living and academic achievement that is not better explained by intellectual disability
or an underlying neurological condition (APA, 2013).
Executive functions (EFs) have been investigated as possible neurocognitive
mechanisms underlying the difficulties experienced by individuals with DCD. EF
encompasses a cluster of higher order cognitive skills including response inhibition (RI), which refers to the ability to intentionally suppress dominant, automatic, prepotent responses
to successfully complete a task (Nigg, 2000). Previous studies on RI in children with DCD
have reported that even when accuracy of performance is typical, the speed of task
completion is slower in children with DCD compared to typically-developing (TD) controls
(Mandich, Buckolz, & Polatajko, 2002; Piek, Dyck, Francis, & Conwell, 2007; Querne et al.,
2008). However, these studies have used measures of RI that involve a degree of motor
demand (e.g., pressing a button), which may influence performance in individuals with
impaired motor skills.
Leonard, Bernardi, Hill, and Henry (in press) assessed children screened for motor
difficulties (MD), children with DCD, and TD peers on five different EF domains, including
RI. The MD group were included to provide a ‘purer’ group of children with motor
impairments, without the higher rate of co-occurring conditions or symptoms of other
5
Wilmut, 2010). The inclusion of both the DCD and MD groups within one study also
addressed the issue of comparing results across studies using different sampling procedures.
To investigate RI in equivalent tasks with varying levels of motor demands, Leonard et al. (in
press) used the total number of errors in the Verbal Inhibition Motor Inhibition test (VIMI;
Henry, Messer, & Nash, 2012) as a measure of RI. They reported significantly higher errors
on the motor task by the DCD and MD groups compared to TD children, but no differences
on the verbal task. However, it remains possible that children with impaired motor skills
demonstrate poorer RI in terms of time taken to respond, despite producing similar numbers
of errors. The first aim of the current study was to investigate speed of performance in motor
and verbal RI tasks in children with DCD and MD, with the hypothesis that both groups
would take longer to inhibit responses compared to TD children.
Studies reporting slower inhibition performance in children with DCD often observe
longer reaction times on trials in which the inhibition of a response is not required (e.g., Go
trials on the Go-NoGo task; Querne et al., 2008), and other studies of simple reaction time
have reported prolonged latency in children with DCD (Henderson, Rose, & Henderson,
1992; Piek & Skinner, 1999). This may indicate a processing speed deficit, suggesting that
longer completion times on RI tasks reflect general inability to process information at an
adequate speed, rather than inhibition impairments. The second aim of the current study was
to determine the impact of processing speed on completion times in RI tasks in children with
DCD and MD. It was expected that children with DCD would be slower than TD children at
processing information, while the investigation of processing speed in the MD group was
6
Method
The data presented here are drawn from a larger study of EF in children with MD and
DCD, and full details of the participants, measures and procedures used in the original study
are provided in Leonard et al. (in press).
Participants were 91 children aged 7-11 years, split into three groups based on clinical
diagnoses and their performance on the Movement Assessment Battery for Children
(MABC-2; Henderson, Sugden, & Barnett, 2007), a standardized measure of motor ability. The
MABC-2 provides a Total Score, which can be converted to a standard score (M=10, SD=3)
and a percentile. Participants in the DCD group had a diagnosis from a qualified professional,
corroborated by the research team, and all scored at or below the 16th percentile on the
MABC-2. This cut-off was also used to classify children in the MD group, who were
screened for motor impairments but had no diagnosis of DCD. Children were classified as
having typical motor skills if they scored at or above the 25th percentile on the MABC-2.
Children with diagnoses of any neurodevelopmental disorder were not included in the
MD and TD groups, and no additional diagnoses were present in the DCD group (including
Attention Deficit-Hyperactivity Disorder (ADHD), which often co-occurs with DCD
(Pitcher, Piek & Hay, 2003), and could have impacted RI performance in the current study).
However, the DCD group had poorer reading scores and were reported to have increased
levels of inattention / hyperactivity symptoms in comparison to their peers. These variables
were, therefore, controlled in the analyses. All participants completed a large battery of EF
tasks and a number of standardized background measures, and parents completed
7
university or at their own home (DCD group), while MD and TD groups were tested over
several sessions in a quiet room in the child’s school.
Hierarchical multiple regression analyses, using group comparisons as dummy
variables, were conducted to explore group differences on the tasks of interest. Predictors
included in Step 1 of each regression model were chronological age, IQ (British Abilities
Scales: BAS-3; Elliot & Smith, 2011), reading ability (Test of Word Reading Efficiency:
TOWRE; Torgensen, Wagner, & Rashotte, 1999), and parent-reported
hyperactivity/attentional difficulties (Strengths and Difficulties Questionnaire: SDQ;
Goodman, 1997). Group comparisons (MD vs. TD, DCD vs. TD) were included in Step 2.
The dependent variables were total completion times or mean latencies of tasks measuring
verbal and nonverbal response inhibition (verbal and motor VIMI tasks, respectively), and
processing speed, using the Motor Screening (MScr) and Big Circle Little Circle (BLC) tasks (Cambridge Neuropsychological Test Automated Battery: CANTAB; Cambridge Cognition,
2006), and Visual Scanning (VS) and Motor Speed (MSp) tasks (Trail-Making; Delis-Kaplan
Executive Function System: D-KEFS; Delis, Kaplan, & Kramer, 2001).
In the VIMI, the experimenter produced one of two hand gestures (a pointed
finger/fist: motor task), or one of two words (“car”/“doll”: verbal task), and the participant
was required to copy the gesture/word, or produce the alternative one, depending on whether
the block included ‘copy’ or ‘inhibit’ trials. Twenty copy trials were followed by 20 inhibit
trials, with the sequence repeated such that a total of 80 trials was administered. These 80
trials were then repeated with a second set of gestures/words (hand facing the experimenter /
facing the table, or “bus”/“drum”). Each block of 20 trials was timed, and the sum of these
8
Time measure for each task. Children were instructed to respond as quickly as possible, but
to prioritize accuracy over speed.
In the processing speed tasks, participants were required to respond as quickly as
possible to a number of different stimuli: the MScr task required them to touch the center of a
cross appearing at different positions on a touchscreen; the BLC task required them to touch
either a big or a small circle presented next to each other in the center of the screen; the VS
task required them to find and cross out the 24 examples of the number ‘3’ presented
amongst a visual array of 54 numbers and letters on an A3 piece of paper; the MSp tasks
required them to draw a trail over a dotted line on the paper. Mean latencies of response
times were calculated and scored by the computer program for the touchscreen tasks, while
the total time taken to complete each of the paper tasks was recorded by hand. Descriptive
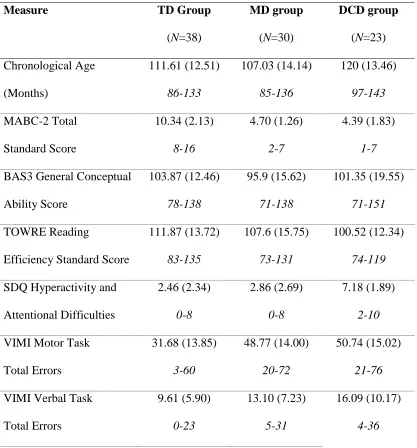
data for all measures are presented in Table 1.
---Table 1 about here---
Results and Discussion
Since some of the timing measures providing the dependent variables for the analyses
were not normally distributed, bootstrapping was performed on the data (see Leonard et al.,
in press, for details). The six hierarchical regression models met all other assumptions, and
Bonferroni corrections were applied to the final models (p<.008). Multiple regressions are reported in Table 2.
9
While there were no significant group differences in completion times on the motor
VIMI task, the final regression model was significant, F(6,80)=7.99, p<.001. It accounted for 33% of the variance, with only age and IQ emerging as significant predictors. Given the
difficulties that children with both DCD and MD demonstrated in performing accurately on
this motor RI task (Leonard et al., in press) it was unexpected that they did not take
significantly longer than their TD peers to complete the task. One explanation may be that the
considerable motor demands of the task discouraged these children from attempting to
perform well, and they did not take the extra time that they may have required to successfully
inhibit the motor response.
In the verbal VIMI task, the final regression model predicted more than 40% of the
variance in performance, F(6,80)=11.92, p<.001, and children with DCD took significantly
longer than TD children to complete the task (p=.002), despite similar accuracy between
groups (see Leonard et al., in press). This result is consistent with previous research
measuring RI which reported slower response times in children with DCD than TD children,
even when responses were as accurate (Piek et al., 2007; Querne et al., 2008). It is possible
that children with DCD were slower to respond in the verbal task because the effort of
producing a word requires some level of motor control. However, a previous study reported
that DCD and TD children did not differ in the duration of movements for single syllable
words, such as those used in the current study (Ho & Wilmut, 2010), and thus this is an
unlikely explanation for the current results. In the MD group, verbal completion times were
not significantly different from the TD group, although a trend was identified (p=.054). It may be that the MD group was performing at an intermediate level between the TD and DCD
10
understand whether this is the case, or whether the non-significant trend in the MD group is
due to a lack of power.
Children with DCD may take longer to execute most tasks, regardless of the skills
required, because they are slower at processing information. In order to understand the
relationships between processing speed and completion time on RI tasks, further regressions
assessing group differences were conducted on each of the four processing speed measures.
The final regression models for three of these measures, MScr, MSp and BLC, were not
significant (ps>.05), providing no evidence for group differences1. For the VS task, the final regression model predicted 25% of the variance in performance, F(6,80)=5.81, p<.001. Age
was a significant predictor (p=.001), and the DCD group took significantly longer to
complete the VS task compared to the TD group (p=.007).
What might differentiate the VS task from the other processing speed measures? The
VS task involves considerable visuo-spatial demands, and children with DCD may be slower
at completing the task because of difficulties in processing visuo-spatial information; such
problems are often observed in this group (Wilson & McKenzie, 1998). The result is also
consistent with previous research reporting slower visual inspection time in children with
DCD (Piek et al., 2007). It remains possible, therefore, that group differences in RI time on
the VIMI verbal task could be accounted for by slower processing speed. To account for the
group differences in VS, an exploratory regression analysis of verbal RI times was
conducted, which included VS completion time as an additional control variable in Step 1.
The regression model was significant, F(7,79)=10.58, p<.001, accounting for 48% of the variance. Importantly, children with DCD remained significantly slower than TD children at
11
RI task in children with DCD.
To conclude, children with DCD were as accurate as TD children in completing a
verbal RI task, yet took significantly longer to do so. Individuals with MD, but no clinical
diagnosis, did not demonstrate any significant difference from TD children although they
seemed to respond at an intermediate time between the TD and DCD groups on this task.
Therefore, the ability of children with MD to inhibit verbal responses needs to be further
investigated in future studies with larger samples. In the DCD group, it seems likely that the
verbal RI ‘slowing’ reflects inefficiency with the process of inhibiting a response, such that
typical levels of accuracy can only be obtained at the expense of very slow and careful
responding. This hypothesis is consistent with neuroimaging evidence reporting differences
between children with and without DCD in the neural network pathways underlying RI
(Querne et al., 2008), with a more effortful response suggested in DCD. It may be that these
different and more effortful neural responses contribute to the slower RI seen in the current
12
References
American Psychiatric Association (2013). Diagnostic and Statistical Manual of Mental
Disorders, 5th ed.. Arlington: Author.
Bishop, D.V.M. (2002). Motor immaturity and specific speech and language impairment:
Evidence for a common genetic basis. American Journal of Medical Genetics
(Neuropsychiatric Genetics), 114, 56-63.
Cambridge Cognition (2006). The Cambridge Neuropsychological Test Automated Battery
(CANTAB®): Test–retest reliability characteristics. Cambridge: Author.
Delis, D. C., Kaplan, E. & Kramer, J. H. (2001). Delis-Kaplan Executive Function System (D-KEFS). London: Psychological Corporation.
Elliot, C. D., & Smith, P. (2011). British Ability Scales, 3rd ed.. London: GL Assessment.
Goodman, R. (1997). The strengths and difficulties questionnaire: a research note. Journal of
Child Psychology and Psychiatry, 38, 581-586.
Henderson, L., Rose, P., & Henderson, S. (1992). Reaction time and movement time in
children with a Developmental Coordination Disorder. Journal of Child Psychology
and Psychiatry, 33, 895-905.
Henderson, S. E., Sugden, D. A., & Barnett, A. L. (2007). Movement Assessment Battery for
Children, 2nd ed.. London: The Psychological Corporation.
Henry, L.A., Messer, D.J., & Nash, G. (2012). Executive functioning in children with
specific language impairment. Journal of Child Psychology and Psychiatry, 53,
37-45.
Ho, A., & Wilmut, K. (2010). Speech and oro-motor function in children with Developmental
13
Leonard, H., Bernardi, M., Hill, E., & Henry, L. (In press). Executive functioning, motor
difficulties and Developmental Coordination Disorder. Developmental
Neuropsychology.
Lingam, R., Hunt, L., Golding, J., Jongmans, M., & Emond, A. (2009). Prevalence of
developmental coordination disorder using the DSM-IV at 7 years of age: A UK
population-based study. Pediatrics, 123, e693-e700.
Mandich, A., Buckolz, E., & Polatajko, H. (2002). On the ability of children with
developmental coordination disorder (DCD) to inhibit response initiation: The Simon
effect. Brain and Cognition, 50, 150-162.
Nigg, J. T. (2000). On inhibition/disinhibition in developmental psychopathology: views
from cognitive and personality psychology and a working inhibition taxonomy.
Psychological Bulletin, 126, 220-246.
Piek, J.P., Dyck, M.J., Francis, M., & Conwell, A. (2007). Working memory, processing
speed, and set-shifting in children with developmental coordination disorder and
attention-deficit-hyperactivity disorder. Developmental Medicine and Child
Neurology, 49, 678-683.
Piek, J. P., & Skinner, R. A. (1999). Timing and force control during a sequential tapping
task in children with and without motor coordination problems. Journal of the
International Neuropsychological Society, 5, 320-329.
Pitcher, T. M., Piek, J. P. & Hay, D. A. (2003). Fine and gross motor ability in males with
ADHD. Developmental Medicine & Child Neurology, 45, 525-35
Querne, L., Berquin, P., Vernier-Hauvette, M. P., Fall, S., Deltour, L., Meyer, M. E., & De
Marco, G. (2008). Dysfunction of the attentional brain network in children with
14
Torgensen, J., Wagner, R., & Rashotte, C. (1999). Test of word reading efficiency (TOWRE).
Austin: TX, Pro-Ed.
Wilmut, K. (2010). Selection and assessment of children with Developmental Coordination
Disorder. Developmental Medicine & Child Neurology, 52, 229.
Wilson, P.H., & McKenzie, B.E. (1998). Information processing deficits associated with
developmental coordination disorder: A meta-analysis of research findings. Journal of
15 Table 1
Mean, (standard deviation) and range for total errors and completion times for the Verbal
Inhibition Motor Inhibition test (VIMI), completion times for Visual Scanning and Motor
Speed, and latencies for Motor Screening and Big Circle, Little Circle. Descriptives are also
provided for the chronological age and Movement ABC-2 (MABC-2) total standard scores
for each group, as well as scores on the measures used as predictors in the analyses, namely
the British Abilities Scales (BAS-3), the Test of Word Reading Efficiency (TOWRE), and the
Hyperactivity/Inattention scale on the Strengths and Difficulties Questionnaire (SDQ).
Measure TD Group
(N=38)
MD group
(N=30)
DCD group
(N=23) Chronological Age (Months) 111.61 (12.51) 86-133 107.03 (14.14) 85-136 120 (13.46) 97-143 MABC-2 Total Standard Score 10.34 (2.13) 8-16 4.70 (1.26) 2-7 4.39 (1.83) 1-7
BAS3 General Conceptual
Ability Score 103.87 (12.46) 78-138 95.9 (15.62) 71-138 101.35 (19.55) 71-151 TOWRE Reading
Efficiency Standard Score
111.87 (13.72) 83-135 107.6 (15.75) 73-131 100.52 (12.34) 74-119
SDQ Hyperactivity and
Attentional Difficulties 2.46 (2.34) 0-8 2.86 (2.69) 0-8 7.18 (1.89) 2-10
VIMI Motor Task
Total Errors 31.68 (13.85) 3-60 48.77 (14.00) 20-72 50.74 (15.02) 21-76
VIMI Verbal Task
16
VIMI Motor Task
Total Completion Time (s)
297.18 (30.73) 257-411 311.63 (27.60) 256-362 322.78 (39.80) 264-422
VIMI Verbal Task
Total Completion Time (s)
214.21 (25.89) 172-322 239.90 (38.11) 194-371 247.17 (31.18) 199-328 D-KEFS
Visual Scanning Task (s)
28.92 (8.46) 18-54 32.70 (8.21) 17-48 38.61 (12.95) 20-65 D-KEFS
Motor Speed Task (s)
37.29 (14.51) 17-81 45.03 (19.62) 17-87 42.0 (17.23) 21-92 CANTAB Motor
Screening Task (ms)
752.66 (186.78) 503.0-1339.3 855.72 (191.96) 543.0-1285.0 767.91 (125.67) 586.78-1277.18
CANTAB Big /Little
Circle Task (ms)
715.25 (127.53) 521.45-1088.15 770.36 (165.73) 531.72-1325.91 789.79 (168.68) 586.78-1277.18
Note. TD=Typically-Developing, MD=Motor Difficulties, DCD=Developmental
Coordination Disorder, CANTAB=Cambridge Neuropsychological Test Automated Battery,
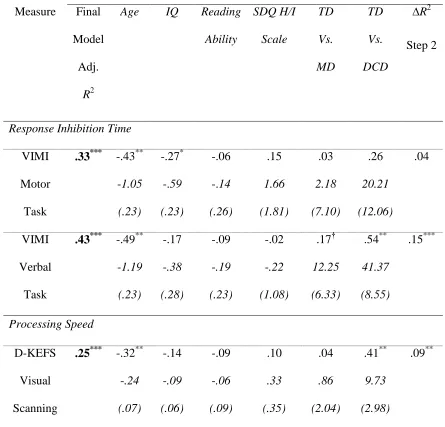
17 Table 2
Summary details of Step 2 of the hierarchical multiple regression analyses predicting speed
of performance in the response inhibition and processing speed measures. Standardized beta
values, unstandardized coefficients and (standard errors) are reported for each predictor variable. The total amount of variance predicted by the final model is also presented, along
with the change in R2 in Step 2 of the model (significant changes indicate an effect of the group comparisons after key background variables have been taken into account). Significant
values are indicated where relevant.
Details of Step 2 for each regression
Measure Final
Model
Adj.
R2
Age IQ Reading Ability SDQ H/I Scale TD Vs. MD TD Vs. DCD
∆R2
Step 2
Response Inhibition Time
VIMI
Motor
Task
.33*** -.43**
-1.05 (.23) -.27* -.59 (.23) -.06 -.14 (.26) .15 1.66 (1.81) .03 2.18 (7.10) .26 20.21 (12.06) .04 VIMI Verbal Task
.43*** -.49**
-1.19 (.23) -.17 -.38 (.28) -.09 -.19 (.23) -.02 -.22 (1.08) .17† 12.25 (6.33) .54** 41.37 (8.55) .15*** Processing Speed D-KEFS Visual Scanning
.25*** -.32**
18 D-KEFS
Motor
Speed
.02 -.23*
-.28 (.12) -.11 -.12 (.15) .03 .04 (.14) .03 .14 (.69) .10 3.55 (4.09) .17 6.50 (5.95) .02 CANTAB Motor Screening
.02 -.08
-.99 (1.82) .07 .76 (1.33) -.04 -.51 (1.38) .10 5.66 (9.13) .28* 105.46 (49.33) -.02 -8.54 (50.63) .07† CANTAB Big/Little Circle
.08† -.04
-.39 (1.45) -.29* -2.87 (1.13) -.05 -.48 (1.25) -.11 -5.60 (6.41) .08 27.44 (36.85) .26* 90.78 (45.27) .03
Note TD=Typically-Developing, MD=Motor Difficulties, DCD=Developmental
Coordination, VIMI=Verbal Inhibition Motor Inhibition test,CANTAB=Cambridge
Neuropsychological Test Automated Battery, D-KEFS=Delis-Kaplan Executive Function
System, SDQ H/I=Strengths and Difficulties Questionnaire Hyperactivity/Inattention
symptoms. Four children did not provide SDQ scores (TD: N=1; MD: N=2; DCD, N=1), and
the regression analyses were therefore conducted with 87 participants.
*p<.05; **p<.01; ***p<.001; †p<.06 non-significant trend.
Footnotes
1
Note that the significant group comparison between the TD and MD groups on the Motor
Screening task, and between the TD and DCD groups on the Big/Little Circle task, cannot be