City, University of London Institutional Repository
Citation
:
Murphy, R. ORCID: 0000-0003-4103-9369 and Guter-Sandu, A. (2018). Resources allocated to tackling the tax gap: a comparative EU study. City University of London.This is the draft version of the paper.
This version of the publication may differ from the final published
version.
Permanent repository link:
http://openaccess.city.ac.uk/21460/Link to published version
:
Copyright and reuse:
City Research Online aims to make research
outputs of City, University of London available to a wider audience.
Copyright and Moral Rights remain with the author(s) and/or copyright
holders. URLs from City Research Online may be freely distributed and
linked to.
City Research Online: http://openaccess.city.ac.uk/ [email protected]
Resources allocated to tackling the tax gap: a
comparative EU study
___________________
November 2018
For comment and discussion
___________________
Authors Prof Richard Murphy Dr Andrei Guter-‐Sandu City, University of London City, University of London [email protected] andrei.guter-‐[email protected]
Acknowledgements
The project has received funding from the European Union’s Horizon 2020 research and innovation programme under grant agreement No 727145.
1. Abstract
Since the onset of the global financial crisis in 2008 and the development of austerity as a
widespread economic strategy there has been continuing focus on the tax gap as an issue, which is the difference between the amount of tax that should, theoretically, be collected by a tax authority within the prevailing system that a tax jurisdiction has legislated for and the actual amount of tax collected. The efficiency, or otherwise, of a tax authority in tackling the tax gap has come to be seen as a measure of its effectiveness in raising revenue, whether to balance budgets or fund additional government spending. Despite this, relatively little formal attention has been given to technical dimensions of the tax gap, or to the link between that tax gap and tax authority spending. We have sought to address these last issues. In the process we have appraised the quality of the data available for this process, including whether available GDP data is reliable as a basis for estimation; whether data on tax collected is comparable and whether available data on tax authority spending is appropriate for this purpose. Data on estimates of the shadow economy have also been appraised as a consequence. Whilst it has proved possible to prepare new estimates of the tax gap for EU
member states limitations in the resulting estimates are highlighted. In addition, weaknesses in all other data sources are noted, and their suitability is questioned. The resulting analysis of tax
management of the tax, and the effectiveness of tax authorities, are required, with a recommendation that tax spillover assessments be considered as an alternative.
2. Introduction
The fundamental hypothesis that the research underpinning this paper sought to test is that there might be a direct relationship between the level of expenditure that a jurisdiction commits to its tax authority and the size of the tax gap that the same jurisdiction might suffer. If true the obvious consequence would be that governments wishing to collect more funds to either balance their budget or to support additional government expenditure should commit greater resources to their tax authority. Instinctively the idea that those authorities enjoying a greater allocation of resources should suffer lower marginal tax yields, which would, however, be reflected in a reduced tax gap is economically appealing and consistent with most microeconomic thinking.
The planned work did require that there be relevant, reliable, consistent, comprehensive and comparable data on a number of activities to ensure that an effective appraisal could take place. Those activities included measures of gross domestic product (GDP), the shadow economy, or non-‐ observed economy as it is sometimes called (NOE), tax yields by tax and the allocation of tax authority expenditure by jurisdiction. Information on the number of taxpayers and other related data was also considered to be useful for interpretation purposes. As it transpired, what was expected to be a relatively straightforward exercise when the research began proved to be anything but that as the research progressed as successive problems with data were encountered, as
recounted in this paper.
The research that has resulted from this work does, as a consequence, focus as much upon the difficulty of appraising national income, the size of the shadow economy and the amount of tax collected by different jurisdictions, as it does on appraising how tax authorities use the resources available to them. This was not the research output that was anticipated when commencing this work. It is, however, suggested that given the significance of this issue the resulting work does highlight a failure on the part of governments and international agencies to address a matter of considerable importance within both national accounting and national resource allocation that must be corrected if the aim of improving the effectiveness of tax collection is to be achieved.
3. Assessing tax administrations’ performance
The primary duty of tax administrations is to ensure the timely collection of tax revenues owing in a jurisdiction in accordance with prevailing tax laws (OECD 2017, 33). As a result of recent trends, however, tax administrations have found themselves in a double bind: at a wider level, they have been affected by the secular move in public administration towards ‘new public management’, which brought about an increased emphasis on accountability, transparency, and performance measurement (Osborne 2010), while at the operational level, they have had to confront cutbacks in resources, due not least to the fiscal strain effected by recent financial crisis which has left
existing ones. In other words, increasing pressure has been building up for tax authorities to do more with less. The underlying premise of this approach is, however, that firstly there is scope for tax administrations to step up their game, and that secondly the determinants of an efficient administration are known. Our object in this paper is to test these linked hypotheses.
In practice, most studies assessing tax authorities and system performance do not focus on these significant and important administrative issues. They do instead focus on external determinants of taxpayer behaviour, such as tax compliance and evasion. There is, for example, a significant literature gauging the extent of tax evasion and analysing the potential causes underlying it, and it generally spans demographic, cultural, behavioural, legal, institutional, and economic reasons (Tanzi 2017; Alm 2012; Slemrod 2007; Sandmo 2005). Despite the breadth of these studies, it has been reported that many still rely on Schneider and Enste’s (2013, 2003) seminal and regularly updated surveys on shadow economies throughout the world (Khlif and Achek 2015). While there are many merits to using surveys as a methodology for estimating tax evasion, significant limitations to this approach have also been noted, especially reporting bias which might result in the overestimation of the issue (Fuest and Riedel 2010).
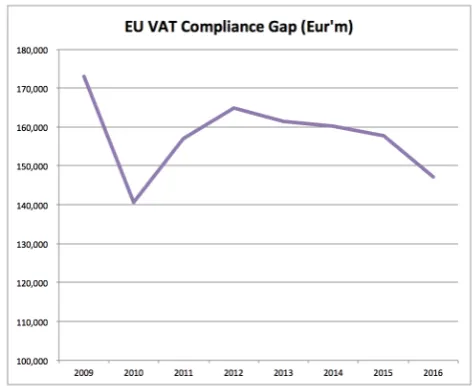
This concern has led to another body of literature on ‘tax gaps’ i.e. the difference between the theoretical amount of tax that should be collected by a tax authority during a year and the sum that is actually collected. Murphy and Petersen (2018) review both the manifold uses of this concept and the manner in which it has been employed by various tax authorities. They find that only eleven EU tax authorities prepare any tax gap estimates of their own, and that only one (the United Kingdom) does so annually for all major taxes. There is, then, a paucity of data available on the scale of the issue being faced when tackling the European tax gap. That said, the best estimates, for instance, of the VAT gap (which is the tax gap most widely covered), place it at between -‐1.4% (i.e. an over recovery, for Sweden) and 37.18% (for Romania) of total theoretically collectable of VAT revenues in 2015, with a total loss throughout the EU that might amount to €151.5 billion (EC DGT 2017). Murphy (2012) estimated the total EU tax gap over all taxes to be €1 trillion. Despite slow uptake and limited scope it is plausible that tax gap measurement methods will become a standard by which tax administration efficiency is gauged, but that is not the universal case at present.
What these studies have in common is their focus on looking at ways to improve tax collection performance by addressing the perceived determinants of tax evasion and, to a lesser degree, tax avoidance. In other words, they attempt to assess what decisive factors have an impact on
Despite this, many subsequent studies built on these insights, and there is now a burgeoning
literature on the multifarious dimensions that influence tax compliance and therefore tax collection. Deterrence models of tax evasion, for instance, focus on the effects of enforcement intensity and tax rate levels on compliance, and construe the latter as a product of a cost-‐benefit analysis based on the risk preferences of the taxpayer (Sandmo 2005; Slemrod, Blumenthal, and Christian 2001; Allingham and Sandmo 1972). Conversely, behavioural models eschew the rational, utility-‐
maximising assumptions of deterrence approaches when it comes to the taxpayer (be it individual or business), and look at compliance as a more multifaceted phenomenon. For example, Frey (1997) makes a differentiation between deterrence elements such as harsh punishment associated with tax evasion laws, which he calls extrinsic motivation, and things like ‘civic virtue’, which constitute an intrinsic form of motivation, and should be placed on an similar footing with the former in its effect on compliance. It might even be the case that sometimes intensifying extrinsic motivation is
counterproductive and leads to less compliance due to deteriorating intrinsic motivation (Lubell and Scholz 2001). Behavioural models also emphasise the importance of perceptions in compliance decisions. Some of these range from the perception of the fairness of the tax system itself, with perceived equitable taxation leading to more efficient tax collection (Falkinger 1995), to the perceived morality of the utilisation of tax revenues, with a negative perception – say, on non-‐ defensive warfare – leading to less efficient tax collection (Daunton 1998), or simply the professed trust in government – more trustworthy governments seem to be, unsurprisingly, better honoured with compliance (Torgler 2003). Not least, an important factor is the extent to which tax evasion itself is perceived as a socially acceptable practice (Torgler 2004). This perception varies considerably throughout the world, and is of course correlated with the size and depth of the shadow economy.
In the end, both deterrence and behavioural models of tax evasion offer insightful information as to how to increase the efficiency of tax collection but it remains the case that the determinants in question only relate to external factors. In other words, they do not touch upon the role of tax administration in the efficiency of tax collection. To some extent, this is not a surprise: until the second half of the new millennium, data on the administration side was relatively scarce (Hasseldine 2007). This rendered the whole process of drawing reliable conclusions regarding the effects of taxpayer behavioural change on overall tax revenue rather difficult. The experimental studies done at the individual level remained simply indicative of micro-‐changes, and overarching or systemic conclusions stayed out of reach (Slemrod 2016). With time, though, tax administrations started reporting state-‐level tax-‐return data, and this equipped researchers with new statistical evidence upon which to base their analyses. This process was spearheaded by Nordic states (Slemrod 2016), but it soon spread to other developed countries, and it was not long before international
organisations jumped on the bandwagon and started releasing supranational data aggregates, which would take the tax studies field to a whole new level.
The primary consequence was the first publication in 2004 of the OECD initiated the ‘Tax
training), human resources (by function, gender, age, number of offices), taxpayer segmentation (by size, type, the number of high net worth individuals (HNWIs), registration, returns, enforcement, disputes, and others. These types of data were not all available from the beginning of the data series, but many fundamental ones have been produced throughout its history, which makes this database amenable to be used in longitudinal analysis. Alongside it sit other databases compiled by other organisations like the World Bank1, the IMF2, and EU’s Directorate General for Taxation and
Customs3. Nonetheless, none compare to the OECD’s scope and degree of detail.
That being said, this profusion of data has not delivered much research investigating the relationship between tax administration capacity and tax collection efficiency. The academic literature on this subject, particularly, is patchy. One notable exception is the output of TARC – The Tax
Administration Research Centre – which was formed in 2013 as a partnership between the
University of Exeter and the Institute of Fiscal Studies (a UK independent research institute founded in 1969), which centre has the explicit remit to undertake academic research on tax administrations with a focus on of tax operations and policies. TARC is thus devoted to five research strands: understanding tax compliance, understanding tax behaviour, measuring the tax gap, understanding audit effects, and computable general equilibrium modelling4. Some research findings include the
fact that taxpayer compliance is influenced by the pre-‐population of tax forms with incorrect values (Fonseca and Grimshaw 2015); that social norms campaigns can be effective in improving
compliance (Onu and Oats 2014); that audits can have a long-‐lasting impact on reported tax liability, reaching 26 per cent by the fourth year (Advani, Elming, and Shaw 2015); and that superseding output-‐based performance measurements in tax administration and replacing them with outcome-‐ based ones is not without its own negative ramifications (Boll and Oats 2014). The ongoing work that TARC undertakes is no doubt important for advancing and promoting the field of tax administration research, but as the noted descriptions of it its work make clear, it does not necessarily deal with determinants of tax compliance on the tax administration side, instead focussing, like the earlier work on improving tax efficiency, on external determinants of compliance.
There are a couple of researchers who have engaged with this issue. For example, John Hasseldine, who is a professor at the University of New Hampshire, and who he was a contributor to the
Mirrlees Review of the UK tax system, suggested in the course of that review that the UK tax system was ripe for modernisation in order to benefit the UK’s economic performance and improve living standards (Mirrlees 2010). While initially conventionally concerned with deterrence and behavioural models of compliance, Hasseldine then investigated so-‐called ‘best-‐practices’ in tax administrations (2007, 2010), which had to do with the internal management of running a tax agency. Issues he addressed included strategy and policy formation; planning, budgeting, resource allocation; monitoring and evaluation; co-‐ordination; and the management of finance, personnel, information technology and assets. He disappointingly concluded that there is not sufficient evidence as to what constitutes best practice in tax administration, and this is reinforced by a lack of academic research in the field (2010). There was, however, reason for optimism in his opinion given that tax
1 https://openknowledge.worldbank.org/handle/10986/12094
administrations had begun information sharing on these issue. Despite this Hasseldine later argued that even in the case of the new methodologies for calculating tax gaps, if one does not take into account behavioural responses, then non-‐compliance will be exaggerated and attempts to address it will likely lead to worse rather than better outcomes for tax revenue because it will produce tax base-‐reducing effects (Gemmell and Hasseldine 2014). It seems the quest for identifying best practices in tax administration, at least independent of external determinants, is an inconclusive one.
James Alm and Denvil Duncan have addressed the issue of tax administration more recently than Hasseldine (2014). After noting, unsurprisingly, that there has been little research on the topic, Alm and Duncan argue that this is a worthwhile subject for research, especially in the context of the new data made available by the OECD in its data series on tax administration (OECD 2017). By utilising this resource, the relationship between administrative inputs (like personnel, equipment, and information) and outputs (i.e. revenues) can be associated. To investigate this linkage they
constructed a three-‐step method that combined data envelopment analysis and stochastic frontier analysis to determine efficiency scores. The parameters they employed as inputs and outputs were salary and IT costs for the former and total tax revenues and a tax type breakdown for the latter. What they found was that “13 of the 28 countries are relatively efficient at collecting any of the three types of tax revenues” and that “on average, countries should be able to collect their current level of revenues with approximately 10–16 percent less inputs” (2014, 94). In other words, OECD countries sport an average performance that is high but not impressive in a context that includes non-‐OECD countries. Alm and Duncan’s study is thus concerned strictly with measuring the relative overall efficiency of OECD tax agencies based on their adopted method, which implies that the weight of particular factors in tax administration is undetermined. To our knowledge, no other scholars developed this issue further.
To conclude this review, research on tax administration has mostly focused on external
determinants of tax performance, with the old deterrence and behavioural models still constituting the basis for studying tax evasion/compliance. The extensive data on tax administration compiled by international organisations like the OECD has so far failed to produce as much academic research as warranted by the flurry of information. Despite the few studies that do grapple with internal determinants of tax collection efficiency, this, so far, constitutes a missed opportunity. It is this shortfall that we seek to address.
4. Methodology
fiscal policy; the control of inflation by withdrawing money from circulation; providing money with value in exchange because of the requirement that it be used in settlement of taxation liabilities which then requires its use for other purposes, and in encouraging people to vote in democracies by engaging them with issues inherent in the social contract between taxpayers and the state. The first four of these, at least, are quite widely agreed upon. This does, then, imply that the review of efficiency of tax administrations has to be considered within the context of macroeconomic policy, as well as at the microeconomic level which has been, albeit rarely, the focus of attention to date.
The methodology that we use in this paper proceeds through a number of logical stages that relate the approach to the work that we have used and the issues that have arisen when doing so. Given that our approach is primarily intended to appraise the efficiency of tax authorities within a macroeconomic context we start with a consideration of data availability for this purpose at this level and as a result consider how tax fits into measures of GDP. This, almost inevitably, leads to a consideration of how the shadow or non-‐observed economy fits into such measures. Our intention in undertaking this review is to appraise whether or not measures of tax authority efficiency as indicated by revenue raised as a proportion of GDP and revenue lost to the shadow economy stated as a proportion of GDP can really be considered useful and to suggest what might need to be done to improve the effectiveness of such measures. This then leads to an appraisal of available data on tax collected, because without this information any analysis of tax authority effectiveness is not possible. Thereafter our primary concern is with data availability on particular taxes and the
resources allocated to their collection to determine whether effective comparison of tax authorities at this level is possible. At this juncture the macro and micro analyses of tax authority efficiency coincide.
5. Tax and the macroeconomy
This approach does require an understanding of where and how the tax base fits into the macroeconomy. The figures that follow seek to represent this:
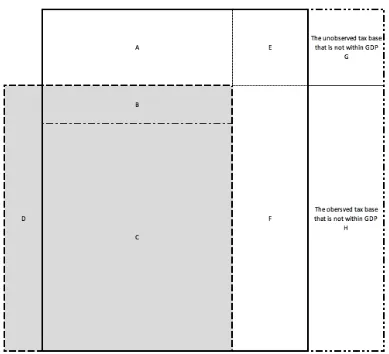
Figure 1 – GDP and its relationship to the macroeconomy
The macroeconomy is the bold outlined area (A + B + C + E + F).
GDP is a subset of the macroeconomy (B + C) plus some transactions the value of which are
estimated and included in GDP but which are representative of values of self consumption but which do not as such represent transactions that can actually be observed within the actual economy (D). The obvious example is the inclusion of the annual value of an owner-‐occupier living in their own house being included in GDP as if rent was paid when this is not actually the case.
It will be noted that GDP estimates usually include an estimate that is meant to represent the shadow economy (B). However, as we note, this will in most cases be an under-‐estimate meaning that it is very likely that a part of the non-‐observed economy (A) will exist outside the measure for GDP.
Obvious examples are capital gains: these are profits arising on the sale of assets that do not add value to the economy but clearly do to the individuals who enjoy them. As a result many
jurisdictions seek to tax them.
That said, if the perspective of the economy being taken here is based on the income statement (and it must be, since GDP is a measure of income) then there are also other transactions that are not within the economy at all when viewed from this perspective, and so not within GDP by default. These are added to diagram in Figure 1 as follows:
Figure 2 – GDP, the macroeconomy and the tax base
Each of the areas A to F has the meaning as in Figure 1. These additional transactions which can be subject to tax but which cannot be measured by GDP or any income based approach usually refer to balance sheet issues. So, for example, the taxation of wealth in its own right falls into this category. So too does a charge on the depletion of natural resources fall into this description of a tax base. Gift taxes also do so. All these relate to charges arising from the ownership, use or transfer of ownership of what are, in effect, balance sheet assets. They are as such a completely valid tax base that falls outside all measures of taxable capacity based on GDP.
[image:10.595.102.491.226.580.2]
Petersen (2018) have argued, there are five tiers of tax gap. Their logic assumes in the first instance that all available tax bases are capable of taxation by default at a single standard tax rate (which need not be the same for each tax base) without any deduction for allowances, reliefs and exemptions. The five resulting tiers of tax gap are as follows:
1. Tax voluntarily foregone i.e. those tax bases that a government of a jurisdiction chooses not to tax for its own reasons. Wealth is an example of an untaxed tax base in many jurisdictions, but in other countries untaxed bases include capital gains, gifts and even income, whether recorded personally or by corporations. There is, of course, no compulsion on any country to tax if it does not wish to do so, but that decision has to be seen as having a cost: this tax gap records the cost of the decision not to tax at a representative tax rate;
2. Tax spends i.e. the cost of tax foregone from tax bases where the decision to tax has been made in principle but where allowances, reliefs, exemptions and other arrangements that have been officially sanctioned mean that the anticipated tax revenue due from the tax base is not collected as a result of a positive decision by the government of the jurisdiction in question not to do so. It should be noted that not all items caught by this measure need be a cost: if the measure is determined by variation from a standard tax rate then charges made at higher rates are recorded as negative tax gaps, or excess recoveries;
3. Tax evaded. This is tax due on those parts of tax bases that have been deliberately moved into the non-‐observed economy to avoid a tax charge. It can also include the cost of fraudulent claim for tax deductions, whether of false expenses or of allowances, reliefs and exemptions not due. It is, of course, the case that this relates to activity in areas A, B, E and G in Figure 2.
4. Tax avoided. This is tax not paid because whilst the economic activity to which it relates is within the recorded economy (and so within C, F or H) the transaction has been deliberately
constructed in such a way that a tax charge anticipated by those who legislated does not become due. There are numerous reasons why this might arise: significant numbers of people within the accountancy and legal professions appeared to be engaged in facilitating such arrangements;
5. Unpaid tax. This is tax declared as a due by a taxpayer but then not collected by a tax authority when the sum becomes liable for settlement. Most commonly this is because of taxpayer default due to bankruptcy but it can also be the result of administrative and other errors by the tax authority. It is likely that only a tax authority can appropriately appraise this tier of the tax gap.
The result of applying this logic to just one part (area C, or the observed economy within GDP) of Figure 2 is as follows:
Figure 3 – The application of tax gaps to the observed economy within GDP
The representation here is, of course, symbolic, but it is intended to make three issues clear. The first is that because the tier 1 and tier 2 tax gaps are within the control of a government they have much more control over tax revenues than is commonly thought. Together these two tiers of the tax gap are usually described as the ‘tax policy gap’. Secondly, tiers three four and five of the tax gap are collectively called the tax compliance gap. These are the only parts of the tax gap where it is
appropriate to consider questions of the efficiency of a tax authority. Thirdly, and as this analysis is intended to make clear, even then the consideration to be used should be macroeconomic, at least in overview.
At this macroeconomic level assessment of the efficiency of a tax administration does then requires the collection of data on six essential key variables. These are:
1. total tax yield (ideally but not vitally broken down by tax);
3. the share of the non-‐observed economy included in that estimate of GDP (B in figure 1);
4. the size of the shadow economy in proportion to GDP (A in figure 1);
5. the cost of labour engaged to collect the revenues raised, and
6. the overhead costs of the tax administration.
This data might, if considered to be of appropriate quality, be used for four purposes. The
first is an assessment of the tax authority’s ability to raise revenue as a proportion of GDP.
The second is to appraise its ability to control the shadow economy, which is that non-‐
observed activity motivated by the intention to evade regulation various forms, all of which
will result in non-‐payment of tax (Schneider et al 2010, 5). Thirdly, it might be argued that it
should be about the ability of a tax authority to deliver upon the government's revenue
projections as part of its overall macroeconomic policy. And only fourthly might it be
considered appropriate to appraise the cost effectiveness of the tax authority in fulfilling
these other objectives. It is effectiveness against the achievement of these varied objectives
that we have sought to appraise when undertaking this work.
This then leaves three further issues to consider. The first is whether nationally reported
GDP can appropriately be used as the basis for the calculation, or whether it should be
grossed up for the estimate of the shadow economy that is likely to be excluded from that
figure for the reasons noted in this paper. The second is whether the aggregate tax rate
based on reported GDP is to be used as the basis for extrapolation of the tax lost to the
shadow economy or whether some other sum should be used taking into consideration the
issues noted later in this paper. The third, and perhaps most important, is whether or not
there is in fact any aggregate tax loss at all because a government does not collect tax for
its own sake but does, instead, do so to collect a targeted sum that achieves its overall fiscal
goal, which will usually be related to its planned surplus or deficit. In other words, whatever
the result of the first two deliberations the question has to be asked as to whether the loss
that can be calculated is meaningful at a macroeconomic level because if all illicit financial
flows which are at present untaxed were identified, and brought within the tax base, the
realistic possibility exists that the overall tax yield might remain unchanged.
This last point is explored using figures 4 and 5:
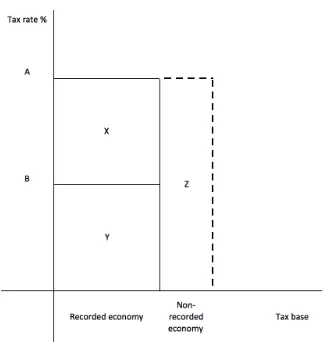
Figure 4 – tax collection when there is a shadow economy
In this stylised presentation of tax revenue collection the sum collected (X + Y) is the tax base in the recorded economy multiplied by tax rate A to produce an overall yield. The tax gap is represented by the tax base in the non-‐recorded economy multiplied by tax rate A, and is represented by the area Z.
In figure 5 it is assumed that there is no activity in what was previously the non-‐recorded economy, all of which is now transparent and so subject to tax:
[image:14.595.136.466.63.407.2]
The size of the recorded economy has now expanded. However, there is no reason to assume that the overall size of the actual economy has changed. As a result there is also no reason to assume that the overall tax yield that the government might plan has changed. That is because with no change in overall economic activity there is no necessary reason for the government to spend more or less, and therefore to change its tax plans simply because more revenue is potentially available. The consequence might then be that a government in this fortunate situation would decide to not increase its total tax revenues but might instead reduced the tax rate from A to B, as figure 5 indicates, with those in what was previously the unrecorded economy now making a tax contribution of W, which happens in this stylised presentation to equal the amount uncollected noted as Z in figure 4. In other words, in this representation:
Z = W
And:
X + Y = Y + W
Meaning that:
X = Z
is instead an indication of the inequality created by those who do not comply with the requirements of the tax code. It is stressed: this is not to belittle the issue; rather it is to suggest that the
consequences of tackling the tax gap a greater the micro economic efficiency, or even macroeconomic possibility. Tackling the tax gap is also a matter of significance for those with concern about social and economic justice.
Of course, it is unlikely that the transition from the position represented in figure 4 to that in figure 5 would actually take place in any real economy: the chance that all economic activity will become observable is remote in any jurisdiction, but this does not remove the relevance of the explanation. That relevance is that if the illicit economy can be stated as a percentage of the existing GDP,
assuming that stated GDP includes little or no estimate of that illicit activity, then when multiplied at the prevailing tax rate the estimated tax revenue foregone as a consequence of that part of the economy not being recorded can be estimated, and is equivalent to Z in figure 4. This then answers the first two points noted: knowing the proportion of the illicit economy included in GDP is only of significance if that proportion (B in figure 1) is itself significant. If it is not then if tax collected within the jurisdiction is appropriately stated, and recorded as a proportion of GDP, a useful estimate of the tax gap can be prepared from these sources alone.
What does also need to be stressed is what the term ‘useful’ means in this context. It is suggested for this purpose that useful data has the qualities of being relevant, reliable, comprehensive in terms of types of data covered, complete as to availability of data for those sources, comprehensible in isolation and comparable over time and with other not dissimilar analyses. Each of these qualities is defined in relation to the use that is to be made of the information. That begs the question as to what use might be made of tax gap data. On this issue the UK’s tax authority say “The tax gap provides a useful tool for understanding the relative size and nature of non-‐compliance. …. [I]t provides a foundation for HMRC’s strategy. Thinking about the tax gap helps the department to understand how non-‐compliance occurs and how HMRC can address the causes.” (HMRC 2018, 3). This is one, very clear, microeconomic perspective on this issue. In contrast, the Fiscalis group of EU member states that have jointly considered tax gap appraisal said of the reasons for assessing VAT gaps that “Effective collection of taxes is a cornerstone of a fair taxation system. Taxes that remain unpaid cause revenue loss in the budget of Member States and may lead to an excessive burden on the honest taxpayers who correctly fulfil their tax obligations. Furthermore, effective collection of taxes is essential for level playing field and avoids economic distortions.” (Fiscalis 2016, 11). Both purposes are equally valid. However, they require quite different information.
The need that HM Revenue & Customs specifies is best met by bottom-‐up data i.e. an appraisal of the effective management of data supplied in tax returns actually collected. The need noted by the Fiscalis group cannot be effectively met in that way. That is because most bottom up analyses are only prepared for particular taxes, and not the system as a whole, which is why the UK's tax
useful. In contrast, data on GDP and tax revenues collected is available for most countries (subject to the points made elsewhere in this paper) meaning that estimates prepared based on such sources are likely to be useful for macroeconomic decision-‐making purposes with regard to tax issues. It is suggested that a top down approach to tax gap estimation is to be preferred if the data is to be used for macroeconomic management of the economy but that bottom-‐up analyses have a use for the appraisal of the effectiveness of tax authorities.
6. GDP Data issues
If a GDP based approach to tax gap estimation is required to provide useful data to appraise relative tax gaps and what might be done about them the quality of the data available to undertake this exercise must be assessed.
There is remarkable unanimity with regard to European Union GDP data. Using 2015 data as the basis for research, because it is the most recent year for which OECD tax authority data is available at the time of writing, the Eurostat GDP data that has been used in the analyses we have undertaken because it is almost identical, barring what must be tiny exchange differences, with that published by the IMF, World Bank and United Nations based on our currency conversions. At this level there appears to be total unanimity on the available data, albeit that this does in all likelihood simply indicate willingness to utilise EU member state nationally published information. This is, perhaps, not too surprising. Each officially subscribes to a common framework for national income reporting that was relatively recently updated (Eurostat 2013).
The more difficult question that then follows is whether this accord on published GDP data actually reflects what is happening in the jurisdiction to which it relates? This raises the question of the extent to which the published estimates of GDP (and it should be noted that all GDP figures are estimates) reflect activity in the shadow economy of the countries that publish them, and whether those estimates are themselves consistently prepared. There is surprisingly little literature on this issue, and much that there is has been published by the International Organisations that regularly publish comparative GDP data. So, for example, Eurostat devote a small mention of a few
paragraphs to the issue in their guide to the accounting requirements of EU member states (Eurostat 2013, 310). In this they suggest that the:
Value of production activities that are not directly observed are, in principle, included within the national accounts production boundary. The following three types of activity are
therefore included:
(a) illegal activities where the parties are willing partners in an economic transaction;
(b) hidden and underground activities where the transactions themselves are not against the law, but are unreported to avoid official scrutiny;
(c) activities described as ‘informal’, typically where no records are kept.
They add:
Illegal activities where either of the parties are not willing participants (e.g. theft) are not economic transactions and so are not included in the production boundary
Perhaps the most important words in their commentary are ‘in principle’ since it is not apparent from this guide how such activities are in practice to be accounted for. In practice the United Kingdom’s Official for National Statistics gives some indication of is approach to this issue when saying that from 2015 onwards it would when preparing UK national accounts:
replace the existing National Accounts concealed income/activity model with a new, more comprehensive model based, in part, on analysis by Her Majesty’s Revenue and Customs (HMRC) of evaded corporation and income tax and update existing estimates of missing production by unincorporated businesses below the VAT and/or PAYE thresholds using updated administrative data provided by HMRC. (ONS 2015)
The problems with this approach are immediately apparent. Firstly, the UK is alone in the EU in undertaking annual tax gap appraisals, and most member states have done none at all (Murphy & Petersen 2018, Fiscalis 2016). Secondly, the assumption is that the HM Revenue & Customs estimate of tax evaded, based as it is on tax returns submitted to them, is adequate. This is open to doubt (Murphy 2014). Thirdly, tax data which may itself be incorrect because it does not appropriately record the activities of small and medium sized entities is used to make good the deficiencies in recording their activities in GDP data. The likelihood is that the UK GDP data is substantially under-‐ recorded as a result. This impression is reinforced by the observation by HM Revenue & Customs in their own note on their tax gap methodology, where it is admitted that significant parts of their data are made up of ‘illustrative estimates’ or are based on ‘developing methodologies’ i.e. there is no robust estimate available at all (HMRC 2018, 16).
The OECD has noted (Blades and Lequiller, 2014) that the shadow, or non-‐observed economy (as they prefer to call it) is made up of two parts. One is illegal activity, such as prostitution and the trade in illicit drugs. These authors suggest that this amounts to less than 1% of GDP in most countries (Blades and Lequiller 2014, 109). They do not provide a source for this opinion. They then add that the second part of non-‐observed activity comprises unrecorded but otherwise legal activity, which they suggest might vary from between 2% and 15% of the GDP of OECD countries. They explicitly suggest that the gap for Spain at the time that they wrote might be 11.2%. They also note (Blades and Lequiller 2014, 123) that the adjustment in GDP for the non-‐observed economy is in the case of France 4%, but that this is ‘just an approximation’. These authors also admit that such estimates should also include allowance for the faults in statistical methods in recording all activity. In so doing it would seem that they base their work on that of the United Nations in its work on Systems of National Accounts (United Nations 2009).
focus from the OECD, separating non-‐observed activity between the formal sector and the informal sector, each of which can be observed and unobserved. It does not, as such, address illicit activity, making it clear that a focus on developing countries (which the OECD does not have) requires this difference of emphasis (United Nations 2009, 471). The result is that it suggests that the non-‐ observed economy can be identified in this way:
Figure 6
Source: United Nations 2009, 471
The issue of significance here is that the informal, formal and non-‐observed sectors can overlap because of the difficulty in identifying boundaries between the two, most especially when many small enterprises will often declare a part but not all of their income (Slemrod 2007) and that the not-‐observed sector can therefore comprise parts of both, most especially when survey based research can identify some parts of the informal sector for inclusion in GDP estimates.
Eurostat also reference this issue in a website discussion5. Their discussion, like the other sources
noted, is light on noted data sources, barring the UN paper (2009) and adds almost nothing to knowledge on this issue. This, however, is misleading as in practice Eurostat do, according to Andrews et al (2011, 12) record the informal sector in EU member states under seven headings within their accounting framework. These are:
1. Producers not registering to evade tax or social security obligations; 2. Producers not registering because their activities are illegal;
3. Producers not required to register e.g. because they only make goods for home consumption within the family unit;
4. Producers not surveyed for national accounting purposes either because it is not
economically worthwhile to do so as the entities are small or registers of entities are out of date;
5. Producers not surveyed due to statistical errors;
[image:19.595.181.414.183.344.2]
https://ec.europa.eu/eurostat/statistics-explained/index.php/Building_the_System_of_National_Accounts_-6. Producers deliberately under-‐reporting despite being surveyed to under-‐declare tax liabilities;
7. Other statistical mistakes.
This approach is reflected in their definition of the non-‐observed economy which they define as follows (Eurostat 2018):
Non-‐observed economy (NOE) refers to all productive activities that may not be captured in the basic data sources used for compiling national accounts. The following activities are included: underground, informal (including those undertaken by households for their own final use), illegal, and other activities omitted due to deficiencies in the basic data collection program. The term ‘non-‐observed economy’ encompasses all of these activities and the related statistical estimation problems.
The definition is interesting but because of its breadth little practical use for appraising illicit flows arising in shadow economies: activities undertaken for own consumption clearly do not contribute to this. In addition, the recognition that data deficiencies contribute to the NOE adds little to the usefulness of this definition.
More tellingly, Andrews et all (2011, 13) note that ‘Although estimates of the non-‐observed economy provide a useful gauge of informality, these estimates are not typically available from national statistical offices, and in the event that they are available, differences in methodological approaches may hinder cross-‐country comparisons. Moreover, the estimates include other statistical deficiencies not related to informal activities’. Given that these authors were writing quite recently for publication by the OECD what is apparent is that just how reliable GDP data might be on this issue is exceptionally hard to assess. Recourse has then to be made to other sources to determine what that proportion should be.
7. Tax data issues
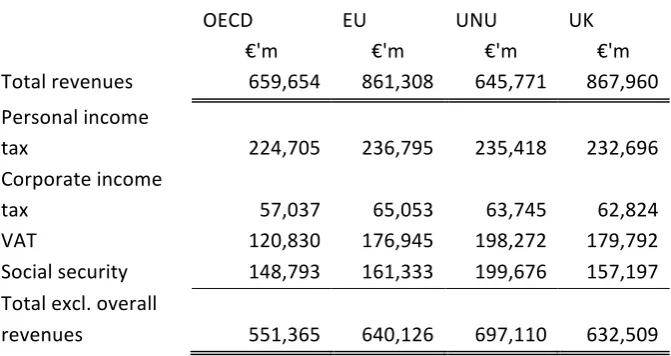
The work in which this paper is based was, at least in part, motivated by a desire to appraise the efficiency of the EU's tax authorities. The best available data on tax authority activity has been published by the OECD (2017). Included in that publication is data on tax yield by member state. When using this data we noted apparent discrepancies with some national data. This led us to investigate alternative sources of information. Two were identified. One was the annual publication of the European Commission’s Taxation and Customs Union surveying the tax administrations of the EU, which includes statistical data on revenues collected by each EU member state (European Commission, 2017). This data is expressed as a proportion of GDP. We translated it for the sake of comparison into monetary totals, aided by the consistent reporting of GDP in the European Union, previously noted. The other available database its that published by the International Centre for Tax and Development at the University of Sussex and now maintained by the United Nations University (UNU-‐WIDER, 2017). This includes all EU member states. As with the EU data, this dataset expresses revenues collected as a percentage of GDP and this data has, again, been translated into monetary values for the sake of comparison with OECD data. It should be noted that the data within this UNU-‐ Wider database has been collected from a variety of sources. The most common source for EU member states appears to be the OECD. The principle alternative is the IMF’s Government Finance Statistics database. Data for Croatia fro 2015 was not available from UNU-‐Wider and that for 2014 for this country alone has been used instead. As it became apparent that these data sources were all providing different indications of total taxation revenues by state and type of tax an additional bench mark test was also made: the reported tax revenue for the UK for its tax year 2015 -‐ 16 (admittedly ending 31 March 2016, but the only reliably published data for this country) has been compared with each other source to test their reliability (Office for Budget Responsibility 2017).
The result of comparing these various data sources was surprising. All data is expressed in millions of euros, with the exchange from UK pounds (when required) being made at European Union official exchange rates:
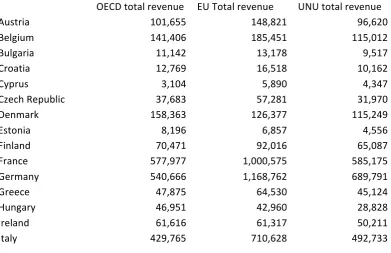
Table 1 Total tax revenues by EU member state as reported by differing data sources (Euro’m)
OECD total revenue EU Total revenue UNU total revenue Austria 101,655 148,821 96,620 Belgium 141,406 185,451 115,012 Bulgaria 11,142 13,178 9,517 Croatia 12,769 16,518 10,162
Cyprus 3,104 5,890 4,347
Czech Republic 37,683 57,281 31,970 Denmark 158,363 126,377 115,249
Estonia 8,196 6,857 4,556
Finland 70,471 92,016 65,087 France 577,977 1,000,575 585,175 Germany 540,666 1,168,762 689,791
Greece 47,875 64,530 45,124
[image:21.595.106.498.521.774.2]Latvia 8,564 7,320 5,019 Lithuania 7,656 10,816 6,452 Luxembourg 11,874 19,382 13,242
Malta 2,381 3,055 2,504
Netherlands 263,149 255,613 163,339 Poland 80,372 139,338 85,132 Portugal 50,357 61,854 41,206 Romania 45,956 44,888 31,936 Slovakia 19,658 25,326 14,261 Slovenia 13,293 14,214 8,463 Spain 225,764 363,959 235,776 Sweden 186,230 193,525 146,358 United Kingdom 659,654 861,308 645,771
3,824,547 5,701,760 3,743,843
Sources: as noted
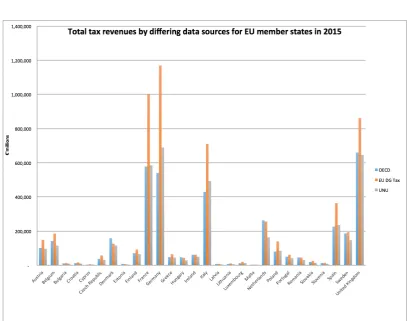
The differences are apparent when expressed graphically:
Figure 7
[image:22.595.73.484.383.704.2]