City, University of London Institutional Repository
Citation
:
Komninos, N. ORCID: 0000-0003-2776-1283 and Procopiou, A. (2019).
Bio/Nature-inspired algorithms in A.I. for malicious activity detection. In: El-Alfy, E-S. M.,
Elroweissy, M., Fulp, E. W. and Mazurczyk, W. (Eds.), Nature-Inspired Cyber Security and
Resiliency: Fundamentals, techniques and applications. . IET. ISBN 978-1-78561-638-9
This is the submitted version of the paper.
This version of the publication may differ from the final published
version.
Permanent repository link: http://openaccess.city.ac.uk/21105/
Link to published version
:
Copyright and reuse:
City Research Online aims to make research
outputs of City, University of London available to a wider audience.
Copyright and Moral Rights remain with the author(s) and/or copyright
holders. URLs from City Research Online may be freely distributed and
linked to.
Chapter 1
Chapter 9: Bio/Nature-Inspired algorithms in
A.I. for malicious activity detection
Andria Procopiou
1and Nikos Komninos
11.1
Introduction
Malicious software [1] is one of the main threats to networks and its assets, as well as individual users. As we approach the Internet of Things and Cyber-Physical Sys-tems era, network traffic becomes more complex and heterogeneous. In recent years, the number of devices connected to the Internet is increased exponentially as well as big data that is produced from them. Also, each device comes with its own protocols and standards. Furthermore, computing devices operate with different protocols and standards and effective traffic monitoring becomes harder. Hence, adversaries con-duct more sophisticated attacks against networks so the malicious behaviour can be more difficult to be detected. Simplistic and one-dimensional security countermea-sures are likely to fail under such circumstances.
Artificial intelligence and particularly learning algorithms seems to be appropri-ate for detecting cyber attacks. Using machine learning, fast and accurappropri-ate detection of malicious behaviour is more achievable than ever. A special branch of machine learning algorithms includes nature and bio inspired algorithms. Such algorithms followed models from nature, biology, social systems and life sciences. Some ex-amples include genetic algorithms, swarm intelligence, artificial immune systems, evolutionary algorithms, artificial neural networks, fractal geometry, chaos theory and so on [2].
Nature/Bio-inspired algorithms have an advantage against traditional machine learning algorithms, they focus on optimisation. In detail, nature acts as a method of making something as perfect as possible or choosing the most fitted samples from a population. In practice, this family of algorithms applies these principles in the form of optimisation and finding the best solution to the problem assigned. In anomaly de-tection, the main objective is to identify the malicious behaviour so these algorithms use their best-fit mechanisms to detect malicious abnormalities. Another beneficial usage of nature/bio inspired algorithms is to optimise the potential features used in attacks detection. An optimal set of features is selected for efficient malware detec-1Centre for Software Reliability (CSR), Department of Computer Science, City, University of London,
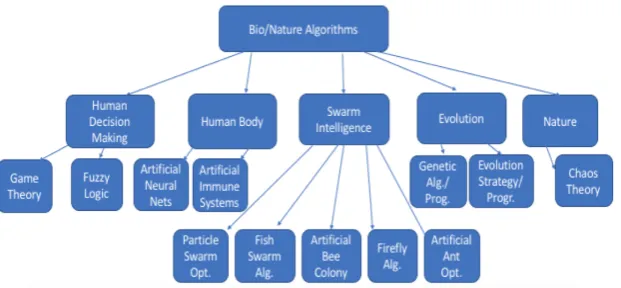
Figure 1.1 Bio/Nature-Inspred Algorithms Taxonomy
tion but also for reducing the complexity and computational burden. Additionally, nature/bio-inspired algorithms are highly flexible as they can accept a mixture of variables in terms of type and continuity. This gives us the opportunity to give a variety of different variable types which expand feature selection in such algorithms. In this chapter, we will explore how nature/bio-inspired algorithms are applied in intrusion detection against different threats and attacks for various networks. The first section of this chapter gives an introduction and in-depth explanation of how the most popular nature/bio-inspired algorithms operate. Both the theoretical and prac-tical concepts are explained and how these algorithms operate to detect malicious behaviour in the context of cyber security. The second section includes a selection of the most notable and complete studies of anomaly detection using nature/bio-inspired algorithms in networks and in low-resources systems such as cyber-physical systems and IoT. In the third section the techniques used and the results produced are discussed. Finally, future directions on how nature-inspired algorithms could be ap-plied in detecting anomalies in such systems is presented.
1.2
Towards Technology through Nature
1.2.1
Terminologies of Bio/Nature-inspired Algorithms
1.2.1.1
Populations
The term population is an important and vital concept in the field of bio/nature-inspired algorithms. In biology and nature sciences, the term population defines a group of either animals or people that belong to a specific kind/type and live in a specific place [3] . In bio/nature-inspired algorithms, the term population refers to a set of possible solutions to a specific problem. In every bio/nature-inspired algo-rithm the procedure starts with an initial population. An initial population is the first commencing set of solutions or candidates, before the algorithm starts functioning, with a specific size. Depending on the type of algorithm used, the population size can change.
The members of a population can be cooperative or competitive. In algorithms that consist of population members that are cooperative, no new members will be either added or deleted. On the other hand, in algorithms where the members of a population are competitive only the fittest members will be included. This process is iterative and on each iteration (called generation) the fitness of the current members is compared to the new members generated. The weakest already existing members are replaced with the strongest new members. Some old and new member genera-tions are combined to create the most optimal solution based on rules. New members that can be potentially merged with the population must be evaluated through scor-ing. The score value is calculated based on the suitability of each member’s solution [3].
. Also, add .(page 213, paragraph 2)
1.2.1.2
Selection
The process of selection involves choosing one or more potential solutions to the problem from the population. Depending on the bio/nature-inspired algorithm cho-sen, a different selection procedure is adopted [3].
1.2.1.3
Crossover
In biology, crossover is the process which a male and a female mate together to breed offspring. In bio/nature-inspired algorithms crossover does not consider gen-ders, any two candidates can mate to produce children. Crossover is mostly used in Evolutionary Algorithms [3].
1.2.1.4
Mutation
1.2.2
Review of Bio/Nature-Inspired Algorithms
1.2.2.1
Artificial Neural Networks
Artificial Neural Networks have been inspired by the biological neural networks present in animal brains and was firstly introduced in 1943 by [4]. ANN models are inspired from biological neural networks that process an acceptable information. Just as animal brains contain biological neurons, ALRFC contain a set of intercon-nected nodes, called artificial neurons. Each connection between the different arti-ficial neural networks (analogous to synapses in animal brains) helps the model of interconnected neurons (nodes) that communicate with each other by exchanging in-formation. The neurons are connected with a set of adaptive weights that are tuned by a learning algorithm that accepts a great set of inputs and decides how the weights between the nodes are going to be adapted.
ALRFC are ideal for pattern recognition. In this simplest form, there are three types of layers in ALRFC; the input layer that accepts the pattern data; the hidden layer that applies the algorithm for deciding what the result should be; and the out-put layer that shows the result. Most of the models have at least an inout-put and and output layer. The input layer accepts the pattern and the output layer gives the output pattern. The hidden layer defines the interaction between the input and the output layers. A diagram of a typical ANN architecture is shown in Figure 1.2.
ALRFC can be either supervised or unsupervised. Both of these processes are iterative. In supervised training, the similarity between the actual and the supposed output is calculated at each iteration. This is described in the form of a percentage error. The calculation of the error is called Backpropagation. At each iteration the in-ternal weights matrices are altered towards minimising this error at a low acceptable percentage.
In unsupervised training, calculating this error percentage is not straightforward due to the model not having an expected output. Hence, the model cannot estimate the current output is from the ideal output. Instead, the model is iterated for a fixed number of rounds..
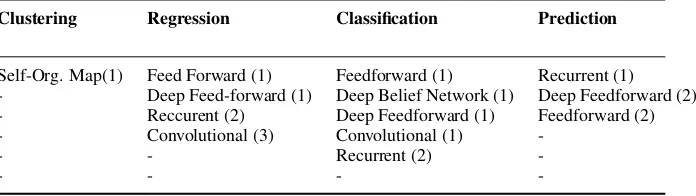
[image:5.442.47.395.489.587.2]There are different types of ALRFC. Al of them have common elements such as neurons, weights, activation functions and layers. However, each type fits for
Table 1.1 ANN Architectures
Clustering Regression Classification Prediction
Self-Org. Map(1) Feed Forward (1) Feedforward (1) Recurrent (1) - Deep Feed-forward (1) Deep Belief Network (1) Deep Feedforward (2) - Reccurent (2) Deep Feedforward (1) Feedforward (2) - Convolutional (3) Convolutional (1)
-- - Recurrent (2)
-Figure 1.2 Artificial Neural Network Architecture
different tasks. Due to their versatile nature, not all of the types of ALRFC can perform equally well in every problem. There are various problems ALRFC in gen-eral can solve though, including clustering, regression, classification and prediction problems. In Table 1.1 we present a table with the most popular ANN types and the problems they can solve best, inspired by [3]. The problem is at the top and in descending order the architecture that solves it best.
ALRFC have been used extensively in Intrusion and Malware Detection. The relevant features to differentiate between normal and malicious activity are extracted from the raw data collected and fed to the input neurons of the ANN architecture. The extracted data are processed in the hidden layers of neurons and the final result is output through the output neurons.
1.2.2.2
Evolutionary Algorithms
Evolutionary Algorithms (EA) is a branch of nature/bio-inspired algorithms in Artifi-cial Intelligence that is very popular and considered classical from all the nature/bio-inspired techniques [5]. EAs comprise of evolutionary techniques and mechanisms taken from the biological evolutions. Some examples include reproduction, mu-tation, selection and recombination. Since these biological models are considered nearly perfect when finding the most fitted individuals, their artificial equivalents are designed to find solutions to hard problems.
The procedure followed in different types of EAs is similar to the equivalent in nature. There is an initial population of random candidates in which natural selection occurs, otherwise called survival of the fittest. Each individual candidate is evaluated through a fitness/quality function. Then iteratively: The best candidates are chosen as parents to seed the next generation of candidates (reproduction). This is done by crossover and/or mutation applied to them. The generated candidates (offspring) are generated are evaluated by the fitness/quality function and replace the least fitting candidates of the previous generation. This process can be iterative until a sufficient solution (set of candidates) is constructed or a computational limit is met.
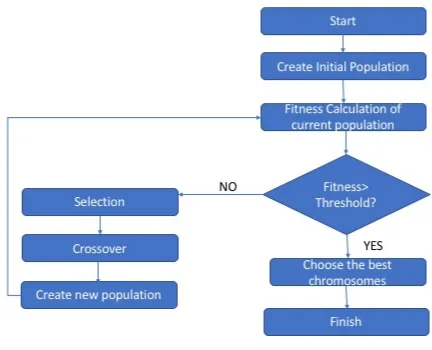
During this process, the fitness of candidates in consecutive populations is im-proved and the easiness of adaption to new environments is also imim-proved. Below we briefly enlist and explain the most notable EAs and summarise the GA’s flow in Figure 1.3.
1) Genetic Algorithm
Figure 1.3 GA Algorithm
Step 1: It begins by initialising a population of solutions (chromosomes). Step 2: Applying a fitness function, the current chromosomes are evaluated. Step 3: The best chromosomes are selected to generate a new generation of chromosomes through crossover and mutation.
Step 4: The new chromosomes are evaluated and exchanged with the least fit of the previous generation of chromosomes.
In Intrusion Detection, certain procedures have to be made before the training. The different groups of data (two at least with normal and attack) represent the ini-tial different groups of chromosomes. Then the training starts with the procedure described above. During the testing/detection part, the input data is taken and an initial population’s created from it. The generated population is compared to the training population. The chromosomes that the new population’s chromosomes are related the closest are classified after them.
2) Genetic Programming
Genetic Programming (GP) was firstly proposed by Koza in 1992[7] and it is considered an extension of the Genetic Algorithm. GP represents the solution in the form of a tree and computer programmes are generated (instead of chromosomes). GP functions as follows:
Step 1: An initial population of computer software programmes is generated, which consists of functions and terminals.
Step 2: Each computer programme solves a problem given and a fitness value is assigned based on its accuracy.
Step 4: Through mutation and crossover new computer programmes are created to form the next generation.
Step 5: Finally, the best programmes of the new generation are exchanged with the worst ones of the previous generation.
3) Evolutionary Strategy
Evolutionary Strategy (ES) methods were proposed by Bienert, Rechenberg and Schwefel in 1964 [8]. It is an optimisation algorithm which is based on the adaption of evolution theory. A special characteristic of the ES is that the mutation can be controlled depending on the type of the ES strategy chosen. Hence, both the search process and the solution are optimised, as well as the mutation parameters. Below, the most popular schemes are briefly explained [9].
(1+1) -ES :This is the scheme with the simplest selection mechanism. A real-valued vector of variables is created from the parent through mutation, by using standard deviation to each variable object. Then, newly constructed individual is evaluated and compared to its parent. The best of the two becomes the new parent for the next generation with the less fit being discarded.
(µ+λ)-ES: In this scheme, anµnumber of parents is chosen from the current
generation. These µ parents are responsible for creating theλ offspirng through
mutation and crossover. Then theµgeneration andλ offpsirng are united into one
group, with only the best mi remaining, and the rest being discarded.
(µ,λ)-ES: Once again, µ parents are chosen from the current generation to generate theλ offspring (whereλ ≥µ). From the new generation only the bestµ
offspring individuals survive, with the parents being discarded completely.
Evolutionary Strategies are particularly effective against Intrusion Detection be-cause they generate rules that can match the malicious traffic. To evaluate the pop-ulation of suggested solutions, the dataset chosen is used to judge at which iteration the most optimal solution is obtained.
Evolutionary ProgrammingEvolutionary Programming (EP) is again an
ex-tension of the ES methods, also using the theory of evolution [10]. It is very similar to the genetic programming method as it encompasses of computer programmes as well. Their major difference is that the structure of the programme to be optimised is fixed.
1.2.2.3
Swarm Intelligence Algorithms
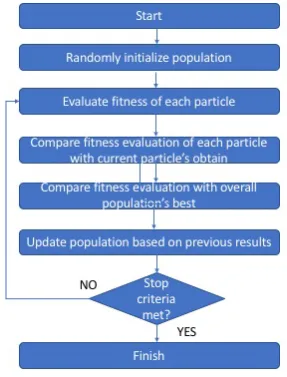
Swarm Intelligence (SI) has been introduced by Beni and Wang [11] in 1989 for cellular robotic systems. The concept consists of collaborative functioning by a large number of small organisms such as bees, ants, birds and so on. Based on this concept self-organising computer network systems can operate efficiently. Under this term, the most common technique used is the Ant Colony Optimisation, which are based on the oragnisation of large ant colonies for food transporting reasons, Artificial Bee Colonies, Fish Swarm Algorithm, Intelligent Water Drops Algorithm, Firefly algorithms and so on. Below we briefly describe the common fundamental concepts all of the Swarm Intelligence are based on. A summary of how SI algorithms operate is illustrated in Figure 1.4.
Figure 1.4 SI Algorithm
Proximity Fundamental: The population performs a series of time and space computation calculations to function properly.
Quality Fundamental:In the presence of environment quality factors, the pop-ulation shall be able to positively react.
Diverse Response Methods: In any procedures the population carries out, the means and ways shall not be limited and fixed.
Stability Fundamental:The population shall be able to remain intact and fixed in its functioning, regardless of any changes in the environment.
Adaptability Fundamental:The population must be ”intelligent” enough to re-alise that if the computational burden can be decreased, then it shall change its be-haviour.
SI algorithms can be applied in intrusion detection by constructing a set of rules for effective classification. Each organism creates a set of rules that evaluates them with the training set it is provided with. With iterations, the rules are reconstructed and extended enough to have a high accuracy percentage.
Particle Swarm Optimisation
factors, its best position and its neighbour’s best position during the search process until a stopping criteria is met.
Ant Colony Optimisation
Ant Colony Optimisation (ACO) was firstly introduced by Dorigo and Di Caro in 1999 [13]. It was inspired by the remarkable ability of ant species to collabo-ratively find the shortest path between their nest and the various food sources by making usage of pheromone trails. The more pheromone each path has, the stronger the probability is to follow it. This procedure is a type of reinforcement.
Artificial Bee Colony Algorithm
Artificial Bee Colony Algorithm (ABC) was proposed by Karaboga in 2005 [14].Inspired by the behaviour of bees, several swarm intelligence algorithms have been proposed. Mainly, there are two types, foraging and mating. One of the most popular foraging algorithms is the ABC algorithm which simulates the behavior of honeybees groups. This promotes intelligent and cooperative behavior between bees with different roles. A bee can have one of the two following behaviors; the first is when a bee finds food, the other bees are lead to the food source and the second is when bees leaving food sources for others. The bee can have three roles in these scenarios, the employed bee, the onlooker bee and the scout bee. In the ABC algo-rithm the place where the food is located can be a potential solution to the problem and the quality of the food maps to the fitness of the solution. The number of on-looker or employed bees corresponds to the number of the solutions to the problem. Concluding, there is only one employed bee for every food source.
Fish Swarm Algorithm
The Fish Swarm Algorithm (FSA) is a relatively new population-based/swarm algorithm, proposed in 2002 by Li et al. [15]. The FSA was based on fish schooling behaviour to search for food. A fish in the FSA algorithm is represented by a D-dimensional position and the fish food satisfaction is represented by a numerical metric. The relationship between the two fish is denoted by the euclidean distance of the two. Three basic behaviours are consisted in this algorithm, ”searching for food”, ”swarming against to a threat” and ”following towards a better result ”. Searching for foodmeans that the fish randomly search for food so they can minimise the food satisfaction. Swarmingmeans that the objective is to keep the food levels of fish satisfactory, keep the existing fish happy and attract new fish.Followingmeans that when a fish locates food, the others will follow.
Firefly Algorithm
The Firefly Algorithm (FA) has firstly been introduced by Yang [16] in 2009 and has been inspired by the flashing behaviour of the fireflies. The algorithm consists of an iterative procedure with a population of agents (the fireflies) working together to solve an optimisation problem. The algorithm is based on the following concept of finding a solution: a better firefly glows more. Each firefly attracts other fireflies, regardless of their gender, so the searching for the optimal solution in the search space can be found more efficiently. The procedure is the following:
Figure 1.5 AIS Algorithm
Step 2: The more a firefly glows, the more attractive it is towards the others. The brightness can be decreased though due to distance. If there is not a firefly that stands out in terms of brightness from the rest, then they will move randomly.
Step 3: The brightness of a firefly is based on the result of a calculation of the objective function for a given problem.
1.2.2.4
Artificial Immune Systems
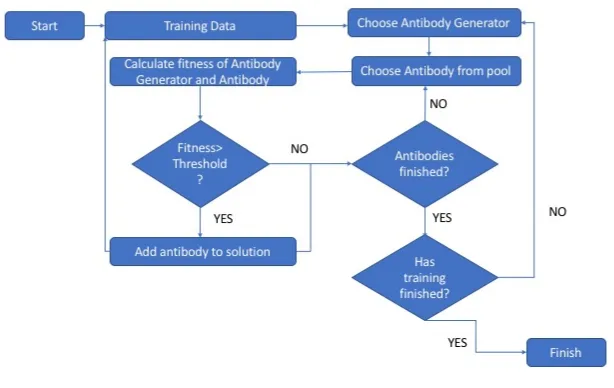
Artificial Immune Systems (AIS) Algorithm has been firstly introduced in 1999 [17] by Dasgupta and was inspired by the human immune system. The human immune system is a true wonder, as it is highly evolving, works in a parallel and distributive way, it is robust and can be adapted easily to any environment. The human body generates various detector cells (antibodies) to guard against non-self cells (anti-gens/pathogens). Antibodies are distributed to the entire body so there is no central coordinator. Each antigen is unique and independent in terms of detection. Hence, the set of body cells is mapped to the system/network/hosts to be protected and the antibodies are the IDS agents to detect the external entities (pathogens).
There are various algorithms to create antibodies to protect cells from pathogens, such the clonal selection algorithm (CSA) and the negative selection algorithm (NSA).
The CSA is based on the concept of acquired immunity where in a specific way B and T lymphocytes respond in a better way to antigens over time. The negative selection algorithm is inspired by the biological concept of identifying and deleting self-reacting cells that attack self-tissues.
otherwise it is discarded. Next in the monitoring state, if there is a match between a detector and an incoming traffic part, then an anomaly is present. Neighborhood Negative Selection (LRFC) on the other hand operates in two stages. In the first stage, feature extraction takes place and then these features are used to train the algorithm. The system extracts the duration/direction of the flow and the number of packets/bytes. In the second stage, the LRFC algorithm is used for detection. A quantitative approach is adopted to detect instead of a single threshold. A less used algorithm of AIS is the Dendritic Cell Algorithm (DCA). DCA is based on how dendritic cells operate in natural immune systems as activators.
AIS relies on mutation to make its decisions and operates in the following way: Step 1: Initialisation: The potential solutions to the problem (antibodies) are initialised. Antigens mark the value of the objective function that must be optimised. Step 2: Cloning: The antibodies are evaluated on how fit they are. The best antibodies are cloned proportionally, with the best being cloned the most.
Step 3: Hypermutation: In this stage, the best antibody’s clones are mostly mutated and the worst antibody’s clones are lessly mutated. Next, the clones are evaluated with their original antibodies. The best antibodies are kept for the next generation, with the best being discarded, for the next generation. This mutation can be gaussian, exponential or uniform.
In Intrusion Detection , AIS consists of three phases. Firstly, the algorithm de-fines itself by learning the normal behaviour so it can construct a baseline. Secondly, it generates detectors thrgh he T-cells prcess. Thirdly, the input data are compared to all the T-detectors. If there is a match then there is no intrusion.
1.2.2.5
Fuzzy Logic
Fuzzy Logic (FL) was proposed in 1965 [18] by Zadeh. FL concept mimics the human brain interpretation of uncertain information. Similar to the brain operation, FL replies to inputs with approximate (truthy/faulty) rather than distinct and exact reasoning. In reasoning some questions have various answers, based on a set of knowledge and rules that form a specific solution to the problem. Likewise, each FL reply has a degree of truth and in combination with probabilities they form a fuzzy set.
1.2.2.6
Chaos Theory
deterministic non-linear system can cause major changes in a later state/outcome of it.
In the context of Intrusion Detection, the IDS system closely monitors the traffic and through calculations can understand at what extend it starts behaving chaotically. If there is an indication of chaos, then there is likely an intrusion.
1.2.2.7
Game Theory
Game Theory (GT) has been applied in many areas including mathematics, psychol-ogy, economics, computer science, political sciences, and gambling. GT is inspired from mathematical modeling and decision-making. Although multiple and different approaches to Game Theory have been proposed it has been firstly introduced by Neumann in 1928 [20]. It studies cooperation and conflict between individuals who make decisions upon particular rule-scenarios. The theory consists of games played between players where games can be cooperative or non-cooperative depending on the players intentions. Games are also based on self-interest or common interest.
In the context of Intrusion Detection, a game is played between the IDS and the possible attacker. Based on the model constructed and the assumptions considered, a decision is made on whether there is an intrusion.
1.3
Cyber Attacks and Malware Detection
In cyber space there are numerous cyber attacks that can be conducted against net-works and/or individual assets. These attacks can threaten one or more of the main Cyber Security Principles : Confidentiality, Integrity and Availability. Below we give a brief explanation of the most popular cyber attacks & malware and their im-pact on a network and/or asset, as well as which Cyber Security Principle they mostly negatively affect.
1.3.1
Distributed / Denial of Service Attacks
A Distributed / Denial of Service Attacks (D)DoS attack can be volumetric or vul-nerability exploitation-based or reflection-based. A volumetric DoS attack consists of an attacker sending a massive volume of requests in an attempt to flood the target machine and make it unable to accept legitimate requests from normal users [21]. In a vulnerability-exploitation (D)DoS attack an attacker is taking advantage of a sys-tem or protocol or communication weakness to make the target machine unavailable to legitimate requests from normal users. In a reflection (D)DoS attack the target is responding with the received challenge. A (D)DoS attack can also occur in any of the Transmission Control Protocol/Internet Protocol (TCP/IP) Layers. (D)DoS attacks mainly threat the Availability Security Principle.
(D)DoS attacks can occur in all the Open Systems Interconnection (OSI) layers. Below we briefly describe the most popular (D)DoS attacks across all layers.
Physical Layer:In the Physical Layer we have Jamming attacks.
A Jamming attack has multiple forms. The most popular is the Constant Jamming (D)DoS attack where a burst amount of radio signals are constantly sent. The sec-ond type is the Deceptive Jamming (D)DoS which falsely sends radio signals in an attempt to make the target unavailable.
Link (MAC) Layer:
In the Media Access Control (MAC) layer we have theARP Poisoningattack where the attacker performs MAC address spoofing so it can send Address Resolu-tion Protocol (ARP) Messages to a network. Hence, messages are redirected to him instead of the normal user. Therefore, the attacker can cause a (D)DoS attack by dropping the packets.
In wireless networks, a node that wants to connect to a wireless network, scans the environment to connect to an available network by sending Probe Requests. The access point responds back, providing information about the network. In aProbe
Request Floodingattack, the adversary sends a burst amount of probe requests to
the access point to make it unavailable to legitimate requests.
Another popular attack in the MAC layer consists of theAuthentication Request Flood.The attacker who has already perfromed a MAC spoofing attack to try and authenticate themsevles to the access point by sending authentication requests. The attacker aims to flood the access point with authentication requests.
Network/Transport Layer:In the network and transport layer we have a
vari-ety of different types of (D)DoS attacks.
In aSYN-Flood (TCP-Flood) (D)DoSthe attacker sends a great number of SYN packets to the target until the target becomes unresponsive to legitimate requests. In a normal situation a clients initiates a TCP connection by sending a SYN message to the server. The server responds with a SYN-ACK to the client, the client responds back with an ACK message and the connection is established (three-way handshake). In aUDP Flooding (D)DoSthe attacker sends a large number of User Datagram Protocol (UDP) packets to random ports of the target.
In aGray Hole (D)DoSthe attacker selectively drops packets that are to reach a particular destination.
ABlack Hole (D)DoSis similar to the gray-hole attack but the attacker drops all packets passed by it.
An ICMP Flooding (D)DoS , otherwise called Ping Flooding (D)DoS attack, sends a burst amount of Internet Control Message Protocol (ICMP) echo request packets to the server.
In aLow-Rate (D)DoSthe attacker exploits TCPs retransmission timeout mech-anism and sends low-rate traffic to the target so the connection can be kept alive. As time goes by, the attacker opens more and more connections and eventually makes the target unavailable to legitimate incoming connections.
In aPing of Death (PoD) (D)DoSthe attacker aims to make the target unavail-able by sending either malformed or oversized packets using the ping command.
In aLand (D)DoSthe attacker sends a TCP packet, which contains the targets IP Address as both the source and the destination. This causes the victim to send replies to itself over and over again, resulting into it becoming unavailable.
TheFraggle (D)DoS is similar to Smurf attack but instead of ICMP echo pack-ets the attacker sends UDP echo packpack-ets to the target.
TheSmurf (D)DoS attack can either be a simple or distributed DoS attack where the attacker(s) through IP Spoofing the victims IP address sends a large number of ICMP echo requests to the IP broadcast address. As a result, the victims computer is becoming extremely slow and eventually becoming unavailable. Finally in the application layer we have a fair number of different (D)DoS attacks.
TheSIP Flooding (D)DoSattack is conducted in the Session Initiation Protocol (SIP), which is an application layer protocol used in Internet telephony for both voice and video calls as well as instant messaging. The attack floods the target with either valid or invalid calls or messages.
In anHTTP Flooding (D)DoSthe attacker sends a burst amount of legitimate get or post request to the victim resulting into the target becoming unavailable to legitimate requests in the Hypertext Transfer Protocol (HTTP). Since the requests are perfectly legitimate the server has no ways of rejecting them.
In aDNS (D)DoSthe attacker sends Domain Name System (DNS) queries that at first are small in size but then become large in size. The attacker redirects these messages to the victims IP address resulting into a targets unavailable state.
In aSlow Rate (Request and Post requests and Response) (D)DoSthe attacker takes advantage of the servers waiting time for a get/post request to be completed (time-out time). The server is waiting for a specific amount of time for the client to send the request before closing the connection. The attacker instead sends a request very slowly, tricking the server into believing that simply the request is coming from a slow connection. In time, the attacker opens more and more connections to send requests that are never completed. As a result, the server becomes unavailable. In response attacks the attacker reads the response sent to him very slowly by having a much smaller window-size than the servers send buffer size.
In SSL (D)DoSattacks the adversary exploits the Secure Socket Layer (SSL) hanshake authnetication mechanism. In detail, the attacker sends bogus data to the target or exploits the functions to the SSL encryption key negotiation procedure.
1.3.2
Botnets
A botnet is a set of devices/machines that are connected to the Internet which, at some point, have been infected by a malware and are controlled by an adversary, the botmaster. A botnet can perform a (D)DoS attack, send spam mail or engage in click frauds [22]. This can result into the network/target not functioning fully thus, the Availability principle is threatened.
1.3.3
Malware
script, active content and so on. A malware exploits any known or unknown vulner-abilities of a system, network, machine, protocol and so on so it can illegally execute malicious code to steal data, destroy assets or abuse services and/or functions [22]. The most popular types of malware are briefly explained below.
1.3.3.1
Viruses
A virus is a malicious software that once installed, through user interaction, it starts making copies of itself and infects various types of files and/or programmes. Through it the Confidentiality and Integrity principles are affected [22].
1.3.3.2
(Remote Access)Trojan Horses
A Trojan Horse is a type of malware that masquerades itself as a legitimate, useful programme in order for the victim to be tricked and install it. It has taken its name from the Ancient Greek Trojan Horse used to stealthily invade the city of Troy. In contrast to viruses and worms, Trojans do not usually inject or propagate themselves in other files. A Remote Access Trojan is a special type of Trojan that gives to the adversary remote access to the victim’s computer. Through it the Confidentiality and Integrity principles are affected [22].
1.3.3.3
Rootkits
A rootkit is a special type of malware that its main strength is that it remains un-detected. To achieve that, it modifies the victim’s operating system so it remains hidden from the user. In detail, the rootkit is able to hide malicious processed from being visible in the list of active processes. It also eliminates any access to its files. Through it the Confidentiality and Integrity principles are affected [22].
1.3.3.4
Backdoors
A backdoor gives the ability to the adversary to invisibly access and manipulate remotely a machine by bypassing any form of authentication. Through it the Confi-dentiality and Integrity principles are affected [22].
1.3.3.5
Spyware
A spyware is a malicious software that once installed on a victim’s comptuer, starts illegally gathering information about assets without the user’s consent. Through it the Confidentiality and Integrity principles are affected [22].
1.3.3.6
Worms
A worm is a type of malware that, unlike viruses, can replicate itself without any user interaction and spread to other computer when connected to a network. Through it the Confidentiality and Integrity principles are affected [22].
1.3.3.7
Ransomware
Confidentiality and Integrity principles are affected as well as Availability since the machine is unavailable to the user.
1.3.4
Probe Attacks
Probe attacks are scanning procedures an attacker follows to collect useful about po-tential vulnerabilities a machine or an entire network has. Based on the gathered in-formation the attacker can attempt to exploit the victim at a later stage [22].Through it the Confidentiality principle is affected.
1.3.5
Buffer Overflow
Sometimes, due to poor programming code, applications and software have a se-rious vulnerability. While data is being written to the buffer during a process, the buffer’s boundary is overrun and nearby memory locations are overwritten. An at-tacker can exploit this vulnerability through malformed inputs to gain unauthorised access. Through it the Confidentiality and Integrity principles are affected [22].
1.3.6
Brute Force Attack
A brute force attack consists of an attacker attempting to break a password by trying a great amount of random combinations to get it right [54]. Here, the Confidentiality principle is affected [22].
1.3.7
Masquerading Attacks
In masquerading attacks, an adversary manages to steal the identity of a legitimate user and masquerades themselves as normal entities in an attempt to exploit a system or a network [22].
1.3.8
Datasets used in Intrusion Detection
1.3.8.1
DARPA Dataset
The MIT Lincoln Laboratory along with the Defence Advanced Research Projects Agency (DARPA ITO) and Air Force Research Laboratory (AFRL/SNHS) have col-laborated together to create an Intrusion Detection dataset from 1998-1999. The DARPA 1998 dataset consists of seven weeks with normal and attack traffic. The dataset set consists of two weeks of attack-free traffic, with one week of new attacks along with the old ones from the DARPA 1998 dataset [23].
1.3.8.2
KDD-99 Dataset
cyber attacks present in the dataset. These attacks are categorised into four groups, Denial of Service (DoS), User to Root (U2R), Remote to Local (R2L) and Probing Attacks. DoS and Probing attacks have already been explained above. U2R denotes a set of attacks in which the attacker manages to gain root access. R2L denotes a set of attacks in which the attacker exploits a certain vulnerability to gain access to a local machine in the network[24]. A newer version of the KDD99 dataset, the NSL-KDD dataset, attempts to improve the KDD-99 dataset’s issues highlighted in the literature’s studies[25].
1.3.8.3
ISCX IDS 2012 Dataset
In the ISCX IDS 2012 Dataset, various multi-stage attacks scenarios were conducted such as SSH Brute Force attacks, (D)DoS attacks and through IRC Botnets and in-ternal Infiltrating of the network[26].
1.3.8.4
ISCX IDS 2017 Dataset
In the ISCX IDS 2017 Dataset, multi-stage attacks scenarios were conducted with more diversity. Some examples were various (D)DoS ADoS slowloris , DoS Slowhttptest, DoS Hulk, DoS LOIT and DoS GoldenEye as well as the botnet ARES. Brute Force attacks were also conducted such as SSH and Brute Force attacks. Also, web-based attacks were conducted such as web Brute Force ,XSS and SQL Injection. Finally, port-scan maliucious behaviour was simulated [27].
1.3.8.5
Botnet Dataset
In the Botnet Dataset, various botnets were used to attack the network such as Neris, Rbot, Virut, NSIS,IRCBot , Menti, Sogou, Zeus, Weasel, SmokeBot, Murlo [28].
1.3.8.6
CIC DoS dataset
In the Canadian Institute for Cybersecurity (CIC) DoS dataset, the attack behaviour was focused on Application Layer (D)DoS attacks. The attacks conducted were high-volume as well as low-volume. The High-volume attacks were HTTP GETs, DNS queries, SIP INVITEs. The Low-volume attacks were low-rate attacks, Apache Range Header attack, Slow-Rate DoS Slowhttptest, DoS Hulk, DoS LOIT and DoS GoldenEye [29].
1.3.8.7
The AWID dataset
The AWID dataset has been constructed in 2015 and consists of a dataset with normal and attack traffic targetting 802.11 networks [30].
1.3.8.8
The UNSW-NB15 dataset
1.4
Bio/Nature-Inspired Algorithms Studies in Intrusion
Detection
1.4.1
Game Theoretic Studies
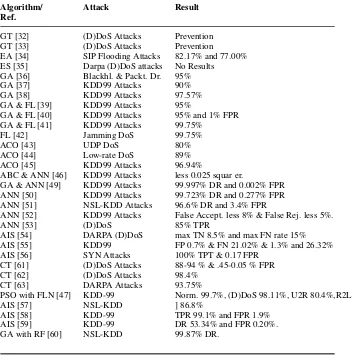
The authors in [32] used GT with Nash Equilibrium. They designed a cooperative IDS in an attempt to increase accuracy and to detect new threats. The authors pro-posed a trust management framework so the IDSs could be connected in a trustful way, reduce the impact for compromised IDSs and reduce the false positive rates and be scalable. When an IDS evaluates traffic to detect potential DoS attacks but has limited knowledge it seeks help from other IDS by sending requests to gain extra feedback from them. There is a central component that organizes the communication between the different IDSs. The authors evaluated their solution against DoS attack so when a malicious node is detected it is removed from the network.
The authors in [33] also used Game Theory to prevent and detect (D)DoS attack in Ad Hoc Networks. The game theory concept was applied as a form of multiplayer game in combination with cryptographic puzzles. In an ad-hoc network, when a node wishes to send a request it needs to solve a puzzle first and then become a member in a group. The nodes belong to each group play a multiplayer game that is divided into 2-player sub-games. The winner of each group, (highest score) is served by the requested node. The games are continued until all requests are served. In the end, there will be one player left at each group. In that case, that game is played between the last node and the node responsible for authorizing the requests. By doing that the authors ensure that the bulk of the computation overhead is handled by the requesting node which checks the winning results. In case of a malicious node is already present in the network it will need to process a high computation puzzle. The authors found that the optimal number of players for each group would be between 2 and 20. The solution also is efficient for the ad hoc nodes of the network.
1.4.2
Evolution Strategies Studies
been proved to be effective with 82.17% and 77.00% against chunk flood attacks and harmonic flood attacks..
The authors in [35] use ES to generate rules to match anomalous connections from the DARPA Dataset, including DoS and (D)DoS attacks. As they have stated in their work, the majority of research is focused on GA approaches so they are the first to use ES to generate rules for detecting anomalous connections. The attributes the authors have used for detecting anomalies are the source IP address, the destination IP address, the source port, the destination port, the duration of the connection, the state, the protocol, the number of bytes sent by the source and the number of bytes sent by the destination nodes. The range of values for each attribute have a prede-fined set of values and use ES to find the optimal range. The authors do not present experimental results, although their suggestion is important for research.
1.4.3
Genetic Algorithms Studies
There are numerous studies that make usage of genetic algorithms to detect various cyber attacks. GA is an excellent algorithm for optimising the features used in intru-sion detection, managing to not only reduce the overall complexity of the system but also achieve a better detection rate against various cyber attacks.
The authors in [36] designed an IDS for MANETs using GA to detect black hole and dropping routing DoS attacks. They defined a set of characteristics for the GA algorithm to consider (whether connections was from/to similar port/host, number of wrong fragments within the connection, connection SYN errors, percentage of connections to similar/desimilar services and hosts and so on). Using a trained set they constructed the population. Then, by introducing the test data to the GA and by performing analysis (selection, crossover, mutation), test data were categorized. The authors report a detection rate of 95%.
In [37], the authors have designed a multi-layer approach intrusion detection system by using the genetic algorithm. They followed a multi-layer IDS to detect attacks from the KDD99 Dataset. Each layer operate as a filter for each group of at-tacks (there were four layer, one for each group of atat-tacks) and blocks any malicious activity so there is no need for further investigation. The authors report that as the number of rounds of the GA is increased so does the accuracy of the results but the complexity as well. They report an overall of 90% of potential accuracy but the time complexity is reported to be relatively high.
The authors in [38], have also made usage of GA to detect the same family of attacks from the KDD99 Dataset in wireless networks. They have compared their results with other studies, which consist of studies using ALRFC, and their solution is reported to have a detection rate 95.67% training accuracy and 97.57% testing accuracy. They have also made usage of only 16 features to achieve these results from a total of 41 features.
1.4.4
Fuzzy Logic Studies
detect KDD99 set of attacks, including DoS attacks. For the detection using the GA algorithm they have used a set of characteristics; source IP address, destination IP address, connection duration, protocol type, source port, destination port, and des-tination host service. With FL specific rules, the detection rate is increased and the error rate is decreased when the input is ambiguous. The results indicate that solution being more accurate, faster and lighter in computational resources than GA and FL when used separately. Specifically, the detection rate is high (>95%), the execution time is 12,500 milliseconds and the memory allocation in less than 25 MBs.
In [40] the authors have combined the GA along with FL to create the Fuzzy Ge-netic Algorithm (FGA) for their research. The algorithm was detecting all the attacks from the KDD99 Dataset . The algorithm commences by randomly choosing rules and then using the evolutionary algorithm to improve the rules during the training phase. Then, during the testing phase the final rules are used for classification of the testing data. The new algorithm was trained with traffic collected by the researchers themselves and can also detect unknown attacks. Through a series of experiments the FGA has detection rate percentage above 95% and false positive rate less than 1%.
GA was also used as a feature selection technique before proceeding to the de-tection part. In [41] the authors have used GA to choose the most relevant and accu-rate for detection features from the KDD99 dataset. In that way, the authors aimed to perform a faster, lighter and more accurate detection. For the detection part, a Support Vector Machine (SVM)-fuzzy based algorithm was used for detection. Au-thors’ report claims their results are better when using their solution rather than SVM by itself or the SVM-fuzzy algorithm without the GA performing the feature selec-tion. Specifically for the detection of DoS attacks, the detection rate is reported to be 98.3% and the error rate to be 2.7%.
The authors in [42], have used fuzzy logic to detect (D)DoS jamming attacks at the Physical and MAC layers in IEEE 802.15.4 low rate wireless personal area networks. They have taken into consideration bad packet and signal-to-noise ratios to detect such attacks. Bad Packet ratio is measured at the receiver side and consists of the total number of bad packets received by a node, divided by the total number of all packets received by the node, over a specific amount of time. Signal-to-Noise ratio consists of the ratio of the received signal power at a node to the received noise at the node. A collection of objects has a fuzzy set which maps each object of the collection to a membership value (by applying a membership function to it) from 0 to 1. In this case two set of objects exist, one for the signal-to-noise ratio and one for bad packet ratio. Through fuzzification, each of the two values produced from the two metrics fall among low, medium and high. According to certain rules one final result is produced that is defuzzied and a final decision is made on whether there is jamming attack or not. Throughout simulating different types of jamming attacks the detection rate has an average of 99.75% and a false positive rate of 0.01%
1.4.5
Swarm Intelligence Studies
iter-atively monitor the network activity flow. More specifically, each ant represents an IDS agent, which is responsible for monitoring the network activity. Each agent/ant moves from a state/stepato a state/stepb, where each state represents network pat-tern knowledge. On each state, depending on the incoming packets received, a set of feasible expansions to the ant colony is calculated and the agent moves to the highest probability expansion. The probability for each move is calculated based on step attractiveness and step trail. Trails values are automatically updated when all agents/ants complete their state transiting. An increase or decrease on trail levels indicates a good move/legitimate behavior or a bad move/malicious behavior. The results indicate that the detection rate is reaching 80%.
The authors in [44] used the Ant-Colony-Optimisation algorithm and focused on detecting low-rate (D)DoS attacks. The system firstly collects information from incoming traffic such as traffic flow, packet arrival time, packet attack rate and ar-rival time interval by manual setting. Next, the multi-agents installed in the network are working cooperatively towards the detections of malicious activity and tracking down the IP addresses of the attackers in a cooperative way. To change state, the traffic flow and time density from router to router is calculated. The proposed tech-nique can also be used to detect attacks in neighboring paths. The average detection rate is 89%.
The authors in [45] designed an Intrusion Detection System to detect attacks of the KDD99 Dataset, including various types of (D)DoS attacks using the Ant Colony Optimisation algorithm. To detect anomalies in the traffic they used IP Protocol segments, the total length of each packet, the source port and destination port in the TCP and UDP. They report that their algorithm has a precision of 96.94%.
User to Root Attacks 80.40%, for Remote To Local Attacks 54.55% and for Probe Attacks 80.01%.
1.4.6
Artificial Neural Network Studies
In most of the bio/nature-inspired studies for intrusion detection, ALRFC are used in combination with other bio/nature-inspired algorithms that their main objective is to optimise the features. Some notable studies are briefly described below.
The authors in [48] used a combination of SI and ANN to detect malicious ac-tivity in the KDD99 dataset. In detail, they have made usage of the ABC algorithm with a BP ANN in an attempt to construct an effective neural network architecture to avoid overfitting problems. The authors justify their choice through the follow-ing argument: the ABC algorithm’s objective is to optimise the BP neural network’s training process(construction of network weights and thresholds, initial training val-ues) until it reaches an acceptable accuracy. For evaluating the model they have used 10% of the KDD dataset. They report a squared error of approximately less than 0.25, while a traditional BP neural network is higher.
In [49], the authors have combined the GA along with ANN, attempting to in-crease the detection rate. The have used the Center for Applied Internet Data Analy-sis (CAIDA) dataset. The GA was used for feature selection to find the most impor-tant features from a total of 43 and exclude all the irrelevant or redundant ones. The ANN was used for detection by taking the most relevant features as inputs, using the MLP method for defining the architecture. The proposed solution had a detection rate of 99.997% and a False Positive Rate of 0.002%.
In [50], the authors designed a Neural Network IDS to detect DoS attacks with the KDD99 Dataset. They used the LVQ algorithm to structure the architecture of the neural network. They conducted the experiment 10 times using both BP and LVQ algorithms to compare results. The ANN using the LVQ algorithm achieved an average DR of 99.723% and a 0.277% FPR, while the BP-ANN achieved an average DR 89.9259% and a 0% FPR.
The authors in [51] have used ANNs and the MLP method to detect DoS attacks in the NSL-KDD dataset (11 in total). They have constructed 11 different MPL-Neural Networks one responsible for detecting each attack. They have altered the features that are normally used to train the neural network differently. Specifically, they changed the connection feature. If the ”connection” is legitimate the feature value is set to 0. If it is malicious it is set to 1-39, depending on the attack it corre-sponds to. For the flag feature instead of Boolean value they have defined 11 flags, each corresponding to a different state of the connection. Lastly, service now indi-cates 64 different kinds of services. In their results they report an average detection rate of 96.6% and a false positive rate of 3.4%
traf-fic mixed with normal traftraf-fic. They have tested their technique under five impure datasets they have created. They report the best results to have a false acceptance rate of less than 8% and the false rejection rate to be less than 5%.
The authors in [53] have used Artificial Neural Networks to detect (D)DoS at-tacks in 802.16 (WiMax) networks, which is used in the Smart Grid, The proposed system consists of three stages, feature extraction, process of the features and fea-tures forward to the Neural Network for classification. The feafea-tures extracted are the hurst parameter incoming traffic, the average bit rate of received messages, the increment bit rate of the received message, the entropy and conditional entropy of received MAC address and the amount of mutual information that use entropy and conditional entropy of the received packet. For the maximum number of subseries size (=256) the maximum true positive rate is 85% and the minimum false positive rate is 15%.
1.4.7
Artificial Immune Systems Studies
The authors in [54] used a variation of the NSA, the Neighborhood Negative Selec-tion (LRFC) algorithm to detect DoS flooding attacks focusing on the ICMP, TCP and UDP protocols, from the DARPA dataset. NSA operates as follows: Normal data are defined as self-patterns. Then a great number of random patterns is gener-ated and compared to the self-patterns. If the new genergener-ated pattern matches one of the self-pattern then it becomes a detector, otherwise it is discarded. Then, in the monitoring state if there is a match between a detector and an incoming traffic part then an anomaly is present. LRFC has two stages. The system extracts from traffic protocol type, duration of the flow, number of packets/bytes from outside to inside and vice versa. In the first stage, feature extraction takes place and then the set is used to train the algorithm. In the second stage, the LRFC algorithm is used for detection. Neighborhoods represent data, so therefore no single threshold is used to detect anomalies but rather a quantitative approach is adopted. The results indicate that the proposed system can detect the attacks in an efficient way. In detail, the TN rate has not fallen below 8.5% and the maximum value for FN rate was no more than 15%.
The authors in [55] apply the CSA (AIS) algorithms. They proposed an IDS for the Smart Grid infrastructure. The attacks considered were from the KDD99 dataset and the DoS group of attacks were included. The false positive rate (FPR) is only 0.7% while the false negative rate (FNR) is 21.02% for the clonal selection algorithm and 1.3% and 26.32% for the AIS, respectively. Their high FNR value is because of the U2R attacks so it is assumed that the proposed solution is effective against DoS attacks. U2R attack (User-to(2)-Root) is when the attacker initiates the attack as a normal user and by exploiting the systems vulnerabilities attempts to gain root privileges.
conducted, one for selecting the best attributes to pass them to the algorithm and another for the actual detection. Through a series of experiments the authors claim perfect detection rate and only 0.17 FPR.
The authors in [57] have used AIS generation algorithms in the NSL-KDD dataset. In particular, they have used Negative Selection Algorithm (NSA) and the Clonal Selection Algorithm (CSA) with different set of features at each experiment. For the NSL-KDD dataset, the authors found the following thresholds showed the most promising results: 39 features used a threshold of 20, 22 features used a thresh-old of 9, and 13 features used a threshthresh-old of 6. For 39 features the DR is 86.86 , for 22 features the DR is 77.23 and for 13 21.56.
In [58] the authors have used AIS to design a distributed IDS to detect cyber attacks in the KDD99. Two types of antibodies are constructed (through positive and negative selection), one for malicious and one for normal traffic. In practice, antibodies are formed as hyper-shpere shapes with a specific centre and radius. The centre is denoted as a vector of the values for the features chosen. Hence, Euclidean distance is adopted for affinity measurement. Furthermore, the authors used Particle Swarm Optimisation for updating the radiuses of the antigens. Through their sim-ulation experiments, it is shown that the proposed algorithm achieved 99.1% true positive rate while the false positive rate is 1.9%
The authors in [59] have developed a multiple detector which consists of various types of AIS algorithms to detect attacks from the UNB ISCX Intrusion Detection Evaluation Dataset using various features such as connection duration, protocol type, service, flag type, source and destination ports and so on. Their results show the multiple-detector set artificial immune system achieved a Detection Rate of 53.34% and a False Positive Rate of 0.20%.
The authors in [60] the authors have used Genetic Algorithm with one-point crossover instead of two to find an optimal set of features before using ML algorithms for detecting attacks from the NSL-KDD dataset. Multiple popular supervised clas-sifiers were used on the dataset such as Random Forest, Decision Trees, K-Nearest Neighbour, Naive Bayes and Bayesian Networks. The authors report Random Forest as the algorithm producing the best results. The best ML algorithm was Random Forest with 99.87% DR.
1.4.8
Chaos Theory Studies
Most of the studies making usage of chaos, also use ALRFC for the effective mal-ware and intrusions detections. Below, we briefly present some notable studies that combine Chaos Theory with ALRFC.
In [61], the authors have created a (D)DoS detection system to detect (D)DoS attacks but also be robust against legitimate bursts of traffic. They aimed to discover patterns that can define how legitimate traffic behaves. Based on their observations they developed a baseline to use it to train their neural network model to detect (D)DoS attacks.
traf-fic are represented in a space graph. These points are the mappings of a non-linear function of the input variables, which includes sequences of normal, bursty normal and normal changed to attack traffic. It is assumed that legitimate traffic diminishes asymptotically with time. However, if traffic behaves chaotically as soon as new traf-fic enters the space then it is likely there is a (D)DoS attack. They report a detection rate of 88-94 % with a false positive of 0.45-0.05 %.
Based on the findings and the methods used in [61], the authors in [62] have followed a similar approach, managing to imrpove the detection rate. In detail, they have once again used chaos theory’s lyapunov exponents in a combination with neu-ral networks to detect (D)DoS attacks. They report a 98.4% detection rate, however they don’t give any details regarding any false positive or false negative rates.
In [63], the authors again use the local Lyapunov exponent in combination with the ALRFC to detect a (D)DoS attack from the DARPA Dataset. They have used information regarding the packets flow to differentiate between (D)DoS traffic and normal burst traffic. With the results they gained they trained their Neural Network model to correctly detect (D)DoS attacks. The chaos theory model they used the AR time model to predict the network traffic and calculate the error rate. They used DARPA dataset to evaluate their work and claimed 93.75% detection rate.
1.5
Case Study: Application Layer (D)DoS Detection
Smart Homes consist of a great number of different devices, all deployed in a single network monitoring the environment, collecting and sharing important data and in-formation with the owners and other smart IoT devices and external services through internal and external networks. The node responsible for this communication is the Energy Services Interface (ESI). It acts as a bi-directional interface where informa-tion can be exchanged between the Smart Home and external do- mains. Further-more, it protects internal energy resources from security failures and ensures secure internal communication between the devices deployed in the Smart Home. ESIs im-portance to the Smart Home and in the outside domains makes it an excellent target for cyber attacks.
slow-rate attack opens a great number of connections and initiates requests that never completes them. As time is passing by, more and more connections are open and that results in the target becoming once again unresponsive.
Based on these issues and concerns, it is important to develop effective security countermeasures to detect (D)DoS attacks in such critical systems. However, the majority of devices deployed in IoT networks are low in resouces such as memory, processing power and power. Therefore, it is important for the detection algorithms to be as lightweight as possible. Since, the most popular detection algorithms used belong to Artificial Intelligence and Machine learning it is even more important since they are particularly high in complexity and need a large dataset to be trained. One effective way to reduce an algorithm’s complexity is to reduce the features. In that way, the algorithms are going to be trained faster, in less time and the model con-structed is going to be less complex. nTherefore, we have concon-structed an Smart Home IoT dataset which consists of both legitimate and Application Layer Flooding and Slow-Rate (D)DoS attacks. The dataset consists of 197 attack instances and 257 normal instances.
1.5.1
Evaluation Environment
1.5.2
NS-3 Network Simulator
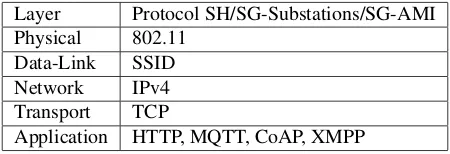
For the simulation of the Smart Home network, Network Simulator 3 (NS3) was used. Network Simulator 3 (NS3) is an open-source discrete-event simulator devel-oped in C++. A summary of the networks parameters and protocols used is given in Table 1.2 . Various IoT devices are deployed in the Home Area Network that con-nect to the gateway, called ESI, to exchange data with the Smart City infrastructures. For our IoT Smart Home network simulation, 10 nodes were simulated. 9 of them represent IoT devices and Smart Appliances and the final node forms the ESI. All simulated nodes were static, with no mobility. In the physical layer, all the connec-tions were wireless and the 802.11 protocol was used. The structure was set to ad hoc, using AODV routing protocol . In the network layer IPv4 was used and in the transport layer both UDP and TCP were used. In the application layer a wide variety of application layer protocols were simulated including CoAP, MQTT, XMPP and AMQP and HTTP.
1.5.3
Simulation of (D)DoS attacks
Table 1.2 Smart Home Protocols
Layer Protocol SH/SG-Substations/SG-AMI Physical 802.11
Data-Link SSID Network IPv4 Transport TCP
Application HTTP, MQTT, CoAP, XMPP
In order for both normal and attack traffic to be simulated, degree of randomness was added in the network packet gen- eration from the nodes. Randomness was introduced through Poisson Distribution in the following metrics, at the time a packet was created and sent from the client to the server, at the size of the packet generated from both the client and the server and at the time the server needed to respond. Different speeds were also applied in IoT nodes to service application layer requests. Hence, we can simulate slow connections that are legitimate.
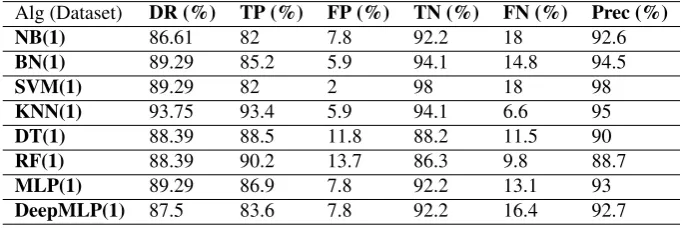
Most of the (D)DoS attacks, Flooding types in particular, can be classified as constant rate. In constant rate attacks, the attackers generate a high steady rate of traffic towards the target [5]. The impact of such an attack is fast, but it can easily be detected due to the its obvious intensity. Hence, attackers have moved towards more sophisticated ways of conducting (D)DoS attacks. One way to evade any secu-rity measures installed is to slowly but steadily flood the target in an increasing-rate attack, where the maximum impact of the attack is reached gradually over the at-tack period. To simulate increased-rate atat-tacks in NS-3, we used open random con-nections after random time-intervals. To assess the results on ForChaos algorithms effectiveness we have calculated the most popular metrics used when assessing a detection algorithms accuracy.
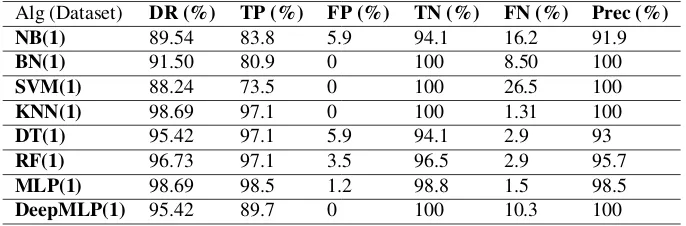
These are Detection Rate(DR), Error Rate (ER), True Positives(TP), False Pos-itives (FP), False Negatives (FN) and Precision. In intrusion detection posPos-itives in-stances are attacks and negative inin-stances are normal. DR measures the algorithms proportion in correctly classifying incoming instances and ER measures the algo-rithms proportion errors incorrectly classifying incoming instances. DR and ERs sum equals one. TP measures the proportion of positive instances that are correctly identified as such. FP measures the proportion of negative instances to have been misclassified as positive. FN measures the proportion of positive instances that have been misclassified as negative. Lastly, precision measures the proportion of relevant instances among the retrieved instances. Hence, precision measures the rate of true positives divided by all the positives, both correctly and incorrectly classified.
1.5.4
Feature Selection
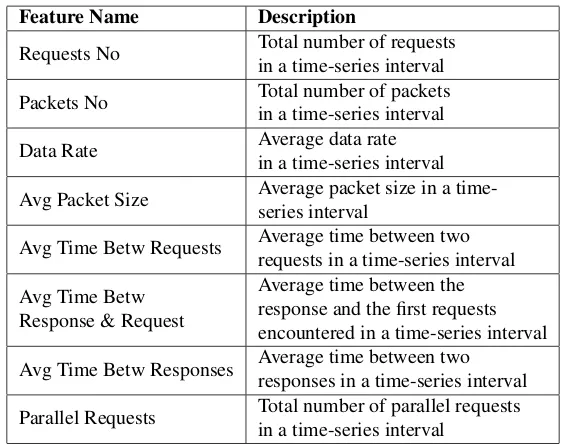
Table 1.3 List of Features
Feature Name Description
Requests No Total number of requests in a time-series interval Packets No Total number of packets
in a time-series interval Data Rate Average data rate
in a time-series interval Avg Packet Size Average packet size in a
time-series interval
Avg Time Betw Requests Average time between two requests in a time-series interval Avg Time Betw
Response & Request
Average time between the response and the first requests encountered in a time-series interval Avg Time Betw Responses Average time between two
responses in a time-series interval Parallel Requests Total number of parallel requests
in a time-series interval
attacks on lower layers and not on the application layer. The adoption of one single feature on the application layer is likely not to produce satisfactory results since Application (D)DoS attacks do not violate any protocol rules and do not produce malformed packets. Therefore we have designed a new set of features to detect Application Layer Flooding and Slow-rate (D)DoS attacks. All of the features are heavily dependent on time and form ideal features for forecasting-based algorithms and presented in Table 1.3.
1) Requests Number: In a flooding scenario the number of requests over a
period of time will be much greater compared to normal traffic request rates. In a slow-rate attack scenario the number of requests over two consecutive periods of time will have large difference. Since slow-rate opens connections to send requests after an amount of minutes there will be a pattern of low number of requests, then high number of requests, then low and so on.
2) Packets Number:In a flooding attack the number of packets on application
layer is rapidly increased over a short period of time. In a slow-rate attack the number of packets is lower due to the packets being sent slowly, just before a request can be rejected. Hence, the request stays alive but very few packets are sent.
3) Data Rate: In a flooding attack the data rate on application layer is rapidly
increased over a short period of time. In a slow-rate attack the data rate is lower due to the slow data rate of the malicious requests.
4) Average Packet Size: In a flooding attack the average packet size is
attack the average size packet is decreased since a great series of connections send small incomplete packets over the attack period of time.
5) Average Time between Requests: In a flooding attack the average time
between each request is vastly decreased due to an outburst of requests being sent over a short period of time simultaneously. In a slow-rate attack the average time between each request is decreased compared to the same value in a normal scenario. Instead, there are spikes of the number of requests being sent. When the attack is at the stage of opening new requests, their rate is increased. When the attack is at the stage of maintaining the connections open, normal subsequent packets are sent, therefore, the rate of the requests is less than the previous stage.
6) Average Time between Response and Request: In a flooding attack the
average time between a response and the next request is vastly decreased. In a slow-rate attack the average time between a response and the next request the slow-slow-rate attack causes malicious requests.
7) Average Time between Responses: In a flooding attack, the average time
between two consecutive responses is vastly decreased since a burst of requests is being sent to the server, therefore a great number of responses have to be gener-ated. In a slow-rate attack, the same feature is increased since the slow-rate attack’s requests are initiated but never completed.
8) Parallel Requests: In a flooding attack the average concurrent requests is
decreased since the attackers send multiple requests that are very quickly finished. In a slow-rate attack, many requests are initiated and stay open over a period of time and the average number of parallel open requests is large.
1.5.5
Intrusion Detection Evaluation Metrics
In the Intrusion Detection Literature, studies use an extended series of evaluation metrics and statistical tests to asses their detection engines performance. Measuring the system’s detection rate is not enough sometimes, therefore to provide a more hollistic evaluation, different metrics are adopted. In this section, we briefly describe the most popular evaluation metrics, the actual formulas and their application in Intrusion Detection. In Intrusion Detection research, the presence of a cyber attack is regarded as a positive instance and the absence of it as a negative instance.
True Positive Rate
True Positive Rater (TPR) or otherwise called Recall or Sensitivity, is when the detection algorithm is able to correclty identify an instance as an attack.
True Negative Rate
True Negative Rater (TNR) or otherwise called Specificity, is when the detection algorithm is able to correclty identify an instance as normal.
False Positive Rate
False Positive Rate (FPR), or otherwise called Fall-Out, is when the detection alglorithm has incorrectly classified an instance as an attack, with it being normal.
False Negative Rate
False Negeative Rate (FNR) is when the detection alglorithm has incorrectly classified an instance as normal, with it being an attack.