R E S E A R C H
Open Access
Effect of driving pressure on mortality in
ARDS patients during lung protective
mechanical ventilation in two randomized
controlled trials
Claude Guérin
1,2,3*, Laurent Papazian
4,5,6, Jean Reignier
7, Louis Ayzac
8, Anderson Loundou
5, Jean-Marie Forel
9and on behalf of the investigators of the Acurasys and Proseva trials
Abstract
Background:Driving pressure (ΔPrs) across the respiratory system is suggested as the strongest predictor of hospital mortality in patients with acute respiratory distress syndrome (ARDS). We wonder whether this result is related to the range of tidal volume (VT). Therefore, we investigated ΔPrs in two trials in which strict
lung-protective mechanical ventilation was applied in ARDS. Our working hypothesis was that ΔPrs is a risk factor for mortality just like compliance (Crs) or plateau pressure (Pplat,rs) of the respiratory system.
Methods: We performed secondary analysis of data from 787 ARDS patients enrolled in two independent
randomized controlled trials evaluating distinct adjunctive techniques while they were ventilated as in the low VT arm of the ARDSnet trial. For this study, we used VT, positive end-expiratory pressure (PEEP), Pplat,rs,
Crs, ΔPrs, and respiratory rate recorded 24 hours after randomization, and compared them between survivors and nonsurvivors at day 90. Patients were followed for 90 days after inclusion. Cox proportional hazard modeling was used for mortality at day 90. If colinearity betweenΔPrs, Crs, and Pplat,rs was verified, specific Cox models were used for each of them.
Results:Both trials enrolled 805 patients of whom 787 had day-1 data available, and 533 of these survived. In the univariate analysis,ΔPrs averaged 13.7 ± 3.7 and 12.8 ± 3.7 cmH2O (P= 0.002) in nonsurvivors and survivors, respectively.
Colinearity betweenΔPrs, Crs and Pplat,rs, which was expected as these variables are mathematically coupled, was statistically significant. Hazard ratios from the Cox models for day-90 mortality were 1.05 (1.02–1.08) (P= 0.005), 1.05 (1.01–1.08) (P= 0.008) and 0.985 (0.972–0.985) (P= 0.029) forΔPrs, Pplat,rs and Crs, respectively. PEEP and VTwere not
associated with death in any model.
Conclusions:When ventilating patients with low VT,ΔPrs is a risk factor for death in ARDS patients, as is Pplat,rs or Crs.
As our data originated from trials from which most ARDS patients were excluded due to strict inclusion and exclusion criteria, these findings must be validated in independent observational studies in patients ventilated with a lung protective strategy.
Trial registration: Clinicaltrials.gov NCT00299650. Registered 6 March 2006 for the Acurasys trial. Clinicaltrials.gov NCT00527813. Registered 10 September 2007 for the Proseva trial.
Keywords: ARDS, Prone position, Neuromuscular blocking agents, Driving pressure, Compliance, Plateau
pressure, Lung protective ventilation
* Correspondence:[email protected]
1Réanimation Médicale Groupement Hospitalier Nord Hospices civils de
Lyon, Lyon, France
2Université de Lyon, 1 69100, Villeurbanne, France
Full list of author information is available at the end of the article
Background
Lung protective ventilation, which is a current strong recommendation in patients with the acute respiratory distress syndrome (ARDS), includes several components, the most important of them being lowering tidal volume (VT) and limiting plateau (Pplat,rs) equal to or below 30 cm H2O. This combined strategy is indeed the single ventilator intervention that has been shown to signifi-cantly improve survival so far [1]. This trial introduced scaling of VTto the predicted body weight. However, in the lower VTgroup with the significant improvement in survival, VTwas not strictly set to 6 ml/kg but may have been accommodated in the range 4–8 ml/kg. VTis equal to the difference between plateau (Pplat,rs) and total positive end-expiratory pressure (PEEPtot,rs) measured at zero flow divided by the compliance of the respiratory system (Crs). The difference between Pplat,rs and PEEP-tot,rs is the driving pressure (ΔPrs). Therefore, using
ΔPrs to select VT is equivalent to titrating VTfor Crs, as VTis equal toΔPrs divided by Crs.
The first report suggesting thatΔPrs is associated with mortality came from the study by Amato et al. [2]. Recently a retrospective analysis of several trials in patients with ARDS comparing different PEEP levels at the same VTor different VT levels at the same PEEP, or a combination of both, found that ΔPrs is the stronger predictor of mortality as compared with Pplat,rs [3]. Furthermore, the relative risk of mortality significantly increased above a threshold in the vicinity of 15 cm H2O. It is important to emphasize at this point that the threshold of a driving pressure of 14 or 15 cmH2O to predict outcome or titrate VT has not been validated or confirmed. With the aim of attempting to confirm this finding, we also wondered whether this result may be due to the wide range of VT used across the trials included. To try to answer this question, we investigated
ΔPrs from two trials [4, 5] in which strict lung-protective mechanical ventilation, in particular 6 ml/kg predicted body weight VT, was applied to patients with ARDS. Our working hypothesis was that ΔPrs was asso-ciated with death, just like compliance (Crs) or Pplat,rs.
Methods
This is a secondary analysis of patients enrolled in two previously published randomized controlled trials, namely Acurasys [4] and Proseva [5]. The first trial com-pared the neuromuscular blocking agent (NMBA) cisa-tracurium to placebo and the second compared the prone to the supine position. Both had similar inclusion criteria (notably early ARDS and partial pressure of oxygen in arterial blood (PaO2)/oxygen fraction in air (FIO2) <150 mm Hg under PEEP≥5 cm H2O) and simi-lar lung-protective mechanical ventilation (in particusimi-lar 6 ml/kg predicted body weight VT, limited Pplat,rs and
PEEP/FIO2table [1]). ARDS was identified based on the American-European consensus definition criteria [6]. Both trials identified significant survival benefit in the experimental group.
From the case report form of each original trial, we extracted the relevant variables for the present study, namely sequential organ failure assessment (SOFA) score, continuous NMBA infusion, prone position, pH, partial pressure of carbon dioxide in arterial blood (PaCO2), PaO2/FIO2, lactate, respiratory rate, VT, PEEP, Pplat,rs, Crs andΔPrs, which were recorded at day 1 as the values corresponding to those gathered 24 hours after randomization in each trial. In addition, we used gender, age and simplified acute physiology score (SAPS) II recorded at the time of admission and compared between survivors and nonsurvivors at day 90. The allo-cation assignment in the two trials was entered as prede-fined covariates into the models. Furthermore, as recent experimental data suggest that the amount of energy transferred from the ventilator into the lung may be a contributing factor to ventilator-induced lung injury (VILI) [7], we computed the mechanical power asΔPrs × VT× respiratory rate. It was expressed as J/min and was included in the analysis in the present study.
Descriptive statistics included percentages for categor-ical variables and means and standard deviation (SD) for continuous variables and were compared using nonpara-metric tests. Cox proportional hazard models were used with covariates significantly different between survivors and non survivors at the threshold of 0.20 and mortality at day 90 as the dependent variable. Even though ΔPrs, Crs, and Pplat,rs are mathematically coupled, we planned to formally test the collinearity within them and, if verified, to use a specific Cox model for each. Because pH and lactate interact, we used their inter-action term in the Cox models. We also included those collinear variables two-by-two into four additional Cox regression models, besides the other covariates. One model pertained to Pplat,rs and ΔPrs, one to Crs and
ΔPrs, one to ΔPrs and mechanical power, and one to Crs and Pplat,rs. Two interpretations of the results could
a priori be deciphered. If both variables in the couple lacked significance, the conclusion could be that the same information was carried by each component of the couple. If one of the variables in the couple remained significantly correlated with survival, this variable would be more informative than the other in the couple. Univariate and multivariate Cox propor-tional hazard regression models were used to estimate the hazard ratio (HR).
We split ΔPrs into five quintiles of almost 150 patients each following the method used in both the Amato [3] and the Lung Safe [8] studies by using the Ntiles func-tion in SPSS software. Comparison between quintiles was made by analysis of variance (ANOVA) with post-hoc comparison from the first quintile performed using the Tukey test. A pvalue <0.05 was considered signifi-cant. The statistical analysis was conducted using IBM SPSS Statistics, version 20.0 (IBM SPSS Inc., Chicago, IL, USA).
Results
A total of 805 patients were included in the two trials, of these patient, 787 had data available at day 1. There were 533 survivors and 254 non-survivors at day 90 (mortality rate 32.3% for the combined trials). The comparison between survivors and non survivors at day 90 is shown in Table 1.
As the collinearity between ΔPrs, mechanical power, Pplat,rs and Crs was statistically significant, a Cox model was constructed for each of these variables. The Cox model pertaining to ΔPrs is shown in Table 2. Age, SOFA, prone position, pH, lactate, pH and its interaction with lactate and ΔPrs were significantly associated with the outcome at day 90 whilst NMBA was not. For each
of the additional three Cox models that included mech-anical power, Pplat,rs, or Crs as a single covariable, the significant predictors of patient outcome were the same as forΔPrs (see additional files 1, 2 and 3). The HR was high for lactate in each Cox model, with wide confidence intervals (Table 2 and Additional files 1, 2 and 3). After multiple adjustments of coupled variables, four add-itional Cox models were performed (Addadd-itional file 4).
ΔPrs and Pplat,rs remained significantly associated with patient outcome, meaning that each of them brought specific and distinct information (model 1 in Additional file 4). ForΔPrs and mechanical power,ΔPrs maintained a significant association with mortality at day 90, and hence carries specific information (model 2 in Additional file 4). However, for ΔPrs and Crs, and for Pplat,rs and Crs (models 3 and 4, respectively, in Additional file 4), neither of the variables in each pair were statistically significant. Therefore, it could be concluded that ΔPrs and Crs, on one hand, and Pplat,rs and Crs on the other hand, share the same information.
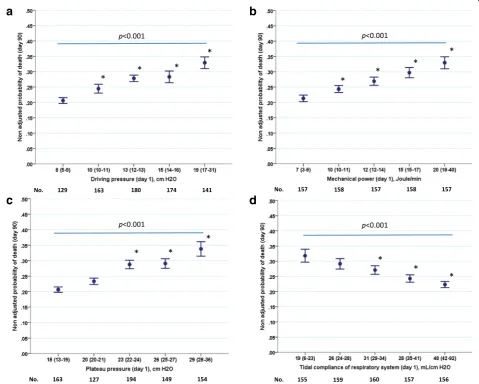
[image:3.595.61.539.415.681.2]Figure 1 displays the unadjusted mortality rates at day 90 across five quintiles of ΔPrs (Fig. 1a), mechanical power (Fig. 1b), Pplat,rs (Fig. 1c) and Crs (Fig. 1d). No distinct threshold ofΔPrs was identified (Fig. 1).
Table 1Characteristics at the time of inclusion or day 1 between survivors and non-survivors at day 90
Variables All (n= 787) Survivors (n= 533) Nonsurvivors (n= 254) P
Male gender 542 (68.9) 366 (68.7) 176 (69.3) 0.923
Age, years 59 ± 16 56 ± 15 66 ± 14 <0.001
SAPS II on ICU admission 45 ± 15 45 ± 16 51 ± 15 <0.001
SOFA score on day 1 7 ± 4 7 ± 4 9 ± 4 <0.001
Continuous NMBA as allocation group 173 (22.0) 117 (22.0) 56 (22.0) 0.976
Prone position as allocation group 233 (34.4) 181 (34.0) 52 (20.5) <0.001
Arterial pH on day 1 7.35 ± 0.09 7.36 ± 0.08 7.32 ± 0.10 <0.001
PaCO2on day 1, mmHg 47 ± 11 46 ± 11 47 ± 11 0.076
PaO2/FIO2ratio on day 1 159 ± 74 163 ± 76 152 ± 68 0.056
Lactate on day 1, mmol/L 2.0 ± 1.9 1.8 ± 1.6 2.4 ± 2.2 <0.001
Respiratory rate on day 1,/minute 27 ± 6 26 ± 5 27 ± 6 0.010
Tidal volume on day 1, ml 397 ± 76 398 ± 76 395 ± 78 0.413
Tidal volume on day 1, ml/PBW kg 6.3 ± 0.8 6.2 ± 0.8 6.3 ± 0.8 0.691
PEEP on day 1, cm H2O 10 ± 3 10 ± 3 10 ± 3 0.210
Plateau pressure on day 1, cm H2O 23 ± 4 23 ± 4 24 ± 4 <0.001
Tidal compliance on day 1, ml/cm H2O 33 ± 12 34 ± 12 31 ± 12 0.016
Driving pressure on day 1, cm H2O 13 ± 4 13 ± 4 14 ± 4 0.002
Mechanical power on day 1, J/min 13.4 ± 5.0 13.0 ± 4.8 14.3 ± 5.4 <0.001
The Kaplan-Meier graphs describing the probability of survival from inclusion to 90 days for ΔPrs above or below 13 cm H2O and for mechanical power above or below 12 J/min at day 1 are shown in Fig. 2. The survival was significantly higher in patients with
ΔPrs ≤13 cm H2O at day 1 than in those with ΔPrs >13 cm H2O and in patients with mechanical power
≤12 J/min at day 1 than in those with mechanical power >12 J/min. Survival was significantly higher in patients with Pplat,rs <23 cm H2O than in those with Pplat,rs ≥23 cm H2O and higher in patients with Crs <31 ml/cmH2O than in those with Crs
≥31 ml/cmH2O (see Additional file 5).
Whereas the unadjusted probabilities of survival were linearly related to quintiles of ΔPrs, mechanical power, Pplat,rs, and Crs (Fig. 1), their corresponding adjusted counterparts displayed a threshold in the vicinity of 15 cmH2O, 15 J/min, 26 cmH2O, and 26 ml/cmH2O, respectively (Fig. 3). The adjusted survival curves derived from the Cox regression analysis are shown for ΔPrs and mechanical power (see Additional file 6) and for Pplat,rs and Crs (see Additional file 7).
Discussion
The main findings of the present study in our unique cohort were that: (1) ΔPrs was significantly associated with patient outcome after controlling for confound-ing factors, (2) survival was significantly higher in
patients with ΔPrs ≤13 cm H2O at day 1, (3) survival was significantly higher in patients with mechanical power ≤12 J/min at day 1 and in patients with Pplat < 23 cmH2O, and (4) the information given by ΔPrs and Crs is similar. Our main finding was that with VT and Pplat controlled, ΔPrs brings little more add-itional information independently on Pplat and Crs.
Driving pressure
Rather than confirming the results of Amato et al. [3], the present findings disclosed the limitation of the prognostic role of ΔPrs when Plat,rs, VT, and PEEP are strictly controlled and set according to the ARMA trial. However, we found that the HR of ΔPrs was similar in Amato’s study and in the present in-vestigation. In Amato’s study, in the Cox analysis
ΔPrs was associated with 41% increased risk of mor-tality among the 3080 patients used in the combined analysis [3]. In this study, the authors used a 1-SD increment in ΔPrs for calculating HR, which repre-sented 7 cmH2O. Thus, when calculating the HR for 1 cmH2O increment, this was associated with a HR of 1.049, which is very close to the present result, as shown in Table 2.
[image:4.595.57.290.120.310.2]In our study, per each cm H2O increase, ΔPrs was associated with 5% increase in the risk of death, which is in the same order of magnitude as Pplat,rs, which was also significantly associated with mortality. PEEP and VT were not significantly associated with mortality in the present cohort, whilst these were associated with a significant 2% and 3% increase in mortality per 1 cm H2O and per 1 ml/kg PBW, re-spectively, in Amato’s study [3]. This can be explained by the narrower range of PEEP and VT used in our cohort. Therefore, in contrast to Amato’s study [3] our findings did not identify ΔPrs as the strongest predictor of death as compared to VT, Crs, and Pplat,rs. To explore this finding further, we used a model-building strategy that consisted of a series of Cox models, which included the collinear variables two-by-two (with their interaction) and these were then compared with the corresponding Cox models that used the collinear variable alone. This strategy showed that ΔPrs and Pplat,rs each provides different information related to patient outcome. However, interaction between them was present, statistically meaning that the effect of each of them on outcome was dependent on the level of the other. In other words, the effect of one covariate modifies the effect of the other on the outcome. WhenΔPrs and mechanical power were analyzed two-by-two, ΔPrs remained signifi-cant but mechanical power did not. That means thatΔPrs conveys specific information. When ΔPrs and Crs were analyzed together neither of them remained statistically
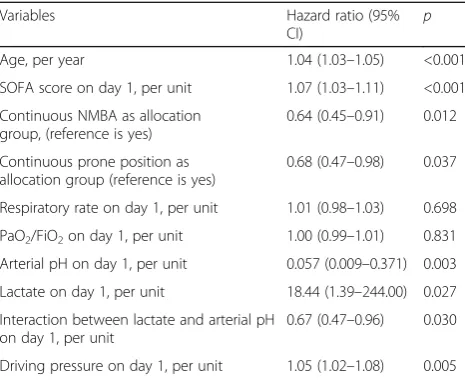
Table 2Multivariate Cox regression analysis for factors including driving pressure at day 1 associated with ARDS mortality at day 90
Variables Hazard ratio (95%
CI) p
Age, per year 1.04 (1.03–1.05) <0.001
SOFA score on day 1, per unit 1.07 (1.03–1.11) <0.001
Continuous NMBA as allocation group, (reference is yes)
0.64 (0.45–0.91) 0.012
Continuous prone position as allocation group (reference is yes)
0.68 (0.47–0.98) 0.037
Respiratory rate on day 1, per unit 1.01 (0.98–1.03) 0.698
PaO2/FiO2on day 1, per unit 1.00 (0.99–1.01) 0.831
Arterial pH on day 1, per unit 0.057 (0.009–0.371) 0.003
Lactate on day 1, per unit 18.44 (1.39–244.00) 0.027
Interaction between lactate and arterial pH on day 1, per unit
0.67 (0.47–0.96) 0.030
Driving pressure on day 1, per unit 1.05 (1.02–1.08) 0.005
significantly associated with patient outcome. That means that the same information carried by Crs is also carried by
ΔPrs. Both shared the same information. The same result, and hence, the same interpretation also applied for Pplat,rs and Crs.
The Lung Safe study [8] was a prospective inter-national observational investigation in 50 countries, in which data were collected for over 2377 patients with ARDS in the winter season. In 703 of these patients data were available to analyze the rate of mortality at the time of hospital discharge over the range of ΔPrs and Pplat,rs. The mortality rate increased linearly with increasing ΔPrs with no threshold. The slope of the increase in mortality over ΔPrs quintiles was steeper than that pertaining to Pplat,rs in the Lung safe study, whereas the slopes were similar in the present study. However, VT was not maintained at
[image:5.595.58.538.90.474.2]6 ml/kg in these two studies [3, 8] which is at vari-ance with the present study. Furthermore, in the Lung Safe study Pplat,rs was measured in only 40% of the patients [8], a fact that has been highlighted [9, 10].
ΔPrs ranged between 5 and 31 cm H2O in our cohort (Fig. 1), which is comparable to the range of 7–32 cm H2O in the Amato study, but wider than in the Lung Safe study (9–25 cm H2O). It should be stressed that in the Amato study [3] the effect ofΔPrs was related to the adjusted relative risk of death, whereas in our study, as in the Lung Safe study, the probability of death was analyzed. Moreover only patients with a P/F ratio <150 mmHg were included. ΔPrs was also reported to be associated with death in a recent large multicenter cohort of patients with ARDS who had acute cor pulmo-nale [11].
a
b
c
d
A more relevant analysis of the data on ΔPrs would require the knowledge of the transpulmonary ΔP (ΔPL). Talmor et al. found that the reduction in ΔPL was higher in an esophageal pressure-guided group than in a control group, and that ΔPL reduction was higher in survivors than in nonsurvivors, whereas
ΔPrs was similar in both experimental and control groups and in survivors and nonsurvivors [12], con-firming that the compliance of the chest wall is a key parameter in interpreting ΔPrs and its components.
The role of ΔPL to optimize the use of mechanical ventilation in the prone position should be further in-vestigated, in particular regarding PEEP selection [13], by using a physiological approach [14].
Mechanical power
The concept that the magnitude of energy trans-ferred from the ventilator into the lung may contrib-ute to VILI has recently arisen and has been confirmed in an experimental study in normal pigs receiving a combination of a large number of VTand respiratory rates [15]. In this study mechanical power of 12 J/min was found to promote VILI. In the present study, our secondary goal was to explore whether the mechanical power was associated with the outcome. We found that this was the case and the threshold of 12 J/min was associated with signifi-cant distinct probabilities of survival. Interestingly, the median value of mechanical power in the present cohort was the same as that found experimentally as the threshold above which VILI occurred [15]. We also found that the value of the mechanical power in J/min was very close to that of ΔPrs in cm H2O. The relevance of the present data on mechanical power should be confirmed by further investigations. Should mechanical power be confirmed as a signifi-cant independent predictor of survival its computa-tion at the bedside should be recommended. Recently, Gattinoni et al. [16] proposed using the first-order equation to compute mechanical power. Our present approach is much simpler and can be easily implemented at the bedside.
The probability of survival in our study was expressed as unadjusted and adjusted, taking into account the covariates selected by the Cox models. This explains the difference between the data shown in Fig. 1 and Fig. 3. In the former, a linear relationship was observed between survival and ΔPrs, mechanical power, Pplat,rs and Crs. This suggests there is no safe dose of mechan-ical ventilation. However, when the survival was adjusted with covariates, a threshold was disclosed for the sur-vival across quintiles.
Limitations and strengths
Our study was limited by: (1) the fact that data were collected from two positive trials where survival was markedly affected by the experimental approach sub-jected to randomization; (2) as in other trials in patients with ARDS, more than 60% of patients meeting the criteria for ARDS were excluded from enrollment into the trials; and (3) lack of generalizability, as patients with PaO2/FiO2 > 150 mmHg at 24 hours were excluded from the analysis. However, as discussed previously, our ARDS sample was more homogeneous in terms of the Fig. 2Kaplan-Meier graphs of the probability of survival for 90 days
[image:6.595.57.291.82.541.2]ventilator settings used and the present results were highly significant.
Clinical implications
The main clinical message from our data is that if VT and Pplat,rs are strictly maintained to 6 ml/kg pre-dicted body weight and below 28–30 cmH2O, ΔPrs shares the same information as Pplat,rs about the association with day 90-mortality. Management of patients with ARDS is an ongoing process that com-bines physiologic [14] and pragmatic information [17]. The use of ΔPrs to manage patients as a therapeutic target should be part of the research agenda in ARDS [18]. However, better knowledge of the physiologic meaning of ΔPrs is mandatory, to make sure that
ΔPrs is a relevant tool to set the ventilator adequately in ARDS patients, as it has been done for PEEP selec-tion [19–23]. As an example, it has been shown that
ΔPrs correlates with lung stress and, hence could detect over-distension [24].
Conclusions
When lung protective mechanical ventilation is applied to patients with ARDS, ΔPrs, Crs, and Pplat were risk factors for mortality.
Additional files
Additional file 1: Table S1.Multivariate Cox regression analysis for factors on day 1 including mechanical power associated with ARDS mortality at day 90. (DOC 33 kb)
Additional file 2: Table S2.Multivariate Cox regression analysis for factors on day 1 including plateau pressure associated with ARDS mortality at day 90. (DOC 33 kb)
Additional file 3: Table S3.Multivariate Cox regression analysis for factors on day 1 including compliance of the respiratory system associated with ARDS mortality at day 90. (DOC 33 kb)
a
b
c
d
[image:7.595.58.540.93.466.2]Additional file 4: Table S4.Multivariate Cox regression analysis for factors on day 1 including a couple of collinear variables associated with ARDS mortality at day 90. (DOCX 19 kb)
Additional file 5: Figure S1.Kaplan-Meier graphs of the probability of survival over 90 days after inclusion of patients with ARDS according to Pplat,rs and Crs. The curves were compared by using the log rank test. (PPTX 92 kb)
Additional file 6: Figure S2.Adjusted probability of survival derived from the Cox model according toΔPrs (A) and mechanical power (B). (PPTX 89 kb)
Additional file 7: Figure S3. Adjusted probability of survival derived from the Cox model according Pplat,rs (A) and Crs (B). (PPTX 90 kb)
Abbreviations
Crs:compliance of the respiratory system; FIO2: oxygen fraction in air; HR: hazard ratio; NMBA: neuromuscular blocking agent; PaCO2: artial pressure of carbon dioxide in arterial blood; PaO2: partial pressure of oxygen in arterial blood; PEEP: positive end-expiratory pressure; PEEPtot,rs: total peep of the respiratory system; pH: potential of hydrogen; Pplat,rs: plateau pressure of the respiratory system; SAPS: simplified acute physiology score; SD: standard deviation; SOFA: sequential organ failure assessment; VILI: ventilator-induced lung injury; VT: tidal volume;
ΔPL: transpulmonary driving pressure;ΔPrs: driving pressure of the respiratory system
Acknowledgements
The authors would like to thank all the clinicians and their team involved in both the Acurasys and Proseva trials.
Funding
Funding was from PHRC regional 2004 for the Acurasys trial and PHRC national 2006 and 2010 for the Proseva trial from the French ministry of health in France.
Availability of data and materials No.
Authors’contributions
CG had the idea of study and made substantial contributions to conception and design, and drafted the manuscript. LP made substantial contributions to conception and design, and analysis and interpretation of data, and reviewed the manuscript. JR was involved in drafting the manuscript and revising it critically for important intellectual content. LA made substantial contributions to acquisition of data, and analysis and interpretation of data. AL made substantial contributions to conception and design, acquisition of data, and analysis and interpretation of data. JMF made substantial contributions to conception and design, and analysis and interpretation of data, and reviewed the manuscript. All authors read and approved the final manuscript.
Competing interests
The authors declare that they have no competing interests.
Consent for publication Not applicable.
Ethical approval and consent to participate
Obtained from the ethics committee of the Marseille University Hospital (Comité Consultatif de Protection des Personnes dans la Recherche Biomédicale) for the Acurasys trial and from Comité Consultatif de Protection des Personnes dans la Recherche Biomedicale Sud-Est IV, Lyon, for the Proseva trial. We had all necessary consent from any patients involved in both the original trials.
Author details
1
Réanimation Médicale Groupement Hospitalier Nord Hospices civils de Lyon, Lyon, France.2Université de Lyon, 1 69100, Villeurbanne, France. 3Institut Mondor de Recherche Biomédicale, INSERM 955 Equipe 13, Créteil,
France.4Hôpitaux de Marseille Hôpital Nord Réanimation des Détresses
Respiratoires et des Infections Sévères, Marseille 13015, France.5Aix-Marseille University EA 3279 Research Unit Department of Public Health Medecine School University Marseille, Marseille, France.6URMITE UMR CNRS 7278, Marseille 13005, France.7Réanimation Médicale CHU de Nantes, Nantes, France.8Centre de Coordination et de Lutte Contre les Infections Nosocomiales Sud-Est, Saint-Genis Laval, France.9Hôpitaux de Marseille Department of Research and Innovation Support Unit for clinical research and economic evaluation, Marseille 13005, France.
Received: 17 August 2016 Accepted: 2 November 2016
References
1. ARDSnet. Ventilation with lower tidal volumes as compared with traditional tidal volumes for acute lung injury and the acute respiratory distress syndrome. The Acute Respiratory Distress Syndrome Network. N Engl J Med. 2000;342(18):1301–8.
2. Amato MB, Barbas CS, Medeiros DM, Magaldi RB, Schettino GP, Lorenzi-Filho G, Kairalla RA, Deheinzelin D, Munoz C, Oliveira R, et al. Effect of a protective-ventilation strategy on mortality in the acute respiratory distress syndrome. N Engl J Med. 1998;338(6):347–54.
3. Amato MB, Meade MO, Slutsky AS, Brochard L, Costa EL, Schoenfeld DA, Stewart TE, Briel M, Talmor D, Mercat A, et al. Driving pressure and survival in the acute respiratory distress syndrome. N Engl J Med. 2015;372(8):747–55.
4. Papazian L, Forel JM, Gacouin A, Penot-Ragon C, Perrin G, Loundou A, Jaber S, Arnal JM, Perez D, Seghboyan JM, et al. Neuromuscular blockers in early acute respiratory distress syndrome. N Engl J Med. 2010;363(12):1107–16.
5. Guerin C, Reignier J, Richard JC, Beuret P, Gacouin A, Boulain T, Mercier E, Badet M, Mercat A, Baudin O, et al. Prone positioning in severe acute respiratory distress syndrome. N Engl J Med. 2013;368(23):2159–68. 6. Bernard GR, Artigas A, Brigham KL, Carlet J, Falke K, Hudson L, Lamy M,
Legall JR, Morris A, Spragg R. The American-European Consensus Conference on ARDS. Definitions, mechanisms, relevant outcomes, and clinical trial coordination. Am J Respir Crit Care Med. 1994;149(3):818–24. 7. Cressoni M, Gotti M, Chiurazzi C, Massari D, Algieri I, Amini M,
Cammaroto A, Brioni M, Montaruli C, Nikolla K, et al. Mechanical power and development of ventilator-induced lung injury. Anesthesiology. 2016;124(5):1100–8.
8. Bellani G, Laffey JG, Pham T, Fan E, Brochard L, Esteban A, Gattinoni L, van Haren F, Larsson A, McAuley DF, et al. Epidemiology, patterns of care, and mortality for patients with acute respiratory distress syndrome in intensive care units in 50 countries. JAMA. 2016;315(8):788–800.
9. Villar J, Kacmarek RM. Concerns about LUNG-SAFE: response to the letter to the Editor of Critical Care by Bellani et al. Crit Care. 2016;20:296.
10. Villar J, Schultz MJ, Kacmarek RM. The LUNG SAFE: a biased presentation of the prevalence of ARDS! Crit Care. 2016;20(1):108.
11. Mekontso Dessap A, Boissier F, Charron C, Begot E, Repesse X, Legras A, Brun-Buisson C, Vignon P, Vieillard-Baron A. Acute cor pulmonale during protective ventilation for acute respiratory distress syndrome: prevalence, predictors, and clinical impact. Intensive Care Med. 2016;42(5):862–70. 12. Baedorf Kassis E, Loring SH, Talmor D. Mortality and pulmonary mechanics
in relation to respiratory system and transpulmonary driving pressures in ARDS. Intensive Care Med. 2016;42(8):1206–13.
13. Beitler JR, Guerin C, Ayzac L, Mancebo J, Bates DM, Malhotra A, Talmor D. PEEP titration during prone positioning for acute respiratory distress syndrome. Crit Care. 2015;19:436.
14. Gattinoni L, Carlesso E, Santini A. Physiology versus evidence-based guidance for critical care practice. Crit Care. 2015;19 Suppl 3:S7. 15. Cressoni M, Gotti M, Chiurazzi C, Massari D, Algieri I, Amini M, Cammaroto
A, Brioni M, Montaruli C, Nikolla K, et al. Mechanical power and development of ventilator-induced lung injury. Anesthesiology. 2016. 16. Gattinoni L, Tonetti T, Cressoni M, Cadringher P, Herrmann P, Moerer O,
19. Chiumello D, Cressoni M, Carlesso E, Caspani ML, Marino A, Gallazzi E, Caironi P, Lazzerini M, Moerer O, Quintel M, et al. Bedside selection of positive end-expiratory pressure in mild, moderate, and severe acute respiratory distress syndrome. Crit Care Med. 2014;42(2):252–64. 20. Chiumello D, Cressoni M, Colombo A, Babini G, Brioni M, Crimella F,
Lundin S, Stenqvist O, Gattinoni L. The assessment of transpulmonary pressure in mechanically ventilated ARDS patients. Intensive Care Med. 2014;40(11):1670–8.
21. Chiumello D, Guerin C. Understanding the setting of PEEP from esophageal pressure in patients with ARDS. Intensive Care Med. 2015.
22. Chiumello D, Marino A, Brioni M, Cigada I, Menga F, Colombo A, Crimella F, Algieri I, Cressoni M, Carlesso E, et al. Lung recruitment assessed by respiratory mechanics and computed tomography in patients with acute respiratory distress syndrome. What is the relationship? Am J Respir Crit Care Med. 2016;193(11):1254–63.
23. Cressoni M, Chiumello D, Carlesso E, Chiurazzi C, Amini M, Brioni M, Cadringher P, Quintel M, Gattinoni L. Compressive forces and computed tomography-derived positive end-expiratory pressure in acute respiratory distress syndrome. Anesthesiology. 2014;121(3):572–81.
24. Chiumello D, Carlesso E, Brioni M, Cressoni M. Airway driving pressure and lung stress in ARDS patients. Crit Care. 2016;20:276.
• We accept pre-submission inquiries
• Our selector tool helps you to find the most relevant journal • We provide round the clock customer support
• Convenient online submission • Thorough peer review
• Inclusion in PubMed and all major indexing services • Maximum visibility for your research
Submit your manuscript at www.biomedcentral.com/submit