European Commission
Directorate-General for Research
Science and Society
She Figures 2006
Women and Science
Statistics and Indicators
LEGAL NOTICE
Neither the European Commission nor any person acting on behalf of the Commission is responsible for the use which might be made of the following information.
A great deal of additional information on the European Union is available on the Internet.
It can be accessed through the Europa server (http://europa.eu.int).
Cataloguing data can be found at the end of this publication.
Luxembourg: Office for Official Publications of the European Communities, 2006
ISBN 92-79-01566-4
© European Communities, 2006
Reproduction is authorised provided the source is acknowledged.
Printed in Belgium
PRINTED ON WHITE CHLORINE-FREE PAPER
Europe Direct is a service to help you find answers to your questions about the European Union
The concept of She Figuresoriginally came about thanks to the considerable efforts mobilised by various stake-holders, especially the Helsinki Group on Women and Science and its sub-group of Statistical Correspondents. The first issue, She Figures 2003, broadened the existing base of descriptive statistics and crucially, provided easy access to data on the participation of women as graduates, researchers, academic staff, funding beneficiaries and scientific board members. This second issue of She Figurescontinues that valuable work and also allows us to see how the participation of women is evolving in the enlarged European Union of 25 Member States and in seven countries associated to the 6th Framework Programme for Research and Development.
She Figures 2006shows that women remain a minority among researchers in the EU (29% in 2003, a slight increase from 27% in 1999), but that the number of women in research is increasing (plus 4%, compared to 2.4% for men). This represents an increase of some 140,000 researchers in the period, of which 39% were women. While this indicates a continued positive trend overall, we should not forget that women remain underrepresented in science, especially in leading positions.
It is vital that we build upon this progress and continue our efforts in gender mainstreaming and monitoring.
Women’s increasing participation in the European Research Area is integral to its success. There can be no room for gender bias if the EU is to move towards the 3%
objective and achieve the knowledge based economy that is so essential for the sustained competitiveness of Europe.
JANEZ POTOČNIK
Commissioner for Science and Research
Acknowledgements
She Figures 2006is the outcome of a co-ordinated working effort, which has benefited from the expertise of many individuals across Europe. I would particularly like to thank the following women and men who have all made valuable contributions to this booklet:
•The Statistical Correspondents of the Helsinki Group on Women and Science for providing data and technical
advice (see names in annex 6).
•Birgitta Andrén, Simona Frank, August Götzfried, Anne Paternoster, Pierre Regnard, Veijo Ritola, and Håkan Wilén
at Eurostat for providing data and advice.
•Laudeline Auriol at OECD for providing valuable input and advice.
•Joyce Hill, former UK member of the Helsinki Group on Women and Science for drafting the texts.
•Emmanuel Boudard, Marge Fauvelle and Stephen Parker from different units of the Directorate-General for
Research for advice and editorial comments.
•Robert O’Meara of the Women and Science Unit for practical support.
•Deirdre Furlong and Camilla Gidlöf-Regnier of the Women and Science Unit for impetus and overall co-ordination
of this project.
Executive summary
She Figures 2006 is the second publication of selected EU
employment statistics disaggregated by sex and supplemented by certain other complementary data, which provide illuminat-ing perspectives on the current employment situation of male and female scientists and researchers. The series was launched in 2003 by the Women and Science Unit of the Directorate General for Research in order to establish a rolling record that would be useful in mapping progress towards gender equality. The She
Figures booklet follows the format of another DG Research
statistical publication, Key Figures, which looks at investment and performance in the knowledge based economy, including data on human resources in R&D. Above all, it was intended that the series would provide systematic evidence of gender imbalances for which policy intervention might be appropriate at EU and/or at Member State level. A subsidiary aim was to promote the collection of sex disaggregated statistics for a wide range of indicators. She Figures 2006presents a number of analyses that were not available for She Figures 2003. There are, however, still important gaps in the data presented here, but the patterns of horizontal and vertical segregation by sex are strongly present in all of the evidence analysed.
The publication supports EU’s policy for strengthening the European knowledge economy, and so the analysis deals only with professionals who have a tertiary level of education1. Detailed attention is given to those employed within the science and technology fields, as broadly defined, and even more par-ticularly still to those employed as researchers. Gender imbal-ance is known to be a serious issue in these areas of employ-ment, and the analysis confirms this to be so. In addition, there is clear evidence that women are under-deployed in research generally and in S&T specifically, have poorer access to R&D resources, receive lower pay on average, and have a dispropor-tionately lower chance than men of reaching senior levels or holding positions of influence, for example through member-ship of scientific boards. This persistent pattern of disadvantage or relative exclusion raises large questions about social justice and the nature of the current research environment. More par-ticularly, the figures suggest that the EU’s research capacity will be difficult to sustain and impossible to increase according to the ambitious plans that have been set, if intellectual resources are not drawn from those with appropriate abilities and attain-ment on a more equitable basis than they are at present.
Women made up only 29% of those employed as scientists and engineers in 2004, and the growth rate in their participation between 1998 and 2004 was lower than that of men, so that, if this trend continues, the differential between men and women in this occupational group will widen. Other differences are sim-ilarly pronounced:
• across the EU as a whole, only 29% of researchers are women
• only 18% of researchers in the business and enterprise sector are women, even though this is the largest R&D sector in most countries, and the one that will need to provide two-thirds of the finance to meet the EU target of 3% of GDP devoted to R&D by 2010 (an increase that will in total require some 700,000 additional researchers2)
• in higher education, only 15% of those at the highest aca-demic grade (grade A) are women
• the gender imbalance at the senior grade is even greater in engineering and technology, where the proportion of women is just 5.8%
• of the 17 Member States that have provided data, there are only two where the proportion of female members of scientif-ic boards is over 40%; only one in the range 30-39%; and five in the range 20-29%, with all the rest below 20%.
The graphs and figures, together with the interpretative com-mentary, make available an array of indicative evidence in acces-sible form, questions are posed, the need for further analysis is pointed out, and attention is drawn to opportunities for target-ed policy development. There are many areas in which it would be beneficial to have information from a greater number of Member States, and areas of employment in which it would be useful to have more systematic and comprehensive data so that the dynamics of gendered employment choices and career tra-jectories might be better understood. This is particularly so in relation to the key sector of business and enterprise. But, despite these current limitations, the She Figuresare now established as a benchmarking tool and an instrument in policy development which can be anticipated being further refined as the quality and availability of disaggregated data continue to improve.
2 Communciation from the Commission “Investing in research: an action plan for Europe”.
9
Table
List of tables and figures
10
General Introduction
12
Chapter 1
Critical mass
16
Chapter 2
Scientific fields
33
Chapter 3
Seniority
49
Chapter 4
Setting the scientific agenda
65
Annex 1
Data relating to Chapter 176
Annex 2
Data relating to Chapter 282
Annex 3
Data relating to Chapter 387
Annex 4
Data relating to Chapter 492
Annex 5
Methodological Notes95
Annex 6
The Helsinki Group on Women & Science - List of Statistical Correspondents107
References
110
10
List of tables and figures
Chapter 1 Critical mass
Figure 1.1 Proportion of women in the EU-25 for total employment, tertiary educated and employed (HRSTC) and scientists & engineers in
2004, growth rates for men and women 1998-2004 20
Figure 1.2 Proportion of female PhD (ISCED 6) graduates 2003 21
Figure 1.3 Growth rates of PhD (ISCED 6) graduates by sex, 1999-2003 22
Figure 1.4 Employed professionals and technicians (HRSTC) as a percentage of tertiary educated (HRSTE) by sex, 2004 23
Figure 1.5 Proportion of scientists and engineers in the total labour force by sex, 2004 24
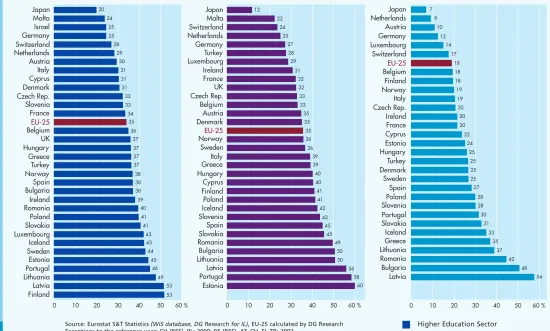
Figure 1.6 Proportion of female researchers, 2003 25
Figure 1.7 Growth rates for researchers by sex, 1999-2003 26
Figure 1.8 Researchers per thousand labour force by sex, 2003 27
Figure 1.9 Proportion of female researchers by sector, 2003 28
Figure 1.10 Distribution of researchers across sectors by sex, 2003 29
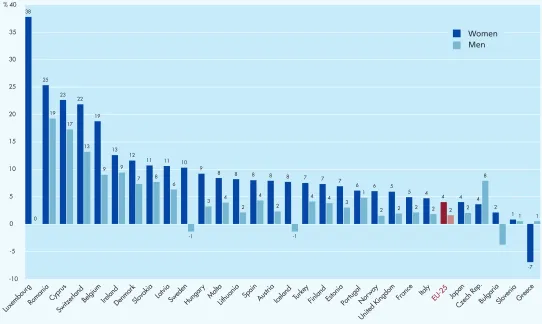
Figure 1.11 Growth rates for researchers in Higher Education Sector (HES) by sex, 1999-2003 30
Figure 1.12 Growth rates for researchers in Government Sector (GOV) by sex, 1999-2003 31
Figure 1.13 Growth rates for researchers in Business Enterprise Sector (BES) by sex, 1999-2003 32
Chapter 2 Scientific fields
Table 2.1 Proportion of female PhD (ISCED 6) graduates by broad field of study, 2003 39
Figure 2.1 Distribution of PhD (ISCED6) graduates across the broad fields of study by sex, 2003 40 Table 2.2 Proportion of female PhD (ISCED6) graduates by narrow field of study in natural science and engineering
(400 & 500 fields), 2003 41
Table 2.3 Proportion of female researchers in the Higher Education Sector (HES) by field of science, 2003 42 Figure 2.2 Distribution of researchers in the Higher Education Sector (HES) across fields of science, 2003 43 Table 2.4 Proportion of female researchers in the Government Sector (GOV) by field of science, 2003 44 Figure 2.3 Distribution of researchers in the Government Sector (GOV) across fields of science, 2003 45 Table 2.5 Proportion of female researchers by economic activity (NACE) in the Business Enterprise Sector (BES), 2003 46 Figure 2.4 Distribution of researchers across economic activities (NACE) in the Business Enterprise Sector (BES), 2003 47 Table 2.6 Dissimilarity index for researchers in Higher Education Sector (HES) and Government Sector (GOV), 2003 48 Chapter 3 Seniority
Figure 3.1 Proportions of men and women in a typical academic career, students and academic staff, EU-25, 1999-2003 55 Figure 3.2 Proportions of men and women in a typical academic career in science and engineering, students and academic staff, EU-25,
1999-2003 56
Table 3.1 Proportion of female academic staff by grade and total, 2004 57
Figure 3.3 Percentage of grade A among all academic staff by sex, 2004 58
Figure 3.4 Glass Ceiling Index, 2004 59
Table 3.2 Proportion of female grade A staff by main field of science, 2004 60
Figure 3.5 Distribution of grade A staff across fields of science by sex, 2004 61
11
Chapter 4 Setting the scientific agenda
Figure 4.1 Research funding success rate differences between women and men, 2004 70
Figure 4.2 Proportion of women on scientific boards, 2004 71
Figure 4.3 Proportion of female researchers and R&D expenditure in Purchasing Power Standards (PPS) per capitaresearcher, 2003 72 Figure 4.4 R&D Expenditure in Purchasing Power Standards (PPS) per annum, per capita researcher by R&D sector, 2003 73
Figure 4.5 Gender Pay-Gap covering whole economy, 2002 and 2004 74
Table 4.1 Gender Pay-Gap by selected occupations in private enterprise, EU-25, 2002 75
Annex 1
Annex 1.1 Number of ISCED 6 graduates by sex 1999-2003 77
Annex 1.2 Number of researchers by sex, HC 1999-2003 78
Annex 1.3 Number of researchers in HES by sex, HC, 1999-2003 79
Annex 1.4 Number of researchers in GOV by sex, HC, 1999-2003 80
Annex 1.5 Number of researchers in BES by sex, HC, 1999-2003 81
Annex 2
Annex 2.1 Number of ISCED 6 graduates by broad field of study and sex, 2003 82
Annex 2.2 Number of ISCED 6 graduates by narrow fields of study and sex in natural science and engineering
(400 & 500 fields), 2003 83
Annex 2.3 Number of researchers in HES by fields of science and sex, HC, 2003 84
Annex 2.4 Number of researchers in GOV by fields of science and sex, HC, 2003 85
Annex 2.5 Number of researchers in BES by economic activity (NACE) and sex HC, 2003 86
Annex 3
Annex 3.1 Number of senior academic staff (Grade A) by fields of science and sex, 2004 87
Annex 3.2 Number of academic staff by grade and sex, 2004 88
Annex 3.3 Number of R&D personnel in HES by occupation and sex, HC, 2003 89
Annex 3.4 Number of R&D personnel in GOV by occupation and sex, HC, 2003 90
Annex 3.5 Number of R&D personnel in BES by occupation and sex, HC, 2003 91
Annex 4
Annex 4.1 Number of applicants and beneficiaries of research funding by sex, 2004 92
Annex 4.2 Number of women and men on scientific boards, 2004 93
13
General introduction
She Figures 2006presents an array of sex disaggregated data for those with high-level tertiary qualifications who are engaged in the workforce at a professional level, shaping, creating and managing new knowledge, processes, methods and systems. Particular attention is paid to various forms of scientific employment, since this is an area of crucial importance for the continuing success of Europe as a knowledge economy, and because scientific employment is recognised as an area in which women remain under-represented, to the detriment of the European research capacity and its social integration.
This is the second such booklet: the first was She Figures 2003, and it is no coincidence that it resembles DG Research’s flagship statistical publication Key Figures. Those familiar with the first publication will recognise that the overall structure of the report remains the same: chapter 1 sets out women’s participation in employment from various perspectives; chapter 2 examines gender differences across fields of employment broadly defined by subject orientation and employment sectors; chapter 3 analyses evidence for gender differentiation at senior levels; and chapter 4 presents data which provide evidence for the extent of women’s contribution to setting the scientific agenda (‘scientific’ in this context including the humanities and social sciences as well as the various fields of science and technology). Chapters 1 and 2 are thus concerned with horizontal segregation, and chapters 3 and 4 with vertical segregation. As in She Figures 2003, data on the gender-balance of those who graduate with
PhD/Doctorate or equivalent are also included, since this provides some indication of the profile of the potential highly qualified workforce of the future. She Figures 2006 goes further than She Figures 2003, however, by providing several sets of additional data, including the Glass Ceiling index (chapter 3), and the gender pay-gap data by selected professional occupations in business enterprise (chapter 4).
The data presented in the following pages demonstrate that women’s intellectual potential, and their contribution to society are not being fully capitalised upon. In particular, their participation is dramatically low in certain branches of the natural sciences and in engineering and technology, which are key R&D areas. Women are seriously under-represented in the business enterprise sector where the EU’s R&D is most highly intensive; and in senior academic grades and influential positions where strategies are set, policies are developed, and the agenda for the future is determined.
14
It has been calculated that this will require a further 700,000 researchers, and that two-thirds of the increased capacity will need to be found within the business and enterprise sector. Yet the key policy areas for innovation and economic growth, and the chief sector for delivery are the very ones where women are most seriously under-represented. The corollary, however, is that these are the areas in which policy interventions should be able to improve women’s participation, to the benefit of the economy as a whole. Furthermore, the promotion of a research environment free of gender bias will bring more equitable social benefits and a greater degree of democratic engagement.
Data sources
Most of the statistics used in this publication are drawn from Eurostat, the European Commission services’ official data source, namely research & development, education, labour force and structure of earnings statistics. In complement to these statistics the Statistical Correspondents provide insight on a deeper level, by providing data on the seniority of academic staff by sex, differences between men and women for funding success rates and proportion of women on scientific boards. The Statistical Correspondents is a sub-group of the Helsinki Group of Women and Science led by the Women and Science Unit of the Directorate-General for Research. A list of the Statistical Correspondents can be found in Annex 6.
Eurostat
The data from Eurostat all originate from a variety of different surveys conducted at national level:
Researchers and R&D Expenditure data are collected through
the R&D Survey which is since 2004 a joint data collection between Eurostat and the OECD.
Human Resources in Science and Technology dataare collected
through Eurostat’s Labour Force Survey
Education data are collected through the UOE (UNESCO-UIS,
OECD, Eurostat) questionnaire.
Gender Pay Gap data have been collected through SES2002
(Structure of Earnings survey 2002)
Statistical Correspondents
The statistics on the seniority of academic staff, research funding success ratesand membership of scientific boardsare collected at the national level through Higher Education and R&D Surveys, Ministries and Academies of Science, Research Councils and Universities as part of their own monitoring systems and administrative records. It is important to note that these data are not always ready for cross-country comparison at EU level. Technical details relating to adherence to standards and categorisation and data sources can be found in Annex 5.
Key definitions
PhD/Doctorate or equivalent graduates: The International
Standard Classification of Education (ISCED) identifies a specific level – ISCED 6 – as “tertiary programmes which lead to the
award of an advanced research qualification”(UNESCO, 1997).
15
Human Resources in Science & Technology (HRSTC): This section of the workforce is defined as those who are both qualified tertiary educated graduates in the labour force and those who are working in professional or technician occupations3 not formally qualified as above.
Scientists and Engineers (S&E): Data for this group are also drawn from the Community Labour Force Survey, more specifi-cally from the professional occupations category, but are restricted to “physical, mathematical and engineering occupa-tions” and life science and health occupaoccupa-tions” and therefore exclude scientists in other occupational fields, such as social, or agricultural sciences.
Researchers: According to the common definition in the Frascati Manual (OECD, 2002), “Researchers are professionals engaged in the conception or creation of new knowledge, products, processes, methods and systems and also in the management of the projects concerned”.
More detailed information on these definitions can be found in Annex 5.
3 The definitions of Professionals and Technicians are taken from the International Standard
Critical mass
17
1. Critical mass
The data presented in this chapter provides evidence of women’s participation in research at the high professional level characterised by the shaping, creating and managing of new knowledge, processes, methods and systems. Particular attention is paid to those engaged in various forms of scientific employment, since this is an area of crucial importance for the continuing success of Europe as a knowledge economy. The chapter also includes analysis of the gender-balance of those who graduate with PhD/Doctorate or equivalent (ISCED 6), since this information provides some indication of the profile of the potential highly qualified workforce of the future.
Overview
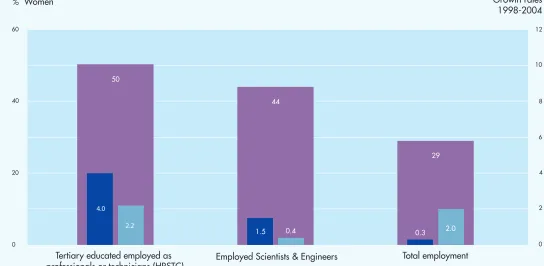
Figure 1.1 provides an initial overview of employment participation, both as a snapshot for the year 2004, and as a dynamic process of change over the period 1998-2004. In 2004 women accounted for 44% of the total labour force, and between 1998 and 2004 their participation rate had risen faster than that of men (1.5% for women; 0.4% for men). For Scientists and Engineers, however, female participation was markedly lower, at 29%, with the participation rate between 1998 and 2004 increasing much more slowly than that of men (0.3% for women; 2.0% for men). This is a worrying scenario since, if it persists, women’s participation in the field of science and engineering will decrease in relative terms. The picture is significantly better for women who have received a tertiary education and who are employed in professional or technician occupations. This represents a broader range of
employment, and women are here strongly represented. Their participation in this segment of the workforce, at 50%, is greater than the participation of women in the workforce as a whole. The growth in their participation between 1998-2004 was greater than that of the men (4.0% for women; 2.2% for men), and was also significantly greater than the 1.5% growth in the participation rate of women in the workforce as a whole. These figures suggest that tertiary education strengthens the participation of women and is a valuable social investment in achieving employment equity.
PhD graduates
18
and the possible need for policy intervention, either to strengthen a positive trend or to reverse a negative one. Such actions would depend on a more detailed analysis of the figures at Member State level, together with further analysis of the social and structural factors in play, which will vary from country to country.
It is encouraging to see in Figure 1.3 that the participation of women at this level has increased between 1999 and 2003 at a significantly higher rate than that of men (women 7%; men 2%). This is an improvement on the growth rates for 1998-2001 which were 5 % for women and 1% for men. However, the development of policy at EU and Member States level will depend on analyses by subject-domain. It is only by this means that it will be possible to identify whether sufficient numbers of women are qualifying in the subjects that will equip them to achieve participation in key policy areas at a growth-rate high enough to produce equity within a reasonable period, and thus strengthen the research resource in line with national needs and the over-all EU target of the 3% objective in R&D.
Employment4
Figure 1.4 sets out the rates at which women and men who have been educated at a tertiary level are working in professional or technician occupations. The rates for women are much the same as those for men, with a general tendency for a slightly higher proportion of tertiary educated women than men to be employed in the EU as a whole and in all Member States with the exception of France, Italy, Luxembourg and Cyprus. In interpreting the figures, however, it is important to bear in mind that the Human Resources in Science and Technology Core (HRSTC) category includes employees in science-based employment
who are not necessarily involved in research, so that the relatively strong presence of women in Figure 1.4 does not reveal the extent to which they are contributing directly to the research resource. More detailed analysis is therefore required in order to understand the differences in the way men and women utilise their education, and the factors which bring this about.
A narrower focus is provided by Figure 1.5, which presents the proportion of male and female scientists and engineers in the total labour force. In this analysis, ‘scientists and engineers’ refer to physical, mathematical, life science and health occupations the professional category only. That this is a highly specialised segment of the labour force is evident from the fact that all the figures are low. However, it is striking that for the majority of countries the presence of women scientists and engineers is noticeably lower than it is for men. Even the over-all EU figures of 1.4% for women and 3.3% for men, despite being boosted by parity or near-parity in Belgium, Estonia, Ireland, Portugal and by a higher percentage of women than men in Lithuania, show that women’s presence is little more than one-third that of men. The scientists and engineers whose presence in the labour force is counted in Figure 1.5 are a subset of the HRSTC group counted in Figure 1.4. When taken together, therefore, the two tables confirm that the narrower focus on employment as natural scientists and engineers excludes a disproportionate number of women, which in turn supports the conclusions drawn from the overview analysis of Figure 1.1 at the beginning of this chapter.
4 More detailed information on the classifications used in the analysis of employment can be found in
19
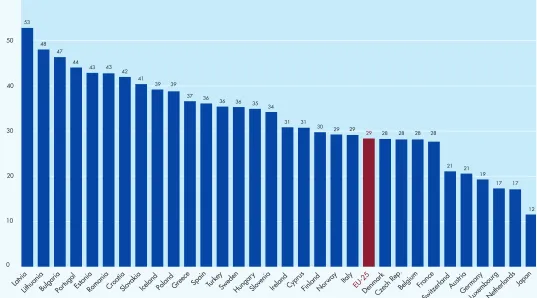
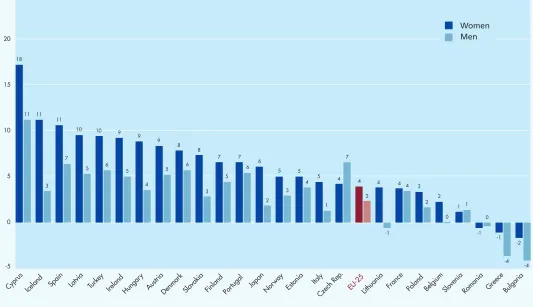
The final set of figures in this chapter presents data for researchers, which is a broader base of subject-domains than those discussed so far, although the occupational function is defined more narrowly than human resources in science and technology. The 2003 snapshot of the proportion of researchers who are women (fig. 1.6) shows considerable variation between countries, but there is a clear pattern of female under-represen-tation. When relating the number of male and female researchers to the total labour force, there is also a female under-representation in all countries except for Latvia and Bulgaria (fig. 1.8). More informative are the growth rates for the period 1999-2003 (fig. 1.7). Here we see that, for the EU as a whole, the rate of growth for women, at 4%, is higher than that for men, at 2%. While this is in general an encouraging trend, it must be remembered that, as the previous figure shows (fig. 1.7), the growth rate for women is on a smaller base than that for men. This differential growth rate, if merely sustained and not radically increased, would thus take a very long time to deliver a significantly improved gender balance.
The tables showing women’s presence across the sectors5of the economy also reveal some recurrent patterns of under-represen-tation. However the average proportion of female researchers for the EU as a whole (fig. 1.9) has improved slightly since 1999 in all three sectors. The proportion of women in the business enterprise sector (BES) has increased to 18% in 2003 compared to 17% in 1999, and in the government sector (GOV) to 35% compared to 33% and for the higher education sector (HES) to 35% compared to 33%.
Figure 1.10, which compares the distribution of male and female researchers across the sectors, shows that in most countries women are more likely than men to opt for employment in higher education and government sectors. These sectors are in contrast with the business and enterprise sector, which is more likely to be chosen by men. In all of these sectors, the growth rates for the period analysed (see figs 1.11 – 1.13) show that the rates are higher for women than for men, but the rates are modest and the differentials are not marked, so that the trends do not point to significant changes in the medium term. There is, in any case, considerable variation between countries, reflecting differences in the way national economies are structured and employment is defined. The gender imbalance in BES is a matter of particular concern, since this is the area in which more researchers are needed if the EU is to reach the Barcelona objective of 3% of GDP devoted to R&D, given that two-thirds of this capacity should come from BES. The differences pose questions about why women are less likely to choose to be employed in the private sector, and whether there are initiatives that could be taken to promote an improved female presence within BES research.
20
Figure 1.1: Proportion of women in the EU-25 for total employment, tertiary educated and employed (HRSTC) and scientists & engineers in 2004, growth rates for men and women 1998-2004
Growth rates 1998-2004 % Women
4.0 2.2
Tertiary educated employed as
professionals or technicians (HRSTC) Employed Scientists & Engineers
Total employment
60 12
10
8
6
4
2
0 40
20
0
1.5 0.4 0.3 2.0
29 44
50
Source: Eurostat Labour Force Survey EU-25 estimated by Eurostat
% Women
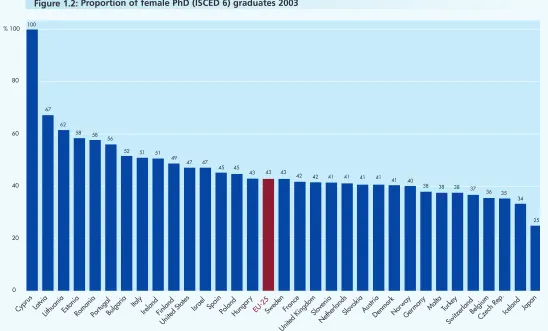
Figure 1.2: Proportion of female PhD (ISCED 6) graduates 2003
21
0 20 40 60 80 % 100Cyprus LatviaLithuaniaEstoniaRomania
Portugal Slovak ia
Austria Belgium Czec
h Rep. Iceland Japan Den
mark
100
67
62 58 58
56
Bulgaria Italy
IrelandFinland
United States Israel SpainPolandHun gary
EU-25Sweden France United Ki
ngdomSlovenia Netherlands
52 51 51 49
47 47 45 45
43 43 43
42 42 41 41 41 41
NorwayGermany Malta Tur key Switzerla
nd
40 41
38 38 38 37 36 35
34
25
Source: Eurostat, Education statistics, Israel Central Bureau for Statistics & Council for Higher Education, The Danish Institute for Studies in Research and Research Policy Data unavailable: EL, LU
Data less than 30 graduates: CY (1), MT (8), IS (6)
-10 0 10 20 % 30
Czech Rep. Por tugal Slovak ia Estonia 21 15 18 18 14 9 15 9 Israel 9 16 Japan 15 5 Sweden 11 11 19 1 Denmark -3 -1 Bulgaria 13 -3 France -4-4 Hun
gary Austria
Nor way United States Slovenia 10 8 Belgium 9 7 Poland 10 7 Latvia 7 5 United Kingdom 10 5 Spain 5 4 EU-25 7 2 2 9 Ireland 2 6 Turkey 2 2 Switzerland -1 0 3 -1 3 -2 Germany 2 -3 Netherlands 9 -3 Finlan d 1 -4 Lithuania 8 -7 Italy 15 17
Source: Eurostat Education Statistics, Israel Central Bureau for Statistics & Council for Higher Education,The Danish Institute for Studies in Research and Research Policy Exceptions to the reference years: IL: 1998-2000; SK: 1999-2002; BE, CY: 2000-2003
Data unavailable: EL, LU, RO
Growth rate not presented for countries with less than 30 graduates: MT (8), CY (1), IS (6)
[image:20.624.76.595.57.370.2]22
Figure 1.3: Growth rates of PhD (ISCED 6) graduates by sex, 1999-2003
23
0 10 20 30 40 50 60 70 % 80
Icela nd
SwedenRomaniaPortugalDenmarkSloveniaNor way
Czech Rep. Malta
LuxembourgSlovakia Italy
Poland NetherlandsHungar
y SwitzerlandGer
many GreeceLithuania EU-25Finland AustriaBulgaria France United Ki
ngdom Latvia Belgium Cyprus Ireland Spain Estoni a
74 72
71 71
70 70 69
67 67 66
63 63 63 63 62
55 69
55 55
59 59 59 59 58
57 56 56 56 56
55
46
48 48 49 49
41
33 53 53 54 52 52
51 51
44
50 50
42
54 54
56 74
65 68
65 61 59 66
61 61 65 65
Source: Eurostat Community Labour Force Data, EU-25 estimated by Eurostat Exception to the reference year: NL: 2003
Break in series: AT, EL, IT, MT, PT Provisional data: AT
Figure 1.4: Employed professionals and technicians (HRSTC) as a percentage of tertiary educated (HRSTE) by sex, 2004
24
Iceland Sweden Portuga l DenmarkSlovenia
Nor way
Czech Rep. Luxembourg Slovakia Italy Poland Netherlands Hun gary Switze rland Germany Greece
Lithuania Finland EU-25 Bulgaria France Austria United
Kingdom Latvia
Belgium Cyprus
Ireland Spain Estonia
0 2 4 6 8 % 10 4.0 4.2 4.0 3.7 3.2 3.3 2.6 4.0 2.5 2.0 2.1 3.6 2.0 2.0 2.8 1.9 3.0 1.9 1.8 1.9 4.1 1.8 2.8 1.8 4.4
1.5 1.5 1.4 1.5 1.6 2.9 2.3 4.4 4.2 6.4 1.4
1.2 1.2 1.2 1.1 1.1 1.1 1.1
1.0 1.0 1.0 2.2 0.7 1.7 2.2 2.0 1.6 1.3 3.3 2.9 5.4 3.9 4.5
1The labour force is defined as the sum of employed and unemployed persons.
Source: Eurostat Community Labour Force Data
[image:22.624.52.597.47.363.2]Exception to the reference year: NO: 2002; DK, LV, NL: 2003 Data unavailable: MT, RO
Figure 1.5: Proportion of scientists and engineers in the total labour force1by sex, 2004
25
Cyprus Latvia
LithuaniaBulgariaPortugalEstoniaRomaniaCroatiaSlovakia
Italy Ireland Finland Spain
PolandGreece Hung ary
EU-2 5
Sweden Slovenia Norway France Turkey
Denmark Bel gium Czech Rep. Iceland
53
48 47
44 43 43
42 41
39 39 37 36
36 36 35 34
31 31
30 29 29
28 28 28 28
29
0 10 20 30 40 50 % 60
Netherl ands Austria
Germany Luxembourg Switzerland
Japan 21 21
19 17 17
12
Source: Eurostat S&T statistics, EU-25 calculated by DG Research Exceptions to the reference year: PL: 2000; AT, FI, TR: 2002 Data unavailable: MT, UK
[image:23.624.59.596.62.360.2]Data estimated: SE
26
Icela nd
Greece Finland Belgium Bulgaria Cyprus Turkey 18 11 11 3 10 7 6 5 2 -1 -4 -4 -2 -5 0 5 10 15 20 % 25 Czech Rep. 7 4 Spain 11 7 Denmark 6 8 Portuga l 7 6 Latvia 10 5 Austria 5 9 Ireland 5 9 Estoni a 5 4 Hungar y 4 9 France 4 4 Nor way 3 5 Slovakia 3 8 EU-25 4 2 Japan 2 6 Poland 2 3 Slovenia 1 1 Italy 1 5 Rom ania -1 0 0 Lithuania 4 -1
Source: Eurostat S&T statistics, EU-25 calculated by DG Research
Exceptions to the reference year: AT: 1998-2003; FI, TR: 1999-2002; NO: 1999-2003; LT, PL: 2000-2003; SK, JP: 2001-2003; BE, FR, IE: 2002-2003 Data provisional: IE (2003); Data estimated: SI (2003), SE
[image:24.624.65.598.61.368.2]Data unavailable: DE, LU, MT, NL, SE, UK
Figure 1.7: Growth rates for researchers by sex, 1999-2003
27
Icela nd Slovenia Austria Ireland 20 27 6 5 9 10 10 0 5 10 15 20 25 % 30 Estonia Denmark Sweden 8 8 12 20 17 Finland 12 26 Nor way 10 21 France 5 5 12 Hun gary 6 9 Spain 7 9 Portuga l 7 7 Lithuania 7 7 Slovakia 5 7 Greece 5 6 Latvia 5 5 Germany 4 15 15 Luxembourg 4 15 EU-25 4 9 Netherland s 8 2 Czech Rep. 8 4 Poland 6 4 Italy 3 5 Cyprus 2 4 Bulgaria 3 3 Romania 3 3 Turkey 3 41The labour force is defined as the sum of employed and unemployed persons.
[image:25.624.57.594.32.359.2]Source: Eurostat S&T statistics; Community Labour Force Survey (LFS) Exceptions to the reference year: CH, PL: 2000; AT, FI, TR: 2002; Break in data series: IT; Provisional data: IE; Estimated data: SE, SI Data unavailable: BE, ES, MT, UK
Figure 1.8: Researchers per thousand labour force1by sex, 2003
28
Japan
0 10 20 30 40 50 60 %
20 Japan
0 10 20 30 40 50 60 %
12 Latvia Bulgaria Lithuania Greece Iceland SlovakiaPortugal SloveniaPoland Spain Sweden Denmark Turkey Hungary Estonia Cyprus France Ireland Czech Rep. Italy Norway Finland Belgium EU-25 Switzerland Luxembourg Germany Austria Netherlands Japan
0 10 20 30 40 50 60 %
7 9 10 12 14 17 18 18 18 19 19 20 20 20 22 24 25 25 25 25 27 28 28 30 31 33 35 37 42 Romania 48 54 Israel Malta 24 25 Latvia Lithuania Portugal Slovenia Sweden Denmark Estonia Cyprus France Czech Rep. Italy Finland Belgium UK EU-25 Switzerland Germany Austria Netherlands 25 28 29 30 31 31 31 33 33 34 35 36 44 45 46 49 53 53 Iceland 43 Latvia Romania Lithuania Slovakia Portugal Slovenia Spain Turkey Estonia Switzerland Luxembourg Germany Netherlands 24 25 27 28 29 43 45 45 49 50 50 56 Bulgaria Greece Poland Iceland Sweden Denmark Hungary Cyprus France UK Ireland Czech Rep. Italy Norway Finland Belgium EU-25 Austria 31 32 32 33 33 35 35 35 36 36 39 39 40 40 41 41 42 58 60 Malta 22 Bulgaria Romania Greece Slovakia Poland Spain Turkey Hungary Ireland Norway 37 37 37 37 38 38 38 39 40 41 41 Luxembourg 43
Source: Eurostat S&T Statistics (WiS database, DG Research for IL), EU-25 calculated by DG Research Exceptions to the reference year: CH (BES), PL: 2000; BE (BES), AT, CH, FI, TR: 2002
Data unavailable: MT (BES), UK (BES)
Full time equivalent (FTE) instead of head count (HC): IL Data estimated: SE
[image:26.624.48.598.56.387.2]Higher Education Sector Government Sector Business Enterprise Sector
29
Source: Eurostat S&T statistics, EU-25 calculated by DG Research Exception to the reference year: BE (BES), NL, AT, FI, TR: 2002 Data unavailable: MT, UKData estimated: SE
0 20 40 60 80 % 100
EU-25 f m
Austria f m
Belgium f m
Bulgaria f m
Cyprus f m
Czech Re p. f m
Denmar k f m Estonia f
m
Finland f m
France f m
German y f m Greece f
m
Hungar y f m
Iceland f m
Ireland f m
Italy f m Japan f
m Latvi
a fm
Lithuania f m
Luxembourg f m
Nethe rlands f
m
Norway f m
Polan d f m
Portugal f m
Rom ania f
m
Slovakia f m
Slovenia f m Spain
f m
Swede n f m
Switzerland f m
Turkey f m
Business Enterprise Sector Government Sector Higher Education Sector
30
Icela nd
Denmark Sweden Malta Slovenia Ireland 38 25 19 23 17 22 13 19 13 12
11 11 10 9
3
8 8 8 8 8 7 7 7
4 4 3
6 6
2 5
5 4 4
4 4 8
2
-7 1 1 1 2 2 2
2 2 1 -1 2 2 4 4 -1 9 9 7 8 6 0 Finlan d Nor way
United Kingdom Estoni a Luxembourg France EU-25 Hungar y Spain Austria Czech Rep. Portugal Lithuania
Slovakia Japan Greece
[image:28.624.57.599.53.377.2]Italy Latvia Cyprus Switzerland Belgium Bulgaria Romania Turkey -10 -5 0 5 10 15 20 25 30 35 % 40
Figure 1.11: Growth rates for researchers in Higher Education Sector (HES) by sex, 1999-2003
Men Women
Source: Eurostat S&T statistics, EU-25 calculated by DG Research
Exceptions to the reference year: UK: 1998-2000; AT, CH:1998-2002; FI, TR: 1999-2002; LT, LU: 2000-2003, IE, MT, SK: 2002-2003 Provisional data: BE (2002),
31
Latvia Denmark Nor way Sweden Iceland -20 -10 0 10 20 30 40 % 50 Italy 41 29 France 11 25 Ireland 10 15 Luxembourg 9 13 Turk ey 5 11 Poland 5 8 Greece 7 4 4 Belgium 4 3 Slovakia 7 2 Rom ania 2 1 1United Kingdom
3 1
EU-25
3
0 0 0 0
Japa n 2 Austria 3 Switzerland 5 -1 Finland -4 4 -7 -8 Estonia -9 Lithuania -10 -14 -17-17 9 Sloven ia -1 -1 Bulgaria -2 -2 Hungar y 1 8 Czec h Rep. 4 9 Netherlands 5 21 Cyprus 5 16 Spain 5 13 Portugal 7 -11
Source: Eurostat S&T statistics, EU-25 calculated by DG Research
Exceptions to the reference year: AT, CH, TR: 1998-2002; FR, FI: 1999-2002; LT, LU, PL: 2000-2003, NL, JP: 2001-2003; BE, IE, MT, SK, UK: 2002-2003 Growth rate not presented for countries with less than 30 researchers: MT (11)
[image:29.624.61.596.50.373.2]Data unavailable: DE Data estimated: SE
Figure 1.12: Growth rates for researchers in Government Sector (GOV) by sex, 1999-2003
32
Iceland
Latvia Austria Hun gary Ireland Spain 52 23 39 22 21 13
8 9 7
-2 -3 7 -20 -10 0 10 20 30 40 50 % 60 Lithuania 20 7 Estoni a 15 -1 Portugal 22 14 Denmark 18 12 France 8 7 Cyprus 7 10 Finland 8 6 Czech Rep. 7 5 Nor way 5 4 Turkey 5 4 Slovenia 3 3 Japan 13 3 0 EU-25 5 3 Belgium 3 2 Italy 3 0 Greece 14 Germany -2-1 Bulgaria -2 1 Romania Netherl ands -10 -12 -11 -7 Slovakia -9 -13
Source: Eurostat S&T statistics, EU-25 calculated by DG Research
Exceptions to the reference year: AT: 1998-2002; IS: 1999-2001; BE, ES, FI, TR: 1999-2002; FR, LT: 2000-2003; DE, IE, NL, JP: 2001-2003; SK: 2002-2003 Provisional data: BE (2002),
Data unavailable: LU, MT, PL, SE, UK Data estimated: SE
[image:30.624.92.597.56.368.2]High growth rate due to sharp increase in number of enterprises surveyed (23 to 191): LV
Figure 1.13: Growth rates for researchers in Business Enterprise Sector (BES) by sex, 1999-2003
34
2. Scientific fields
The analyses of the tables in chapter 1 identified gender differences in employment. These differences are explored in more detail in this chapter. Attention is paid to the horizontal segregation of male and female researchers by broad fields of science (here including humanities and social science, as well as the branches of ‘science’ more narrowly defined) in relation to the higher education (HES) and government (GOV) sectors and by economic activity in the business enterprise sector (BES). Unfortunately, horizontal segregation cannot be analysed for researchers in total sectors due to large data gaps; only data for 9 countries are available for the EU 25. As with chapter 1, the analysis begins with an examination of broad fields of study at PhD/Doctorate or equivalent (ISCED 6) level in order to assess the potential for women increasing their participation rates across the different fields in future employment.
PhD graduates
Table 1.2 shows the proportion of women graduating at PhD/Doctorate or equivalent level (ISCED 6) in 2003, analysed by broad field of study. Figure 1.3 in chapter 1 shows that women’s participation at this educational level had increased over-all in the period from 1999-2003 however, despite this general increase, there is a marked differentiation between subject areas. For the EU as a whole, women constitute 60.5% of education graduates at this level, followed by humanities and the arts, and health and welfare, where women are also in a majority, at 51.4% and 51.1% respectively.
The agriculture and veterinary field is close to this, at 49.6 %, but there is then a drop to 43.1% for the social sciences, business and law and 40.0% for science, mathematics and computing. Engineering, manufacturing and construction comes far below this, with only 21.9% of graduates being women at PhD/Doctorate or equivalent level (table 2.1). Although the national figures vary, the low rate of women’s participation in engineering, manufacturing and construction at this advanced educational level is notable in all countries, which suggests that it is a persistent situation.
35
represent lower absolute figures than corresponding percentages for men. This means that the visible presence of advanced women students across these fields relative to men is lower than the percentages superficially suggest. The data for distribution by field thus reinforce the conclusions already drawn in relation to Table 2.1: that the under-representation of women in this field is a universal feature. As Figure 2.1 shows, it is an imbalance that is replicated in such countries as Japan and the USA.
When the two broad S&T fields of study are analysed in more detail (table 2.2), further discrepancies emerge. In the natural sciences (science, mathematics and computing), it is strikingly apparent that women commonly constitute more than 50%, and sometimes more than 75%, of PhD graduates in the life sciences. The EU average for this narrow field is thus 54.4%, which contrasts sharply with physical science at 33.0%, mathematics and statistics at 31.6%, and computing at 18.6%. Similarly, the breakdown for engineering, manufacturing and construction shows major differences between the three narrow fields, with manufacturing and processing, and architecture and building having the highest participation of women, at 32% and 31.3% respectively, and engineering and engineering trades being dramatically worse at 17.1%. This figure demonstrates the value of a more detailed analysis of the available data, since it shows that analysis by broad field (as in the preceding figures for ISCED 6 graduates) masks significant variations within the subjects that make up those fields. While high level analyses may identify general areas of concern, it is clearly necessary to take the analysis to a more detailed level in order to uncover the specific areas where the sustainability of research capacity may be at risk at both the EU and Member States level, and where targeted
attention by policy-makers may be urgently needed. An improved gender-balance at this educational stage would greatly enrich the potential resource since it would tap into the half of the population that is currently severely under-represented in key areas.
These data-sets, presenting the gender-balance of highly qualified graduates as they reach the point of entry into employment, prompt two policy-related questions: whether there is anything that can be done to improve the gender-balance at the basic higher education level (ISCED 5) in order to support a better gender-balance at ISCED 6; and whether in particular there is anything that can be done to encourage a higher proportion of women engaged in the two broad fields of science, mathematics and computing, and engineering, manufacturing and construction to continue to the higher level of study (ISCED 6). Attention needs to be given to both of these areas at the educational level if the overall EU research capability is to be increased.
Employment by fields of science within sectors
36
The data in chapter 1 (fig. 1.9) demonstrated that in the EU as a whole female researchers were more likely than men to choose to work in higher education and that women constituted on average 35% of all researchers in HES. Yet, as can be seen in the breakdown by broad field in the present chapter (table 2.3), this masks major differences, with engineering and technology being the field in which women are very poorly represented, and with the natural sciences being only a little better. These two fields are all significantly outperformed in terms of women’s representation by medical sciences, agricultural sciences, social sciences and humanities, although even here, on the basis of the available data, women constitute only just over one-third of researchers. The comparative analysis of women’s and men’s distribution across these fields (fig. 2.2) provides further evidence of gendered choice, with the discrepancy again being greatest in engineering and technology, followed by the natural sciences.
The government sector, in which women constitute 35% of all researchers, shows similar gendered patterns by broad field of science. The lowest proportion of female researchers is in engineering and technology (22.3%), with the natural sciences next at 31.0% (table 2.4). Above these come the social and agricultural sciences at 44.3% and 43.1% respectively, with women achieving near-parity in the medical sciences (49.7%), and being narrowly in the majority in the humanities, at 50.4%. The relativities are confirmed by Figure 2.3, showing the comparative distribution of women and men in the government sector across the broad fields, with the greatest differences in the employment choices made by men and women being in engineering and technology.
There are major gaps in these data-sets, although, the general trend is in line with what the more robust data-sets indicate, the EU averages are not precise.
37
Measuring horizontal segregation
Finally, as a means of measuring horizontal segregation, Table 2.6 provides the country-by-country and EU average Dissimilarity Index (DI) for researchers within HES and GOV. Within this index, the appearance of the value 0 would indicate that at that point there was an equal distribution of men and women. This is the minimum value within the index. The maximum value is 1, and if that were to occur, it would indicate that, at that point, only men or only women were employed. Figures between 1 and 0 indicate the extent of the gender imbalance or, more precisely, the proportion of researchers that, hypothetically, would need to move out of the field in order to create a balanced gender distribution. Whether it would be men or women who would have to make the hypothetical shift would depend on which group predominated. In order to discover the gender predominance that lies behind each DI number in the present table, one needs to consult Figure 1.9 for HES and GOV (Proportion of female researchers by sector, 2003).
Dissimilarity Index
The Dissimilarity Index (DI) provides a theoretical measurement of the percentage of women and men in a group who would have to move to another occupation to ensure that the proportions of women were the same across all the possible occupations. It can therefore be interpreted as the hypothetical distance from a balanced gender distribution across occupations, based upon the overriding proportion of women (NSF, 2000). The formula for the Dissimilarity Index is:
DI = 1/2 Σi| Fi/ F – Mi /M |
where: i denotes each occupation
Fiis the number of women researchers in each occupation
Miis the number of men researchers in each occupation
F is the total number of women researchers across all occupations M is the total number of men researchers across all occupations. || indicates that the absolute value is taken, but not the sign.
For example, if we have three occupations, A, B and C with 17, 37 and 91 women and 108, 74, 182 men respectively, the over-all proportion of women is 28.5%. We therefore need to calculate:
|17 – 108| + |37 – 74| + |91 – 182|
|145 364| |145 364| |145 364| = 0.1795 + 0.0519 + 0.1276 = 0.1795
2 2
This means that 18% of researchers will have to change occupation in order to maintain the background proportion of 28.5% women in each occupation.
In order to interpret the DI correctly, it is important to know which gender is in the majority overall. The maximum value is 1, which indicates the presence of only either women or men in each of the occupations, depending on the majority gender. The minimum value of 0 indicates a distribution between women and men within each occupation which is equal to the overall average proportion of women. If the same occupational categories are used for different countries, the DI yields a comparable and descriptive statistic that reflects the extent to which the two sexes are differently distributed. The results also depend on the number of categories. If more categories are used, the indicator will reflect greater variability in the distribution, which in turn will yield results indicating a higher level of segregation.
Box 1
39
Table 2.1: Proportion of female PhD (ISCED 6) graduates by broad field of study, 2003
Source: Eurostat Education statistics, Israel Central Bureau of Statistics and the Council for Higher Education Exceptions to the reference year: IL: 2000
Data unavailable: EL
Most tertiary students study abroad and are not included: LU, CY Countries with small numbers: CY (1), MT (8), IS (6)
EU-25 60.5 51.4 43.1 40.0 21.9 49.6 51.1
Austria 65.3 47.5 43.4 30.2 18.9 65.9 72.0
Belgium 43.8 42.2 36.1 33.1 14.3 30.6 45.4
Cyprus - - - 100.0 - -
-Czech Republic 66.7 48.6 40.0 36.7 22.3 36.7 42.2
Denmark - 46.9 38.6 33.6 23.8 52.4 54.0
Estonia 50.0 58.8 62.5 21.9 17.6 37.5 72.5
Finland 66.7 57.9 51.6 43.1 25.5 41.7 64.3
France 49.0 55.5 41.4 38.4 25.9 55.6 56.1
Germany 52.6 49.5 34.5 29.9 11.4 54.3 47.7
Greece : : : : : : :
Hungary 59.5 56.4 35.9 37.5 29.7 32.0 43.3
Ireland 50.0 53.1 47.2 56.6 31.2 31.6 50.7
Italy 72.5 58.5 50.4 54.0 31.2 54.4 61.5
Latvia 83.3 66.7 100.0 57.1 37.5 100.0 0.0
Lithuania - 78.9 63.9 47.2 43.9 50.0 68.3
Luxembourg - - -
-Malta 100.0 33.3 0.0 - - -
-Netherlands - 43.8 48.5 40.1 19.9 44.3 48.7
Poland : 51.6 42.7 50.1 24.1 53.8 47.2
Portugal 65.4 66.8 53.9 58.1 34.1 64.6 63.3
Slovakia 72.4 46.2 49.6 57.3 26.2 32.1 71.3
Slovenia 60.0 63.0 37.7 44.8 19.3 36.4 52.0
Spain 59.2 48.6 47.3 46.6 21.3 41.2 49.3
Sweden 64.0 53.2 48.3 34.8 26.4 50.7 59.4
United Kingdom 53.6 45.9 42.2 41.9 19.6 45.2 52.4
Bulgaria 52.2 68.4 50.0 52.8 31.4 46.4 56.4
Iceland - 50.0 - 0.0 - - 33.3
Israel 73.8 51.4 51.6 44.0 25.0 45.5 55.6
Norway 60.0 33.7 49.5 40.7 22.8 46.9 46.9
Romania - 58.9 46.6 57.6 38.3 36.6 66.5
Switzerland 54.2 44.7 28.9 29.4 15.2 57.5 47.7
Turkey 35.3 29.2 29.7 34.8 28.9 39.8 62.6
Japan 48.6 48.7 32.4 19.9 9.2 24.7 25.7
United States 66.0 45.7 55.9 35.5 18.0 36.8 68.5
EDUCATION HUMANITIES & ARTS
SOCIAL SCIENCES, BUSINESS & LAW
SCIENCE, MATHEMATICS & COMPUTING
ENGINEERING, MANUFACTURING &
CONSTRUCTION
AGRICULTURE & VETERINARY
40
Estonia f m EU-25 f m Austri a f m Belgium fm
Bulgaria f m
Cyprus f m
Czech Rep. f
m
Denmar k f m
Finlan d f m
France f m
German y f m
Hungary f m
Icela nd f m
Israel f m Ireland f m Italy f m Japan f m Malta f m Latvi
a fm
Lithuania f m
United Ki ngdom f
m
United St ates f m Nethe rlands f m Norw ay f m Polan
d fm Portugal
f m
Romani a f m Slovakia f
m Slovenia f m Spain f m Swede n f m
Switzerland f m Turkey f m 0 20 40 60 80 % 100 Humanities & Arts Social sciences, Business & Law
Education Science, Mathematics
& Computing
Figure 2.1: Distribution of PhD (ISCED6) graduates across the broad fields of study by sex, 2003
Source: Eurostat Education statistics, Israel Central Bureau of Statistics and the Council for Higher Education Exceptions to the reference year: IL: 2000
Data unavailable: EL.
Most tertiary students study abroad and are not included: LU, CY Countries with small numbers: CY (1), MT (8), IS (6)
41
Table 2.2:Proportion of female PhD (ISCED6) graduates by narrow field of study in natural science and engineering (400 & 500 fields), 2003
Source: Eurostat Education statistics Exceptions to the reference year: NL, NO: 2002 Data unavailable: EL, PL, IL
Most tertiary students study abroad and are not included: LU, CY Countries with small numbers:
400: CY (1); EE (32); IS (2); LV (7); LT (36); NO (2)
500: CY (0); EE (7); HU (37); IS (0); LV (16); LT (41); MT (0); NO (25)
EU-25 54.4 33.0 31.6 18.6 17.1 32.0 31.3
Austria 50.3 21.8 24.4 9.5 16.1 36.4 20.0
Belgium 40.3 29.8 35.4 3.2 13.4 0.0 21.4
Cyprus 100.0 - - -
-Czech Republic 50.9 28.6 31.7 10.3 19.9 47,6 25.8
Denmark 33.6 - - - 23.8 -
-Estonia 28.6 18.2 0.0 100.0 15.4 100.0 0.0
Finland 62.0 39.3 34.3 13.9 23.6 42.9 34.4
France 53.4 34.3 24.3 18.8 22.8 37.7 27.8
Germany 46.7 22.8 27.9 11.9 6.8 24.2 22.3
Hungary 43.0 37.4 25.0 30.0 33.3 32.1 16.7
Ireland 60.2 52.4 0.0 21.4 24.1 58.8 0.0
Italy 72.4 45.2 42.4 25.0 13.5 25.6 48.9
Latvia 66.7 0.0 - 66.7 41.7 33.3 0.0
Lithuania 88.9 28.6 75.0 0.0 44.1 - 42.9
Netherlands - 39.9 - - 18.0 -
-Portugal 73.0 56.7 58.3 28.0 28.0 51.6 42.6
Slovakia 71.4 48.9 46.2 20.0 23.9 26.9 33.3
Slovenia 65.0 34.5 20.0 15.4 10.4 28.6 57.1
Spain 54.5 46.8 40.4 22.8 16.0 62.9 24.0
Sweden 51.7 32.4 16.0 21.6 24.1 32.7 39.3
United Kingdom 56.6 32.6 24.1 23.3 16.2 33.4 21.3
Bulgaria 77.8 49.2 30.0 - 33.3 42.9 0.0
Norway - 0.0 - - 13.3 - 20.0
Romania 57.6 : : : 37.5 - 42.9
Switzerland 42.6 23.3 22.2 7.5 16.9 - 5.0
Turkey 54.1 31.7 28.6 28.6 14.7 42.5 39.8
United States 45.7 27.7 27.0 21.0 17.2 - 45.7
LIFE SCIENCE PHYSICAL SCIENCE
MATHEMATICS & STATISTICS
COMPUTING
ENGINEERING & ENGINEERING
TRADES
MANUFACTURING & PROCESSING
ARCHITECTURE & BUILDING
42
Table 2.3: Proportion of female researchers in the Higher Education Sector (HES) by field of science, 2003
Source: Eurostat S&T statistics, EU-25 calculated by DG Research Exceptions to the reference year: LU, SE: 2001; AT, SI, TR: 2002 Data unavailable: BE, EL, FR, IT, NL, FI, UK, CH
Estimated data: LT, IE, SE
EU-25 29.1 21.3 39.9 39.7 39.3 38.3
Austria 21.6 12.6 35.8 40.9 36.3 42.8
Cyprus 27.8 13.3 : - 34.4 43.9
Czech Republic 26.4 23.6 40.3 40.7 41.7 35.4
Denmark 23.4 14.4 36v5 46.1 30.4 38.3
Estonia 34.4 29.9 61.5 42.3 54.5 63.6
Germany 17.7 11.5 34.0 30.5 29.8 29.8
Hungary 28.4 18.0 45.3 31.3 37.5 47.8
Ireland 39.1 37.5 37.5 39.4 37.5 42.9
Latvia 43.6 29.9 62.4 42.3 59.1 85.4
Lithuania 47.2 27.5 70.4 47.5 53.8 52.5
Luxembourg 50.0 0.0 50.0 - 37.5 66.7
Malta 15.8 10.1 37.4 0.0 42.3 28.3
Norway 26.2 17.5 46.8 39.4 40.8 41.9
Portugal 49.2 29.5 52.7 47.0 49.7 49.6
Poland 38.0 19.2 53.6 49.7 46.0 45.0
Slovakia 36.4 32.3 51.7 39.6 51.8 49.7
Slovenia 24.9 17.1 57.4 40.0 43.2 42.8
Spain 38.2 33.0 40.3 37.7 39.0 39.0
Sweden 27.6 17.3 43.0 37.8 40.6 41.0
Bulgaria 55.0 24.4 55.6 35.9 40.1 52.4
Iceland 35.4 44.8 45.1 35.9 47.0 41.3
Romania 47.3 36.2 51.8 46.6 40.5 41.5
Turkey 37.4 33.8 39.2 34.5 37.5 36.6
NATURAL SCIENCES
ENGINEERING AND TECHNOLOGY
MEDICAL SCIENCES
AGRICULTURAL SCIENCES
SOCIAL
43
Estonia f m
EU-25 f m
Austri a f m
Bulgari a f m Cyprus f
m
Czech Rep.
f m
Denmark f m
Germany f m
Hungary f m
Iceland f m
Ireland f m
Latvia f m
Malta f m
Lithuania f m
Luxembourg f m
Norw ay f m
Portugal f m
Poland f m
Rom ania f
m
Slovakia f m
Slovenia f m Spain
f m
Swede n f m
Turkey f m
0 20 40 60 80 % 100
Engineering and technology
Medical sciences Natural
sciences
Agricultural sciences
Figure 2.2: Distribution of researchers in the Higher Education Sector (HES) across fields of science, 2003
Source: Eurostat S&T statistics, EU-25 calculated by DG Research Exceptions to the reference year: LU, SE: 2001; AT, SI, TR: 2002 No data: BE, EL, FR, IT, NL, FI, UK
Estimated data: LT, IE, SE
Social sciences
44
Table 2.4: Proportion of female researchers in the Government Sector (GOV) by field of science, 2003
Source: Eurostat S&T statistics, EU-25 calculated by DG Research Exceptions to the reference year: AT, SI: 2002
Data unavailable: BE, EL, FR, IT, NL, FI, UK, TR, SE, CH Data estimated: LT
EU-25 31.0 22.3 49.7 43.1 44.3 50.4
Austria 22.0 26.0 38.7 26.4 41.5 44.8
Croatia 43.5 14.3 47.2 29.1 48.2 54.3
Cyprus 53.8 37.5 31.6 17.5 55.2 45.0
Czech Republic 30.5 14.5 48.1 43.4 43.7 47.1
Denmark 27.7 22.7 44.0 41.3 34.7 44.2
Estonia 43.4 28.9 72.3 51.1 40.0 73.5
Germany 24.3 16.6 42.0 35.2 40.9 46.9
Hungary 27.2 19.1 65.2 42.4 36.3 53.6
Ireland 26.5 7.1 51.4 31.5 25.0 0.0
Latvia 57.9 18.6 52.6 50.0 68.3 68.8
Lithuania 43.9 26.5 55.0 60.2 69.3 68.5
Luxembourg 30.5 16.2 48.6 - 33.3 0.0
Malta - 0.0 - 11.8 50.0 28.6
Poland 40.5 25.0 63.7 48.8 47.1 55.8
Portugal 61.6 36.9 59.2 56.6 67.2 65.4
Slovakia 40.6 28.3 56.7 51.0 51.4 74.6
Slovenia 36.9 33.6 47.3 34.4 52.8 34.6
Spain 41.3 38.8 46.7 46.9 40.5 47.8
Bulgaria 51.6 34.3 51.2 52.7 59.3 66.2
Iceland 26.2 40.8 50.3 25.5 49.3 51.5
Norway 27.9 17.2 48.8 36.5 42.0 47.6
Romania 48.0 44.3 65.8 29.0 59.8 42.5
NATURAL SCIENCES
ENGINEERING AND TECHNOLOGY
MEDICAL SCIENCES
AGRICULTURAL SCIENCES
SOCIAL
45
Estoni a f m EU-25 f
m
Austria f m
Bulgaria f m
Cyprus f m
Czech Rep.
f m
Denmark f m
Germany f m
Hungar y f m
Iceland f m
Ireland f m
Latvia f m
Malt a fm
Lithuania f m
Luxembo urg f
m
Norway f m
Portug al f m
Romania f m
Slovakia f m
Slovenia f m
Spain f m
0 20 40 60 80 % 100
Engineering and technology
Medical sciences Natural
sciences
Agricultural sciences
Figure 2.3: Distribution of researchers in the Government Sector (GOV) across fields of science, 2003
Source: Eurostat S&T statistics, EU-25 calculated by DG Research Exceptions to the reference year: AT, SI: 2002
No data: BE, EL, FR, IT, NL, FI, SE, UK, TR, CH
Social sciences
46
Table 2.5: Proportion of female researchers by economic activity (NACE) in the Business Enterprise Sector (BES), 2003
Source: Eurostat S&T statistics (except IS & FI - DG RTD, WiS database), EU-25 calculated by DG Research Exceptions to the reference year: AT, FI, SI, TR: 2002; IS 2001
Data unavailable: FR, MT, PL, UK, CH C: confidential data
Data estimated: SE
EU-25 15.5 43.7 23.6 34.9 20.4 24.0
Austria 7.7 41.4 18.6 31.7 15.3 14.2
Belgium 22.5 46.5 28.7 38.8 12.3 19.7
Cyprus 27.5 45.2 23.3 34.4 17.1 18.3
Czech Republic 12.7 43.4 25.8 31.8 19.6 33.6
Denmark 24.4 46.1 30.8 42.9 21.7 33.9
Estonia 25.9 c c 59.6 17.6 29.8
Finland 22.6 : : 36.5 19.1 21.8
Germany 11.2 37.1 20.2 27.5 14.0 14.0
Greece 45.9 37.5 : : 18.7 36.0
Hungary 27.0 53.7 35.5 49.9 20.9 19.8
Ireland 21.2 40.8 30.8 39.1 19.4 17.4
Italy 16.4 49.1 24.1 38.3 24.3 23.1
Latvia 63.3 : : 83.2 51.1 44.4
Lithuania 41.7 : : 54.4 27.2 12.5
Luxembourg 16.8 : : : 7.9 18.4
Netherlands 7.2 12.8 12.2 12.4 10.2 13.2
Portugal 27.1 c c : 26.1 39.3
Slovakia 21.5 c c 54.0 34.9 30.7
Slovenia 28.6 65.9 47.1 59.7 31.1 24.2
Spain 22.4 51.0 32.6 42.2 31.8 25.6
Sweden 24.2 52.1 40.0 49.4 23.0 44.1
Bulgaria 58.4 76.1 65.8 74.5 29.4 49.5
Iceland 26.7 41.4 28.6 - 35.1 28.4
Norway 18.0 55.8 31.5 42.1 18.3 22.4
Romania 39.6 : : 68.4 35.8 49.8
Turkey 22.2 69.3 39.3 52.3 34.0 30.6
TOTAL MANUFACTURING - D
(INCLUDING 24)
NACE CODE 24.4 -PHARMACEUTICALS
NACE CODE 24 (24.4) -CHEMICALS AND CHEMICAL PRODUCTS (LESS PHARMACEUTICALS)
NACE CODE 24 -MANUFACTURE OF CHEMICALS AND CHEMICAL PRODUCTS
REAL ESTATE, RENTING AND BUSINESS ACTIVITIES - K
47
Estonia f m
Finland f m
EU-25 f m
Austria f m
Belgium f m
Bulgaria f m
Cyprus f m
Czech Re p. f m
Denmark f m
German y f m
Greece f m
Hungary f m
Iceland f m
Ireland f m
Italy f m
Latvia f m
Lithua nia f m
Luxembourg f m
Netherlands f m
Norw ay f m Portug
al f m
Romania f m
Slovakia f m
Slovenia f m Spain
f m
Swede n f m
Turkey f m
[image:45.624.61.598.60.365.2]0 20 40 60 80 % 100
Figure 2.4: Distribution of researchers across economic activities (NACE) in the Business Enterprise Sector (BES), 2003
Source: Eurostat S&T statistics (except IS & FI - DG RTD, WiS database), EU-25 calculated by DG Research Exceptions to the reference year: AT, FI, SI, TR: 2002; IS 2001;
Data unavailable: FR, MT, PL, UK, CH Data estimated: SE
Total Manufacturing -D (including 24)
Real estate, renting and business activities - K
48
Table 2.6: Dissimilarity index for researchers in Higher Education Sector (HES) and Government Sector (GOV), 2003
Source: Eurostat S&T statistics, EU-25 calculated by DG Research Exceptions to the reference year: AT, SI, TR (HES): 2002; LU, SE (HES): 2001 Data unavailable: BE, EL, FR, IT, LV, NL, SE (GOV), UK
Data estimated: SE
Dissimilarity Dissimilarity
Index HES (DI) Index GOV (DI)
EU-25 0.14 0.21
Austria 0.22 0.19
Cyprus 0.15 0.31
Czech Republic 0.18 0.20
Denmark 0.17 0.17
Estonia 0.25 0.32
Germany 0.21 0.21
Hungary 0.20 0.26
Ireland 0.03 0.08
Lithuania 0.19 0.24
Luxembourg 0.41 0.19
Malta 0.22 0.44
Poland 0.20 0.21
Portugal 0.12 0.10
Slovakia 0.16 0.16
Slovenia 0.27 0.13
Spain 0.04 0.06
Sweden 0.19 :
Bulgaria 0.23 0.12
Iceland 0.07 0.19
Norway 0.17 0.18
Romania 0.14 0.13
Seniority
3. Seniority
50
Chapters 1 and 2 revealed the extent to which women are under-represented in the levels and types of employment considered in the She Figures. In particular, the chapters high-lighted the fact that there are marked gender differences in choice of field and sector of employment. In themselves these horizontal gender imbalances give rise to questions about the long-term viability of EU aspirations for R&D and the societal disadvantages of a gender-biased research environment. The questions increase in urgency when the vertical dimension is considered. This is the focus of chapters 3 and 4.
The vertical dimension of patterns of employment — that is, the relative distribution of women and men at the different levels of seniority within the employment hierarchy — is crucially important, since it is at the senior levels that decisions are made and leadership is exercised in defining and carrying forward the research agenda. In addition, the opportunities for women of equal ability with men to be promoted to senior posts at a proportionately commensurate rate is also a major element in defining career attractiveness for women leaving higher education and making long-term choices about field of employment. The distribution of women throughout the vertical axis of employment thus affects the present and influences the future.
At present, the data on seniority within academia (HES) is more robust than for the government (GOV) or business and enterprise (BES) sectors. There are several reasons for this, but chief among them is the relative consistency of academic employment grades
across the Member States. The terminology used varies considerably from country to country but, despite this, it is possible to collect data on the basis of shared definitions within broad bands of qualification and responsibility in ways that cannot yet be consistently achieved for employment in GOV and BES. This chapter will consequently examine HES in more detail than GOV and BES, taking grade A as the marker of ‘seniority’, broadly corresponding to ‘full professor’ or the highest grade/post at which research is normally conducted. It should be remembered, however, that chapters 1 and 2 demonstrated that women are better represented in HES than in some other sectors of European research. The vertical segregation that is evident in HES may thus be even more pronounced elsewhere. There is consequently a pressing need for systematic data collection, since this is essential for understanding employment patterns and for developing targeted policy interventions to improve the participation of women at the more senior levels.
Seniority in academia (HES)