radar rainfall nowcasting models
.
White Rose Research Online URL for this paper:
http://eprints.whiterose.ac.uk/153253/
Version: Published Version
Article:
Liu, Z., Dai, Q. and Zhuo, L. orcid.org/0000-0002-5719-5342 (2019) Relationship between
rainfall variability and the predictability of radar rainfall nowcasting models. Atmosphere, 10
(8). 458.
https://doi.org/10.3390/atmos10080458
[email protected] https://eprints.whiterose.ac.uk/ Reuse
This article is distributed under the terms of the Creative Commons Attribution (CC BY) licence. This licence allows you to distribute, remix, tweak, and build upon the work, even commercially, as long as you credit the authors for the original work. More information and the full terms of the licence here:
https://creativecommons.org/licenses/
Takedown
If you consider content in White Rose Research Online to be in breach of UK law, please notify us by
Article
Relationship between Rainfall Variability and the
Predictability of Radar Rainfall Nowcasting Models
Zhenzhen Liu1, Qiang Dai1,2,3,* and Lu Zhuo2
1 Key Laboratory of Virtual Geographic Environment, Nanjing Normal University, Ministry of Education,
Nanjing 210023, China
2 Water and Environmental Management Research Centre, Department of Civil Engineering, University of
Bristol, Bristol BS8 1TR, UK
3 Jiangsu Center for Collaborative Innovation in Geographical Information Resource Development and
Application, Nanjing 210023, China
* Correspondence: [email protected]; Tel.:+86-25-8589-1347
Received: 26 June 2019; Accepted: 8 August 2019; Published: 12 August 2019
Abstract:Radar rainfall nowcasts are subject to many sources of uncertainty and these uncertainties change with the characteristics of a storm. The predictive skill of a radar rainfall nowcasting model can be difficult to understand as sometimes it appears to be perfect but at other times it is highly inaccurate. This hinders the decision making required for the early warning of natural hazards caused by rainfall. In this study we define radar spatial and temporal rainfall variability and relate them to the predictive skill of a nowcasting model. The short-term ensemble prediction system model is configured to predict 731 events with lead times of one, two, and three hours. The nowcasting skill is expressed in terms of six well-known indicators. The results show that the quality of radar rainfall nowcasts increases with the rainfall autocorrelation and decreases with the rainfall variability coefficient. The uncertainty of radar rainfall nowcasts also shows a positive connection with rainfall variability. In addition, the spatial variability is more important than the temporal variability. Based on these results, we recommend that the lead time for radar rainfall nowcasting models should change depending on the storm and that it should be determined according to the rainfall variability. Such measures could improve trust in the rainfall nowcast products that are used for hydrological and meteorological applications.
Keywords: rainfall complexity; radar rainfall; nowcasting; rainfall uncertainty
1. Introduction
“Nowcasting” refers to automated weather forecasts for precipitation with a short term lead time (0–6 h) as well as high spatial (e.g., 1 km) and temporal (e.g., 5 min) resolutions [1–3]. It is an important tool in the management of natural hazards that are triggered by rainfall, such as landslides, debris flows, and urban floods, because it allows appropriate and timely action to be taken which can substantially mitigate the loss of life and property. Rainfall nowcasting simultaneously strives to optimize the lead time, accuracy, and resolution of the forecasts, but despite the efforts of the scientific community over the last decade, this remains a significant challenge. Weather radar can be used to predict short-term rainfall with acceptable accuracy and resolution. The general principle of radar nowcasting is that the reflectivity of radar scans is extrapolated to provide the rainfall distribution at regular intervals. Many radar rainfall nowcasting models have been developed based on this principle, including domain-based, object-based, statistical, and probabilistic approaches [4–14].
However, radar rainfall nowcasts are subject to many sources of uncertainty. Their accuracy is limited by the error affecting the radar rainfall measurements as well as the limitations of the nowcasting
models that are used to measure and predict rainfall motion and evolution [15,16]. A number of radar rainfall nowcasting models have attempted to quantify this uncertainty and to express the output statistics in probabilistic ways [17,18]. The uncertainty can be modeled using specific all error sources associated with the radar rainfall nowcasting procedure [19,20] or by a functional-statistical scheme that quantifies the relationship between the radar rainfall nowcasts and the corresponding true reference rainfall collected using methods such as gauge rainfall measurements [11,17]. However, at present there are no methods that can comprehensively and accurately model the uncertainty associated with radar rainfall nowcasts. For example, the physical-based radar rainfall uncertainty model may underestimate the uncertainty as it cannot enumerate all of the error sources and their interdependence. In contrast, the statistical-based uncertainty model may overestimate the uncertainty because external uncertainty may be introduced through gauge rainfall error or gauge representative error.
Due to these limitations, which affect both the deterministic and probabilistic forms, stakeholders can face difficulties when using radar rainfall nowcast products for practical applications. More importantly, the uncertainty of radar rainfall nowcasts and the predictability of nowcasting models change with the characteristics of a storm. For instance, the season is recognized as a significant factor affecting the quality of rainfall nowcast products [21]. In addition, many studies have shown that rainfall intensity is closely related to rainfall uncertainty [22,23]. Moreover, the spatial and temporal variability of storm motion and evolution will also affect the skill of a nowcasting model. This changing predictive skill can be difficult to understand as sometimes the models appear to be perfect while at other times they are highly inaccurate. This hinders the decision making required for the early warning of natural hazards caused by rainfall. For this reason, it is crucial to establish a storm-by-storm nowcasting predictability scheme and to understand the natural connection between rainfall characteristics and the predictive skill of a nowcasting model. To achieve this, it is necessary to understand which features of a storm affect the performance of nowcasting models and the mechanisms underlying this interaction. In this study, we explore the key indicators that represent storm features with a close relationship to radar rainfall nowcasts. By understanding this relationship, stakeholders will be able to interpret the skill of rainfall nowcasting models based on given rainfall observations.
This paper is organized as follows. After the introduction, Section2illustrates the study area, data sources, and analysis methods. The Short-Term Ensemble Prediction System (STEPS) model is also introduced. Section3presents the results of rainfall nowcasts and the relationship between storm variability and rainfall nowcasting skill. Finally, the conclusion section summarizes the key findings, limitations, and future work.
2. Data Sources and Methods
2.1. Study Area and Data Sources
The radar data used in this study was taken from the Met Office Nimrod system. This is a fully automated system for weather analysis and nowcasting that is based around a network of fifteen C-band rainfall radars. Four or five radar scans at different elevations are processed for each site in order to obtain the best possible estimate of the rainfall at ground level. The Nimrod system addresses a number of specific error sources. It also integrates a wide range of meteorological information, such as the numerical weather prediction (NWP) model output, satellite imagery, and rain gauge data, which allows it to provide surface precipitation estimates with a series of quality control and correction processes. This includes the identification and removal of spurious echoes resulting from anomalous propagation of the radar beam, errors resulting from variations in the vertical profile of the reflectivity, and radar sensitivity errors [24]. The Marshall–PalmerZ-Rrelationship is applied to convert radar reflectivity into rainfall intensity.
Z=200R1.6 (1)
spatial/temporal resolutions of 1 km/5 min and 5 km/15 min that can be used for hydrological and meteorological applications. Radar data with a spatial resolution of 1 km and a temporal resolution of 5 min covering a period between 2007 and 2010 was used in this study.
The rain gauge data used in this study was the tipping-bucket rain gauge, which was provided by the Environment Agency (http://www.environment-agency.gov.uk/). The hilly area to the east and south of Manchester with an area of approximately 5000 km2was chosen as the experimental domain for this study. Fifty rain gauges were located in the study area. A map of the rain gauge network with the terrain elevation in the background is shown in Figure1. The blue dots represent the rain gauge locations and the scale represents the radar pixels. The analysis performed in this study was mainly focused on the fifty pixels that contained a rain gauge. To illustrate the relationship between the positions of the gauges and the radars, we plotted circles with radii of 75 km centered at each weather station. The work was conducted for 731 rainfall events. Historical rainfall records are composed of wet and dry periods and a series of rainfall events are extracted from them. A continuous interval of dry period is used to divide rainfall events. Excluding some events where either the radar or gauge data were missing, these events cover all of the significant storms during the period. Four typical events were selected to illustrate the results of this investigation. These four events are mainly used for displaying the relationship between radar image and rainfall variability indicators. The ID, duration, and averaged rainfall over the catchment for each event are listed in Table1.
t (cm)
00 12:00
[image:4.595.81.518.345.530.2]Figure 1. Map of the rain gauge network with the terrain elevation in the background. The blue dots represent the rain gauge locations and the white dots represent the approximate locations of the weather radars. The numbers represent the index of the corresponding gauges.
Table 1.Details of four illustrative storm events.
Event Start Date End Date Mean Rainfall (cm)
1 28 April 2009 1:00 29 April 2009 02:00 0.59 2 5 December 2009 17:00 6 December 2009 12:00 0.70 3 14 July 2010 13:00 14 July 2010 23:00 1.20 4 13 July 2010 16:00 14 July 2010 04:00 0.36
2.2. Short-Term Ensemble Prediction System Model
field into a diverse-level multiplicative cascade using a fast Fourier transform algorithm. A band-pass filter based on a Gaussian window then passes the appropriate frequencies and then returns each component into the spatial domain by applying an inverse transform. A pattern-matching algorithm then calculates the average displacement of the field between successive time intervals. A second-order autoregressive (AR-2) process is used to model the development of the precipitation patterns.
In the modified version of the S-PROG model (the STEPS model), the advection velocity is determined using the optical flow method described by Bowler,et al. [27]. The cascade is respectively advected using optical flow in Lagrangian coordinates and stochastically evolves over time according to a hierarchy of auto-regressive processes of order two [28]. The noise term is omitted and modeled as an independent cascade for each time interval [3]. This cascade accounts for the uncertainty in the evolution of the precipitation field that is associated with the growth and decay processes. In addition, the STEPS model provides a connector that merges an extrapolation nowcast with a downscaled NWP forecast in order to extend the lead time to six hours.
The noise term can be ignored or modeled as a random variable, so the STEPS model offers two forms of rainfall nowcasts, namely deterministic and probabilistic schemes. In order to simultaneously investigate the predictability and uncertainty of rainfall nowcasts, the STEPS model is configured to run both of them. In addition, in order to focus on the radar rainfall nowcasting, an ensemble rainfall nowcast is produced without the NWP scheme.
2.3. Spatial and Temporal Variability of a Storm
The term rainfall variability may have various meanings according to different scientific views; however, it is in some sense an intuitive concept that has been widely studied [29–32]. In this study, it is confined to depict the variability embedded in the rainfall structure over space and time. Despite the highly fluctuating nature of rainfall, structure exists within the irregular patterns [33]. Analysis of the spatial and temporal variability of rainfall distribution is a practical and effective way to examine the meteorological characteristics of storm events. The spatial and temporal variations in rainfall intensity are of great importance in most practical hydrological applications. Many different indicators have been used to quantify the variability of a storm. In this work, Moran’s I (MI) indicator and the coefficient of variability (CV) were adopted to represent the storm variability from different perspectives.
MI[34] is a weighted correlation coefficient that is used to determine whether neighboring areas are more similar than would be expected under the null hypothesis. Given its simplicity, MI is frequently used outside of formal hypothesis testing in the exploratory analysis of spatially referenced data. In general,MIdetects the departure from spatial randomness and evaluates whether expressed pattern is clustered, dispersed, or random. AMIvalue close to+1.0 indicates clustering and a value close to−1.0 indicates dispersion. A zero value indicates a random spatial pattern. The formal equation for rainfall autocorrelation estimation is given by (2).
MI= P N
iPjwi,j P
iPjwi,j(Ri−R)(Rj−R)
P
i(Ri−R)2
(2)
Here,Ris the rainfall vector for all of the radar pixels ifMIcorresponds to the spatial Moran’s I; alternatively,Ris the rainfall vector for all of the temporal intervals ifMIcorresponds to the temporal Moran’s I. The subscriptsiandjrefer to the adjacent radar pixels or time intervals andwi,jis a weight denoting the strength of the connection between these pixels (or time intervals). In this study, the weight was calculated based on the inverse separate distance. Furthermore,Ndenotes the dimension of the rainfall vector. The other indicator, the coefficient of variability, can quantitatively measure the rainfall evenness/unevenness of the storm events, which is given by (3).
CV= v u t 1 N N X i=1 Ri
R −1
!2
A largerCVvalue represents higher variability, thus less even rainfall distribution. As withMI, CVcan describe both the spatial and temporal rainfall variability depending on the rainfall vector expressed in space or time.
2.4. Rainfall Nowcasting Skills
Both deterministic and probabilistic forms of rainfall nowcasts are investigated in this work. It is not difficult to evaluate the performance of deterministic rainfall nowcasts as they provide a single output for a given space and time. To obtain a comprehensive understanding of the nowcasting skill of the deterministic rainfall output, a series of indicators are introduced: mean absolute error (MAE), coefficient of determination (R2), relative bias (BIAS), Pearson’s correlation coefficient (COR), probability of detection (POD), and false alarm ratio (FAR). The error and bias are described by the metrics BIAS and MAE. The R2 and COR describe the degree of collinearity between the rainfall nowcasts and observations. Finally, the POD and FAR are contingency metrics. The POD describes the fraction of the observed precipitation events that are correctly detected by the evaluated product. In contrast, the FAR describes the fraction of the events detected by the product that are not observed.
Radar ensemble forecasts that reflect the possible uncertainty associated with rainfall nowcasts can be produced using the STEPS model. In probabilistic forms of rainfall nowcasts, a number of possible outcomes are generated for a given location and time interval. Uncertainty bands are then obtained to describe the uncertainty. The core features of the rainfall uncertainty bands are the spread of the bands (UD), which illustrates the degree of uncertainty, and the discrepancy between the uncertainty bands and the references rainfall measurements (UB). These are calculated using (4) and (5).
UD= 1
nt nt P i=1
R95(t)−R5(t) R50(t)
R50(t)>0 (4)
UB=
Pn i=1
R50(t)−G(t) Pn
i=1G(t)
(5)
Here,nis the number of time steps;ntthe number of time steps corresponding toR50that are larger than zero; andR95(t),R5(t), andR50(t) are the 95th, 5th, and 50th percentiles of the ensemble members at timet, respectively.Grepresents the gauge rainfall. The filter condition used to calculate theUDindicator is essential as in some cases most or all of the ensemble members are equal to zero when the rainfall is very low or equal to zero. The uncertainty bias is estimated by quantifying the differences between the 50th percentiles value of the ensemble members and the reference rainfall. When this is equal to zero the reference rainfall is well encompassed by the ensemble members.
3. Results
3.1. Radar Rainfall Nowcasts
The STEPS model was used to produce both deterministic and ensemble precipitation forecasts with spatial and temporal scales of 1 km and 1 h, respectively, and a lead time of three hours. The nowcast for each time interval was performed based on the data for t−2 h, t−1 h, and t h. The lead times of 1 h, 2 h, and 3 h were computed using the STEPS model with a 15 min time interval and 1 km spatial resolution. The aforementioned 731 events that occurred between 2007 and 2010 were set up respectively. Determination nowcasts were obtained for these events and the six indicators were calculated with the gauge rainfall as a reference. In addition, twenty ensemble members were produced for each time step and the two indicators (UBandUD) were derived.
The overall bias of the rainfall nowcasts generated by the STEPS model must be removed. Otherwise, the systematic deviation of the rainfall nowcasts will contaminate the results. The overall biasOB(Tl)for the lead timelis calculated using (6).
OB(Tl) = Ptn
t=1 Ppn
p=1Rt,p(Tl)
Ptn t=1
Ppn p=1Gt,p
(6)
Here,Rt,pandGt,prepresent the radar rainfall forecasts and gauge rainfall for timetand pixelp, respectively. In addition,tnandpnrepresent the number of time steps and radar pixels, respectively.
3.2. Spatial and Temporal Rainfall Variability Calculation
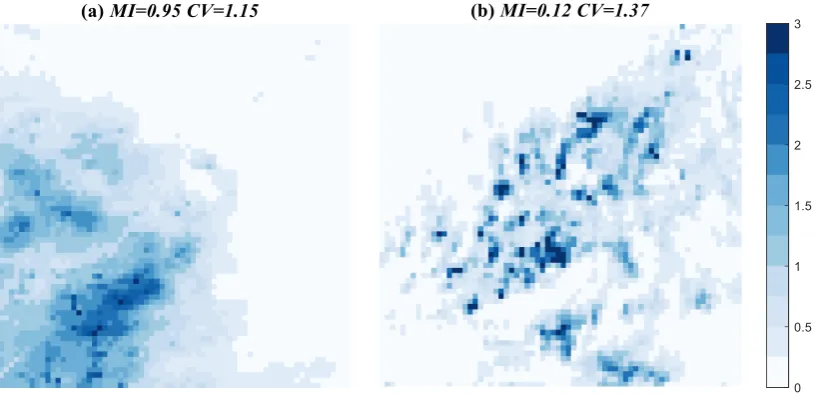
Examples of rainfall spatial variability derived using (2) and (4) are shown for four observations in Figure2. The four images correspond to a highMI(Figure2a), a lowMI(Figure2b), a highCV (Figure2c), and a lowCV(Figure2d). In Figure2a, the rainy area is concentrated at the bottom-left corner and changes gradually across the map. In Figure2b, the rainfall intensity is more chaotic and random, which produces a much largerMIthan the previous observation. In terms of theCV, the variation in the rainfall intensity is much larger in Figure2c than in Figure2d. In Figure2c, there are some areas with no rain in addition to the area with heavy rain (rainfall intensity greater than 6 mm over 5 min). For clarity, the ranges of the color bars are different for each of the images. Noted that no negative MI values are observed in the figure. In fact, MI is a weighted correlation coefficient that is used to determine whether neighboring areas are more similar. The rain is naturally spatial dependent and has strong spatial correlation. For this reason, almost all MI values are positive.
[image:7.595.97.505.555.752.2]nowcast for each time interval was performed based on the data for t h t h and t h The lead
Figure 2. Radar rainfall (mm/h) images for four events with different spatial rainfall variability. (a)MI=0.95,CV=1.15, (b)MI=0.12,CV=1.37, (c)MI=0.52,CV=1.96, (d)MI=0.55,CV=0.43.
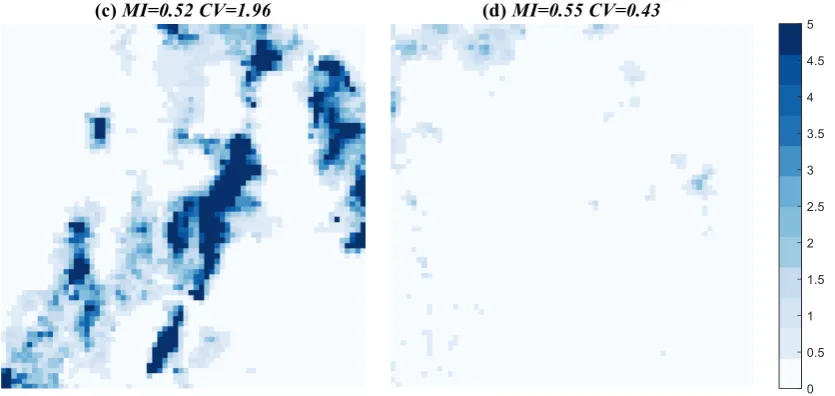
Figure 3.Radar rainfall estimates for four events with different temporal rainfall variability. (a)MI=0.94, CV=1.88, (b)MI=0.47,CV=1.76, (c)MI=0.75,CV=3.70, (d)MI=0.84,CV=0.99.
0.5 1.7 0.7 1.5
0.7 2.5 0.8 2.1
[image:10.595.100.496.91.406.2]1.0 5.0 1.0 5.0
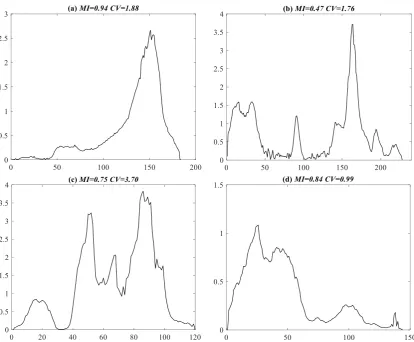
[image:10.595.195.401.453.497.2]Figure 4.Relationship between rainfall variability and rainfall nowcasting correlation skill.
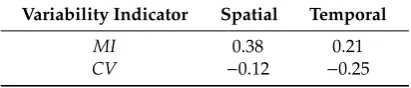
Table 2.Correlation coefficients between rainfall variability and rainfall nowcasting correlation skill.
Variability Indicator Spatial Temporal
MI 0.38 0.21
CV −0.12 −0.25
To investigate the relationship between rainfall variability and predictability, all of the events were divided into three groups based on theirMIandCVvalues. The division values for the spatial and temporal variability are listed in Table3. The divisions were chosen to make sure the number of events in each domain was approximately equal. As we did not plan to explore the strict quantified relationship between rainfall variability and predictability, and since the number of events is limited, it was not necessary to classify the events further.
Table 3.Classification of spatial and temporal variability.
Variability Type Spatial Temporal
MI CV MI CV
L 0.0–0.5 0.0–1.7 0.0–0.7 0.0–1.5 M 0.5–0.7 1.7–2.5 0.7–0.8 1.5–2.1 H 0.7–1.0 2.5–5.0 0.8–1.0 2.1–5.0
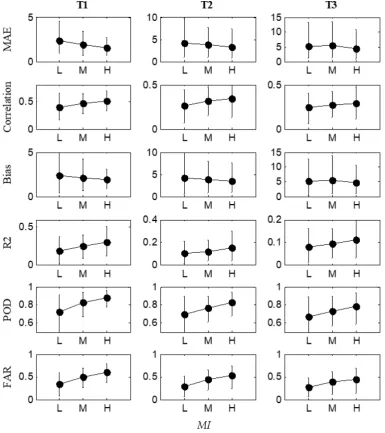
3.3. Relationship between Storm Variability and Rainfall Nowcasting Skill
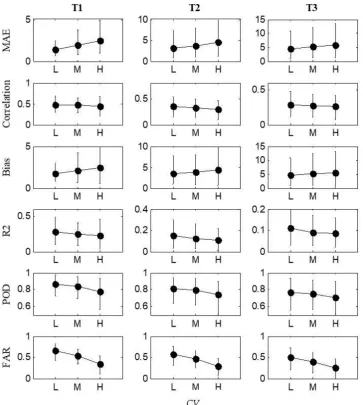
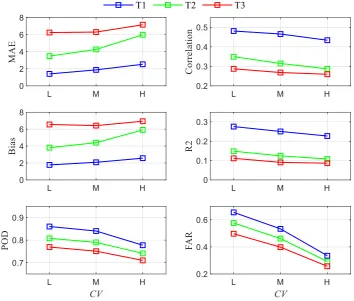
[image:10.595.165.433.624.696.2]events are drawn. The figure shows that the MAE and bias of the rainfall nowcasts decrease as the rainfallMI increases, while the remaining indicators show a positive relationship. AsMIreflects the autocorrelation of rainfall, we conclude that the skill of the radar nowcasting model increases as the rainfall autocorrelation increases. This is especially significant for lead times of 1 and 2 h. The opposite trend was observed for the FAR indicator. Due to the representative effect, weather radar is more likely to report rain while the rain gauge catches no rain. For this reason, the nowcasting model may perform well, even if the FAR indicator is high. The relationships between theCVand the six indicators are shown in Figure6. In contrast to theMI-skills relationship, the MAE and bias show a positive connection to the rainfallCVand the remaining performance indicators show negative effects. In other words, the rainfall nowcasting skill decreases as the rainfallCVvalues increase.
[image:11.595.106.492.238.672.2]Figure 6. Relationship between the rainfall nowcasting skill and rainfall spatial coefficients of variability (CVs).
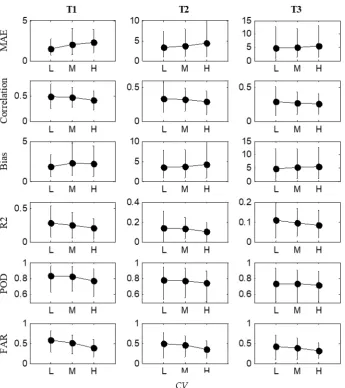
Figure 8.Relationship between rainfall nowcasting skill and rainfall temporal CVs.
rainfall spatial Moran s I values
Figure 9.Comparison of rainfall nowcasting skills shown in Figure5under different lead times and rainfall spatial Moran’s I values.
rainfall spatial Moran s I values
[image:15.595.121.476.433.734.2]rainfall temporal Moran s I values
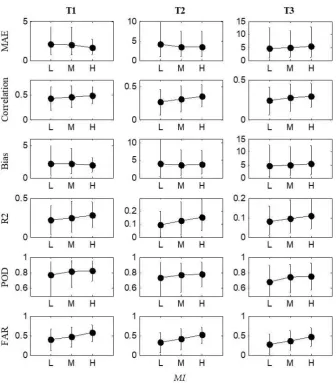
Figure 11.Comparison of rainfall nowcasting skills shown in Figure7under different lead times and rainfall temporal Moran’s I values.
[image:16.595.122.477.432.732.2]3.4. Relationship between Storm Variability and Rainfall Uncertainty Band
Considering the uncertainty associated with the rainfall nowcasting process, an ensemble of rainfall nowcasts was generated to represent the future rainfall intensity. The relationship between the uncertainty band and the storm variability could help to improve our understanding of the quality of radar rainfall nowcasting under different situations.
[image:17.595.121.475.287.584.2]The ensemble dispersion and ensemble bias of the uncertainty bands under different rainfall variability scenarios are shown in Figures13and14. The mean statistics were calculated for each scenario. It is clear that the ensemble dispersion statistics decrease dramatically as the rainfallMI indicator increases and theCVdecreases. In other words, the uncertainty of the radar rainfall nowcasts has a positive relationship with storm variability. The same trend was observed for both spatial and temporal variability. In addition, the ensemble bias remained approximately the same under different storm variability conditions. In other words, storm variability will affect the uncertainty of radar rainfall nowcasts, but it has a limited effect on the bias of the uncertainty bands.
Figure 14.Relationship between radar rainfall uncertainty bands and rainfall temporal variability.
3.5. Rainfall Predictability under Different Storm Variability Scenarios
Table 4.Nowcasting skill for different spatial variability scenarios with a lead time of 1 h.
Scenario MAE COR BIAS R2 POD FAR
LL 1.96 0.22 2.38 0.08 0.90 0.52 LM 1.66 0.39 1.74 0.19 0.82 0.46 LH 2.62 0.40 2.58 0.19 0.69 0.30 ML 1.42 0.42 1.69 0.21 0.89 0.62 MM 2.13 0.46 2.27 0.25 0.83 0.49 MH 2.00 0.49 2.12 0.28 0.77 0.43 HL 1.38 0.50 1.77 0.30 0.89 0.64 HM 2.02 0.53 2.32 0.31 0.85 0.51 HH 1.99 0.58 2.27 0.31 0.82 0.56
Table 5.Nowcasting skill for different temporal variability scenarios with a lead time of 1 h.
Lead MAE COR BIAS R2 POD FAR
LL 1.76 0.49 1.91 0.30 0.77 0.43 LM 1.99 0.45 2.23 0.22 0.82 0.47 LH 2.38 0.39 2.30 0.17 0.75 0.36 ML 1.56 0.49 1.88 0.28 0.87 0.56 MM 2.27 0.46 2.48 0.25 0.82 0.50 MH 2.12 0.43 2.12 0.22 0.79 0.42 HL 1.37 0.48 1.78 0.28 0.85 0.66 HM 1.86 0.50 2.11 0.29 0.83 0.55 HH 2.22 0.49 2.30 0.27 0.78 0.41
In terms of the ensemble rainfall nowcasts, the LH and MH scenarios had relatively high nowcasting uncertainty, while there was no significant difference in ensemble bias between the different scenarios. Hence the width of the rainfall uncertainty bands is closely related to storm variability.
4. Discussion and Conclusions
A clear understanding of the performance of the radar rainfall nowcasting model can enable stakeholders to be more confident in their decision making. It is important to determine the features of storms that affect the skill of radar rainfall nowcasting models. In this study, we defined radar spatial and temporal rainfall variability, which included the rainfall autocorrelation and rainfall variability coefficient of storms, and related them to the nowcasting skill. The STEPS model was configured to predict 731 events with lead times of one, two, and three hours. The nowcasting skill was comprehensively expressed using six well-known indicators. We found that the quality of radar rainfall nowcasts increases as the rainfall autocorrelation increases and decreases as the rainfall variability coefficient increases. The best performance was observed in the HL scenario (high autocorrelation and low variability) among all scenarios. The uncertainty in radar rainfall nowcasts also showed a positive relationship with rainfall variability. It is not surprising that the nowcasting performance decreases as the lead time increases. If a basic requirement is set for decision making (for example, the mean absolute error should be less than four), then the maximum predicted time varies with the spatial and temporal rainfall variabilities. We recommend that the lead time for radar rainfall nowcasting models should be fixed according to the rainfall variability.
[image:19.595.166.431.262.385.2]of the problem. This study reveals some possible trends and a common qualified function could be established following a wealth of research by the community across many regions.
In addition, in this study the rainfall variability was only described in terms of rainfall autocorrelation and rainfall variability, and each of these factors were represented by one indicator. However, there are far more indicators that can be used to describe these characteristics and other aspects of rainfall variability could be explored. Meanwhile, we used the most popular indicators to represent the radar rainfall nowcasting skill, but there may be more indicators that are also worthy of consideration. We hope that an indicator system may be established to fully represent rainfall complexity and predictability.
Finally, only one nowcasting model (STEPS) was used in this study. Although this model has been used worldwide and it has been shown to be cogent and reasonable by many researchers, it cannot represent all model structures and current nowcasting schemes. In future works we will investigate other models in order to provide further guidance to stakeholders so that they can have a greater understanding of the available radar rainfall nowcast products.
Author Contributions: Z.L. was responsible for the literature search and completing the experiments. Q.D. designed the study and wrote large portions of the manuscript. L.Z. contributed to some writing of the manuscript. All authors contributed to the discussion of model results.
Acknowledgments:This research was funded by National Natural Science Foundation of China (No. 41871299), Newton Fund via Natural Environment Research Council (NERC) and Economic and Social Research Council (ESRC) (NE/N012143/1). The authors would like to thank BADC, ECMWF, the UK Environment Agency and the UK Met Office for providing the data sets used in this study. We also thank the UK Met Office for providing the STEPS model.
Conflicts of Interest:The authors declare no conflict of interest.
References
1. Wilson, J.W.; Ebert, E.E.; Saxen, T.R.; Roberts, R.D.; Mueller, C.K.; Sleigh, M.; Pierce, C.E.; Seed, A. Sydney 2000 forecast demonstration project: Convective storm nowcasting. Weather Forecast. 2004,19, 131–150. [CrossRef]
2. Browning, K. Review Lecture: Local Weather Forecasting.Proc. R. Soc. Lond. A Math. Phys. Eng. Sci.1980, 371, 179–211. [CrossRef]
3. Liguori, S.; Rico-Ramirez, M.A. Quantitative assessment of short-term rainfall forecasts from radar nowcasts and MM5 forecasts.Hydrol. Process.2012,26, 3842–3857. [CrossRef]
4. Tuttle, J.D.; Foote, G.B. Determination of the boundary layer airflow from a single Doppler radar.J. Atmos. Ocean. Technol.1990,7, 218–232. [CrossRef]
5. Dixon, M.; Wiener, G. TITAN: Thunderstorm identification, tracking, analysis, and nowcasting-A radar-based methodology.J. Atmos. Ocean. Technol.1993,10, 785–797. [CrossRef]
6. Johnson, J.; MacKeen, P.L.; Witt, A.; Mitchell, E.D.W.; Stumpf, G.J.; Eilts, M.D.; Thomas, K.W. The storm cell identification and tracking algorithm: An enhanced WSR-88D algorithm.Weather Forecast.1998,13, 263–276. [CrossRef]
7. Handwerker, J. Cell tracking with TRACE3D—A new algorithm.Atmos. Res.2002,61, 15–34. [CrossRef] 8. Grecu, M.; Krajewski, W. A large-sample investigation of statistical procedures for radar-based short-term
quantitative precipitation forecasting.J. Hydrol.2000,239, 69–84. [CrossRef]
9. Montanari, L.; Montanari, A.; Toth, E. A comparison and uncertainty assessment of system analysis techniques for short-term quantitative precipitation nowcasting based on radar images.J. Geophys. Res. Atmos.2006, 111. [CrossRef]
11. Dai, Q.; Rico-Ramirez, M.A.; Han, D.; Islam, T.; Liguori, S. Probabilistic radar rainfall nowcasts using empirical and theoretical uncertainty models.Hydrol. Process.2015,29, 66–79. [CrossRef]
12. He, S.; Raghavan, S.V.; Nguyen, N.S.; Liong, S.Y. Ensemble rainfall forecasting with numerical weather prediction and radar-based nowcasting models.Hydrol. Process.2013,27, 1560–1571. [CrossRef]
13. Zahraei, A.; Hsu, K.l.; Sorooshian, S.; Gourley, J.; Lakshmanan, V.; Hong, Y.; Bellerby, T. Quantitative precipitation nowcasting: A Lagrangian pixel-based approach.Atmos. Res.2012,118, 418–434. [CrossRef] 14. Yu, P.S.; Yang, T.C.; Chen, S.Y.; Kuo, C.M.; Tseng, H.W. Comparison of random forests and support vector
machine for real-time radar-derived rainfall forecasting.J. Hydrol.2017,552, 92–104. [CrossRef]
15. Seed, A. A dynamic and spatial scaling approach to advection forecasting.J. Appl. Meteorol.2003,42, 381–388. [CrossRef]
16. Dai, Q.; Han, D.; Rico-Ramirez, M.A.; Islam, T. The impact of raindrop drift in a three-dimensional wind field on a radar–gauge rainfall comparison.Int. J. Remote Sens.2013,34, 7739–7760. [CrossRef]
17. Cecinati, F.; Rico-Ramirez, M.A.; Heuvelink, G.B.; Han, D. Representing radar rainfall uncertainty with ensembles based on a time-variant geostatistical error modelling approach. J. Hydrol.2017,548, 391–405. [CrossRef]
18. Dai, Q.; Han, D.; Rico-Ramirez, M.; Srivastava, P.K. Multivariate distributed ensemble generator: A new scheme for ensemble radar precipitation estimation over temperate maritime climate.J. Hydrol.2014,511, 17–27. [CrossRef]
19. Germann, U.; Zawadzki, I. Scale-dependence of the predictability of precipitation from continental radar images. Part I: Description of the methodology.Mon. Weather Rev.2002,130, 2859–2873. [CrossRef] 20. Bowler, N.E.; Pierce, C.E.; Seed, A.W. STEPS: A probabilistic precipitation forecasting scheme which merges
an extrapolation nowcast with downscaled NWP.Q. J. R. Meteorol. Soc.2006,132, 2127–2155. [CrossRef] 21. Dai, Q.; Han, D.; Zhuo, L.; Zhang, J.; Islam, T.; Srivastava, P.K. Seasonal ensemble generator for radar rainfall
using copula and autoregressive model.Stoch. Environ. Res. Risk Assess.2016,30, 27–38. [CrossRef] 22. Villarini, G.; Krajewski, W.F. Review of the different sources of uncertainty in single polarization radar-based
estimates of rainfall.Surv. Geophys.2010,31, 107–129. [CrossRef]
23. Villarini, G.; Seo, B.C.; Serinaldi, F.; Krajewski, W.F. Spatial and temporal modeling of radar rainfall uncertainties.Atmos. Res.2014,135, 91–101. [CrossRef]
24. Harrison, D.L.; Scovell, R.W.; Kitchen, M. High-resolution precipitation estimates for hydrological uses. In Proceedings of the Institution of Civil Engineers-Water Management; ICE: Washington, DC, USA, 2009; pp. 125–135.
25. Berenguer, M.; Sempere-Torres, D.; Pegram, G.G. SBMcast—An ensemble nowcasting technique to assess the uncertainty in rainfall forecasts by Lagrangian extrapolation.J. Hydrol.2011,404, 226–240. [CrossRef] 26. Seed, A.W.; Pierce, C.E.; Norman, K. Formulation and evaluation of a scale decomposition-based stochastic
precipitation nowcast scheme.Water Resour. Res.2013,49, 6624–6641. [CrossRef]
27. Bowler, N.E.; Pierce, C.E.; Seed, A. Development of a precipitation nowcasting algorithm based upon optical flow techniques.J. Hydrol.2004,288, 74–91. [CrossRef]
28. Foresti, L.; Seed, A. The effect of flow and orography on the spatial distribution of the very short-term predictability of rainfall from composite radar images.Hydrol. Earth Syst. Sci.2014,18, 4671–4686. [CrossRef] 29. Faurès, J.M.; Goodrich, D.; Woolhiser, D.A.; Sorooshian, S. Impact of small-scale spatial rainfall variability on
runoffmodeling.J. Hydrol.1995,173, 309–326. [CrossRef]
30. Buytaert, W.; Celleri, R.; Willems, P.; De Bievre, B.; Wyseure, G. Spatial and temporal rainfall variability in mountainous areas: A case study from the south Ecuadorian Andes.J. Hydrol.2006,329, 413–421. [CrossRef] 31. Tucker, G.E.; Bras, R.L. A stochastic approach to modeling the role of rainfall variability in drainage basin
evolution.Water Resour. Res.2000,36, 1953–1964. [CrossRef]
32. Zhang, J.; Han, D. Assessment of rainfall spatial variability and its influence on runoffmodelling: A case study in the Brue catchment, UK.Hydrol. Process.2017,31, 2972–2981. [CrossRef]
33. Rodríguez-Iturbe, I. Exploring complexity in the structure of rainfall.Adv. Water Resour.1991,14, 162–167.
[CrossRef]
35. Dai, Q.; Yang, Q.; Zhang, J.; Zhang, S. Impact of Gauge Representative Error on a Radar Rainfall Uncertainty Model.J. Appl. Meteorol. Clim.2018,57, 2769–2787. [CrossRef]
36. Bringi, V.; Rico-Ramirez, M.; Thurai, M. Rainfall estimation with an operational polarimetric C band radar in the United Kingdom: Comparison with a gauge network and error analysis.J. Hydrometeorol.2011,12, 935–954. [CrossRef]