Int. J. Electrochem. Sci., 11 (2016) 10522 – 10535, doi: 10.20964/2016.12.62
International Journal of
ELECTROCHEMICAL
SCIENCE
www.electrochemsci.org
Lithium-Ion Batteries Anodic Performance of Porous Sn/C-ZnO
Core-Shell Structures Derived from ZIF-8
Shouhui Chen*, Rihui Zhou, Yaqin Chen, Ping Li, Yonghai Song and Li Wang
College of Chemistry and Chemical Engineering, Jiangxi Normal University, 99 Ziyang Road, Nanchang 330022, People’s Republic of China
*
E-mail: [email protected]
Received: 17 September 2016 / Accepted: 21 October 2016 / Published: 10 November 2016
Zeolitic imidazolate frameworks are a class of metal organic frameworks which are very attractive for their pore structures. However, their pore size and the BET surface would shrink when they underwent heat treatment at high temperature. On the other hand, liquid metal in MOFs might flow through the pores and prevent the shrinkage when pyrolysis. As is known that metallic Sn is liquid when the temperature is above 232 °C, flowing Sn might support and maintain the porous structure of MOFs during the pyrolysis. In this work, porous Sn/C-ZnO core-shell structures were prepared as anodes for LIBs via a two-step method. Firstly, SnO2 particles were encapsulated in a ZIF-8 layer with different
thickness. Then Sn/C-ZnO was generated in inert atmosphere at 700 °C. A Sn/C-ZnO composite, with 11.2% of Sn and 21.0% of ZnO in content, had a BET surface of 32.9 m2 g-1. Another Sn/C-ZnO composite, with 55.1% of Sn and 1.8% of ZnO in content, had a larger BET surface of 297 m2 g-1. Then the two composites were tested as anodes for LIBs. Although the BET surface of the former was significantly less than that of the latter before cycling and the content of Sn in the former was also much lower than that of the latter, the discharge capacity of the former after 50 cycles was 515.6 mAh g-1 at 100 mA g-1 in the potential of 0.01~3.00 V, which was slightly higher than that of the latter.
Keywords: Lithium-ion batteries; anode; MOFs; metallic Sn; core-shell structure
1. INTRODUCTION
they can serve as precursors or templates to prepare composites containing metals [3-5] or porous carbon materials. For instance, zeolitic imidazolate frameworks (ZIFs) is a class of MOFs which constructed from metal ions and imidazolate ligands. Nanoparticles (NPs)/ZIFs composites could be synthesized either by insetting NPs in the ZIFs’ cavities or by using ZIFs to encapsulate NPs [6,7]. For example, our group prepared a cage-like Si/C composite via benzoic acid functionalized Si@ZIF-8 [8]. Likewise, Huang et al firstly prepared MWCNTs/ZIF-67, and then pyrolyzed it to form MWCNTs/Co3O4 for anode in LIBs [9]. However, the pore size and the BET surface of MOFs might
shrink when they underwent heat treatment at high temperature [10], which would increase the path length for charge and ions transport and would also reduce the electronic contact area between the electroactive material and the electrolyte.
Tin is considered as another alternative anode material to replace graphite for LIBs because of the relatively high theoretical specific capacity (960 mAh g-1), high volumetric capacity (1991 mAh cm-3) and good electronic conductivity [11]. It is an abundant, easily mined and environmentally benign material, which is vital for mass manufacturing of batteries. However, similar to other Group IV elements (Si and Ge) which would alloy with lithium [12-14], the major challenge hindering Sn from practical application in LIBs was the huge volume change (259%) during the discharge-charge processes [15]. To solve this problem, uniformly dispersing Sn NPs in a third conductive phase was a common strategy to improve its electrochemical performance for LIBs [16], i.g., carbon material is one of the conductive phases [17,18]. Sn-based composites with porous carbon structure would not only alleviate the mechanical stress induced by the volume change, but also facilitate the penetration of electrolyte and shorten Li+ diffusion length in solid phase [19]. Study showed that flexible graphene or carbon nanofibers could be functionalized to adsorb tin salt, and then metallic Sn NPs would generate after heat treatment [20]. Metals are undoubtedly another conductive phases. Alloying Sn with inactive metals (Ni, Sb, Co, Cu and Al, etc.) could also buffer the expansion/shrinkage of volume during cycling [21,22].
In this work, we used a facile fabrication method to prepare porous Sn/C-ZnO composite with the aid of ZIF-8’s porosity. The first step was using ZIF-8 to encapsulate SnO2 NPs whose surface was
functionalized with PVP at room temperature. Due to the thickness of ZIF-8 layer was different, the precursors were pyrolyzed to generate Sn core with different thickness of C-ZnO shell. The nanostructure of Sn/C-ZnO composites was analyzed by physical and electrochemical methods. It was found that the contents of Sn and ZnO in the composites were different. Both ZnO and the oxides of Sn have the conversion reaction mechanism and alloy-dealloy reaction with Li in the discharge-charge process, Hence, the electrochemical characteristics of the Sn/C-ZnO composites were estimated as the form of anode for LIBs.
2. EXPERIMENTAL
2.1 Materials
Zinc nitrate hexahydrate (Zn(NO3)2·6H2O), tin chloride dihydrate (SnCl2·2H2O), resorcinol,
purchased from Sinopharm chemical reagent Co.,Ltd. 2-methylimidazole (MeIM) was obtained from Aladdin industrial cooperation. All chemicals used in this study were analytical grade.
2.2 Preparation of porous SnO2 nanopaticles
The porous SnO2 NPs were synthesized by a modified procedure described by Gurunathan et al
[23]. In a typical synthesis, 8.00 g of SnCl2·6H2O, 5.20 g of resorcinol and 16.0 mL of 37%
formaldehyde solution were mixed in 160 mL of H2O for about 30 minutes. Then the solution was
sealed in a 250 mL round-bottom flask and kept in water bath at 80 °C for 4 hours. The resulting red gel was dried at 80 °C in an electric oven and calcined at 700 °C for 4 hours in N2 and air atmosphere
in sequence. Finally, the obtained white SnO2 was mechanically ground into fine powder for 30
minutes in mortar.
[image:3.596.89.509.329.622.2]2.3 Preparation of Sn/C-ZnO derived from ZIF-8
Figure 1. Schematic representation of the preparation of porous Sn/C-ZnO derived from ZIF-8.
The preparation of Sn/C-ZnO core-shell structure was illustrated in Fig. 1. Firstly, 10.0 mg of SnO2 NPs was dispersed in a solution of PVP (625.0 mg) in methanol (25.0 mL) with stirring for 24
hours. Secondly, 186.0 mg Zn(NO3)2·6H2O and 102.6 mg MeIM were dissolved in the above solution,
which was kept at room temperature for 7 days until the solution turned to completely transparent. Then, the white precipitate was collected by three times of rinse-centrifugation cycles with H2O and
N2 atmosphere for 4 hours, and the final product was denoted as SnZCw. Comparatively, a control
sample denoted as SnZCd was prepared in a similar procedure with a shorter time of 24 hours to incubate another SnO2@ZIF-8, after which the solution was still white turbid.
2.4 Characterization
The scanning electron microscopy (SEM) analysis was made via a Hitachi S3400N with E-550 energy dispersive spectroscopy. The transmission electron microscopy (TEM) was observed in JEOL JEM 2100. Thermogravimetric analysis was performed on a Perkin-Elmer Pyris Diamond TG/DTA instrument at a heating rate of 10 °C min-1 in air. Powder X-ray diffraction (XRD) patterns were collected on a Bruker D8 Advanced X-ray diffractometer using Cu Ka radiation. N2 sorption isotherm
was determined by using a BELSORP-mini II instrument at 77K. Raman spectra were recorded on a Jobin-Yvon LabRam-HR spectrometer with an excitation laser source of 633 nm. Atomic absorption spectra (AAS) were tested on Perkin-Elmer AAnalyst 400 with the 213.8 nm Zn emission line from hollow cathode lamp.
2.5 Electrochemical measurements
The electrochemical measurements were carried out using CR2032 button cells, which were assembled as our previous reported work described [24]. The working electrode consisted of active material, carbon black and PVDF binder in a weight ratio of 8:1:1, and the loading mass of active material on it was about 0.60 mg cm-2. Lithium metal acted as the counter and reference electrode. The separator was a Celgard 2300 film and the electrolyte was 1 mol L-1 LiPF6 in a 1:1 (w/w) mixture of
ethylene carbonate and diethyl carbonate. Galvanostatic discharging/charging was performed on a Land battery test system at different current rates within the potential of 0.01~3.00 V. Cyclic voltammetry (CV) curves were collected on a CHI760D electrochemical workstation at a scan rate of 0.2 mV s-1 in the potential of 0.01~3.00 V. Electrochemical impedance spectroscopy (EIS) measurements were carried out by applying an AC voltage with 10 mV amplitude in a frequency range from 0.01 Hz to 100 kHz at open circuit potential. The equivalent circuit suitable for the EIS data was simulated via ZSimpWin software.
3. RESULTS AND DISCUSSION
3.1 Characteristics of Sn/Carbon-ZnO
The porous SnO2 spheres were selected as the tin source to prepare Sn/C-ZnO composites. The
spheres were ca. 800 nm in diameter (Fig. 2A), which consisted of SnO2 NPs with a diameter of ca. 40
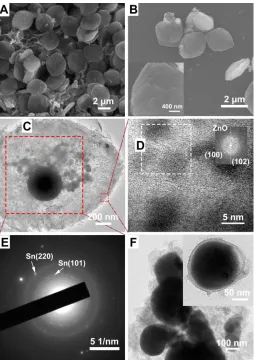
Figure 2. (A) SEM images at different magnifications; (B) XRD pattern; (C) Raman spectrum and (D) N2 adsorption/desorption isotherm and pore size distribution of SnO2.
[image:5.596.172.426.347.708.2]
Three characteristic phonon modes of SnO2, Eg, A1g and B2g, were observed in the Raman
spectrum at 477, 635 and 738 cm-1, respectively (Fig. 2C) [26]. According to N2 sorption isotherm of
SnO2 spheres (Fig. 2D), the Brunauer-Emmett-Teller (BET) surface area and total pore volume of
SnO2 spheres were only 4.18 m2 g-1 and 0.0580 cm3 g-1, respectively.
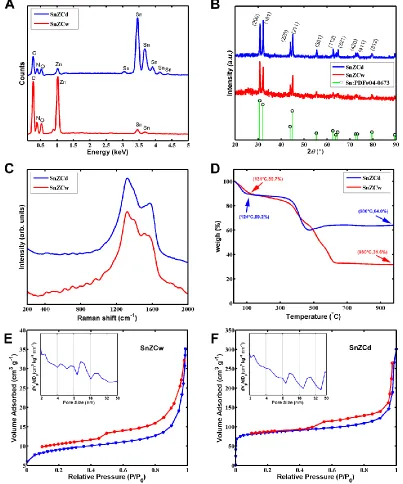
Figure 4. (A) EDS spectra, (B) XRD patterns, (C) Raman spectra and (D) TGA plot of SnZCw and SnZCd; N2 sorption isotherms and pore size distribution (Inset) of (E) SnZCw and (F) SnZCd.
The first step was growing ZIF-8 on SnO2 NP. Lu et al reported a classic strategy to
[image:6.596.97.500.159.643.2]
time at room temperature. SnZCw had experienced 7 days for incubating ZIF-8 on SnO2. Fig. 3A
showed that the morphologies of its precursor were quadrangle with rounded corner. After pyrolyzed in N2 at 700 °C, the morphology of final SnZCw shrank a little with a size of about 1.6 μm × 1.4 μm
(Fig. 3B). It seemed that SnZCw was accumulated by sheets-like structure according to the inset in Fig. 3B. TEM image (Fig. 3C) showed that there was a sphere core in the SnZCw and some dark stains sparsely dispersed around it. Furthermore, sheets-like structures could also be observed around the outskirts of SnZCw. HRTEM image and the FFT image (the inset in Fig. 3D) indicated the existence of ZnO [28]. According to the SAED pattern (Fig. 3E), two dotted cycles indicated the (101) and (220) crystal plane of metallic Sn, which was confirmed by XRD [29]. The spherical core and the dark stains around it were Sn, which were the reduction product of SnO2 and the result of fusion and flow of Sn
particles. Hence, SnZCw was a composite of Sn core coated with a thicker carbon layer doped with ZnO. The control sample, SnZCd, had experienced 24 hours for incubating ZIF-8 on SnO2. It was a
porous composite which has Sn core with a thinner C-ZnO shell (Fig. 3F).
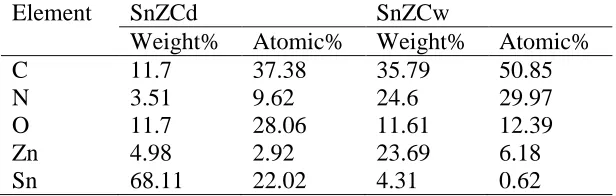
[image:7.596.145.453.450.548.2]EDS spectra were firstly used to estimate the elements distribution in both SnZCw and SnZCd. As shown in Fig. 4A and Table 1, the content of Zn in SnZCw was distinctively larger than that of Sn. While in the case of SnZCd, an opposite result would come. The values in SnZCw related to element C, N and Zn, which derived from ZIF-8, were much higher than those in SnZCd. It met the prediction from the TEM images, in which the most part in SnZCw was the annealed derivative from ZIF-8, while the most part in SnZCd was Sn.
Table 1. Comparison of the element contents in SnZCd and SnZCw via EDS analysis.
Element SnZCd SnZCw
Weight% Atomic% Weight% Atomic%
C 11.7 37.38 35.79 50.85
N 3.51 9.62 24.6 29.97
O 11.7 28.06 11.61 12.39
Zn 4.98 2.92 23.69 6.18
Sn 68.11 22.02 4.31 0.62
The phase purity of the annealed products was examined by power XRD analysis. The XRD patterns of both SnZCw and SnZCd (Fig. 4B) presented series of diffraction peaks at 2θ = 30.7°, 32.2°, 43.9° and 45.0°, which represented the (200), (101), (220) and (211) crystalline planes of Sn (JCPDS card No. 04-0673)[30]. No XRD peak related to ZnO was found in the figure, indicating lower crystallinity of ZnO. There were also no peaks associated with carbon materials, indicating the existence of amorphous carbon [31]. The formation of amorphous carbon in SnZCw could be confirmed by Raman spectra (Fig. 4C), which was indicated by the characteristic Raman peaks of carbon at 1319 cm-1 (D-band) and 1557 cm-1 (G-band)[32]. Likewise, the Raman spectrum of SnZCd also revealed the presence of amorphous carbon. Together with the above results, amorphous carbon, ZnO and metallic Sn could be generated by placing SnO2@ZIF-8 at 700 °C in the reducing
To better compare the difference of electrochemical performance between SnZCw and SnZCd, the exact contents of Sn and ZnO were examined by TGA and AAS. TGA was carried out in an air atmosphere. As shown in Fig. 4D, the lost weight of SnZCw before 131 °C, 10.3%, should be the result from the evaporation of H2O. Since the final weight was 31.6% in the range of 659~980 °C and
the boiling points of both Zn and Sn were above 907 °C, the final ash should be the mixture of ZnO and SnO2. AAS results showed that the content of ZnO in SnZCw was 21.0%. Then the content of
metallic Sn in SnZCw was calculated as 11.2%. Similarly, the content of ZnO and Sn in SnZCd was calculated as 1.8% and 55.1%, respectively.
The pore structures of SnZCw and SnZCd were investigated by N2 sorption isotherms. As
shown in Fig. 4E and Fig. 4F, both SnZCw and SnZCd presented typical type IV curves with H3 type hysteresis loop, which indicated the pore sizes in the two composites were distributed in a wide range. The BET surface area and total pore volume of SnZCw were 32.9 m2 g-1 and 0.0543 cm3 g-1, which were significantly less than those of SnZCd, 297 m2 g-1 and 0.4251 cm3 g-1, respectively. The porosity of the two Sn/C-ZnO composites made them profitable for electrolyte to wet the active materials and for lithium ion to transport. In addition, the porosity of composites could also buffer the volume change during the repeated discharge/charge process.
The encapsulation of ZIF-8 on nanoparticles might be ascribed to the following two interactions, one was the weak coordination interactions between the pyrrolidone rings in PVP and Zn atom in 8, the other was the hydrophobic interactions between PVP and the organic ligand in ZIF-8 [27]. Moreover, PVP was also one of the carbon sources during the pyrolysis process as well as the organic ligand in ZIF-8. For SnZCd, there was only one day for ZIF-8 to grow up, and the ZIF-8 layer covering on SnO2 was thin. During the pyrolysis, Sn reduced from SnO2 could flow and disperse in the
pore of the ZIF-8, which in turn would stop the collapse of the ZIF-8’s microporous structure and preserve the pore structures derived from both ZIF-8 and SnO2 in some degree. For SnZCw, when
provided for sufficient time for ZIF-8 to slowly grow up, zinc salt or MeIM might be adsorbed on the surface of ZIF-8 gradually, which resulted in more sheet-like structures depositing on the outskirts of SnZCw. Correspondingly, the ZIF-8 layer on SnO2 became thinker. The ZIF-8 layer was so thick that
Sn core formed under the stress during the pyrolysis process. Another influence was that the content of both ZnO and amorphous carbon derived from ZIF-8 in SnZCw was larger than that of SnZCd. As a result, the BET surface of SnZCw was smaller than that of SnZCd, but larger than that of SnO2 sphere.
3.2 Electrochemical performance of the Sn/Carbon-ZnO anode
The two composites of Sn core with different thickness of C-ZnO layer were tested as anodes for LIBs. Cyclic voltammetry is a convenient method to estimate the electrochemical reaction mechanisms of composites in the discharge/charge process. In the voltage window between 0.01 and 3.00 V, both SnO2 and ZnO have the conversion (redox) reaction and the alloy-dealloy reaction with
lithium. The reactions could be expressed as the following chemical reaction formula [33-35]: (1)
(3) (4) (5) (6)
After the SnO2 spheres were covered by ZIF-8 and turned to Sn/C-ZnO structures, the two
composites with different thickness of carbon-ZnO shell showed different cyclic voltammetric plots (Fig. 5A).
Figure 5. (A) Cyclic voltammetry plot of SnZCw and SnZCd; (B) Voltage profile of SnZCw; (C) Cycle performance and (D) Rate capability of SnZCw, SnZCd and SnO2; (E) Electrochemical
[image:9.596.92.501.206.680.2]
Both of them had a slight reduction peak at around 1.36 V, which should be ascribed to the irreversible decomposition of the electrolyte and formation of solid electrolyte interphase (SEI) film [24]. Due to the quantified content of ZnO in SnZCd was much lower than the content of Sn, SnZCd was considered as Sn core covered with a thinner amorphous carbon layer. At the first cycle, the cathodic peaks at 0.44 and 0.15 V and the anodic peaks at 0.51, 0.72, 0.79, and 0.86 V, corresponded to lithium alloying/dealloying with Sn, respectively (eqn 2) [36-39]. There was a tiny oxidation peak at 2.21 V, which might be the classic oxidation peak related to the reaction between Zn and Li2O (eqn 6)
[35] in spite of the lower content of ZnO.
While SnZCw was considered as Sn core covered by a thicker C–ZnO layer, in which the content of ZnO was twice as much as that of Sn. During the first cycle, the broad reduction peak from 0.77 to 0.05 V was ascribed to the overlap of peaks caused by C, ZnO and Sn. In general, the oxidation of LixSn to Sn took place below 0.9 V, and the oxidation of LixZn to Zn took place below 0.8 V as well
as around 1.4 V [35,40]. So, the three peaks distinguished at 0.64, 0.76, and 0.82 V on the oxidation wave, should be the result from the dealloying of LixSn and LixZn. There was a oxidation peak around
1.1 V, which shifted positively in the following cycles. It might relate to the partial oxidation of Sn to SnOx. The Li2O produced in eqn 4 might partial transfer to Sn at a lower voltage (eqn 3) before Zn at a
higher voltage (eqn 6). The oxidation peak at 2.05 V at the first cycle shifted positively during the following cycles, which was at 2.15 V at the second cycle and 2.27 V at the third cycle. The increasing polarization [25] suggested that the reaction of ZnO in SnZCw at the initial cycles was affected by the other components in the composite.
Galvanostatic discharge-charge tests of SnZCw were measured at the current of 100 mA g-1 in the potential ranged from 0.01 to 3.00 V. The galvanostatic discharge-charge curves (Fig. 5B) showed that the discharge capacity of SnZCw at the first cycle were 1118.7 mAh g-1 with coulombic efficiency (CE) of 64.2%. At the second cycle, the CE quickly recovered to 94.9%. After that, the CE was steady between 97.5 and 99.8%. It indicated that the larger irreversible loss of capacity at the initial cycle was mainly caused by the decomposition of electrolyte in the micropores of C/ZnO layer, and the physical structure of Sn core was protected by the outside C-ZnO layer. Two charge plateaus for SnZCw could be distinguished from the charge curves at 1.0~1.2 and 2.0~2.2 V, consisted with the oxidation reaction of metals implied in Fig. 5A.
Fig. 5C showed the cycle performance of the three materials, SnO2, SnZCd and SnZCw. After
ascribed to the thicker C-ZnO protect shell, and the content of Li2O released from the conversion
reaction between ZnO and Li. Study showed that Li2O might adhere the alloy materials, keep the
integrity of nanoparticles’ architecture, and reduce the whole volume change of the composite in the discharge-charge process [11].
Table 2. Fitting results of EIS data for the samples of SnZCw, SnZCd, and SnO2 accronding to
equivalent circuit of Rs(RSEI+ctCSEI+ct)Zw.
SnO2 SnZCd SnZCw
Rs(Ω) 3.182±0.375 18.49±0.96 18.40±0.41
RSEI+ct(Ω) 121.3±8.7 74.75±2.94 31.42±1.05
CSEI+ct(×10-6 F) 3.251±0.253 1.304±0.106 2.616±0.162
[image:11.596.49.473.197.341.2]ZW(×10-3 S) 1.366±0.073 10.26±0.61 1.943±0.029
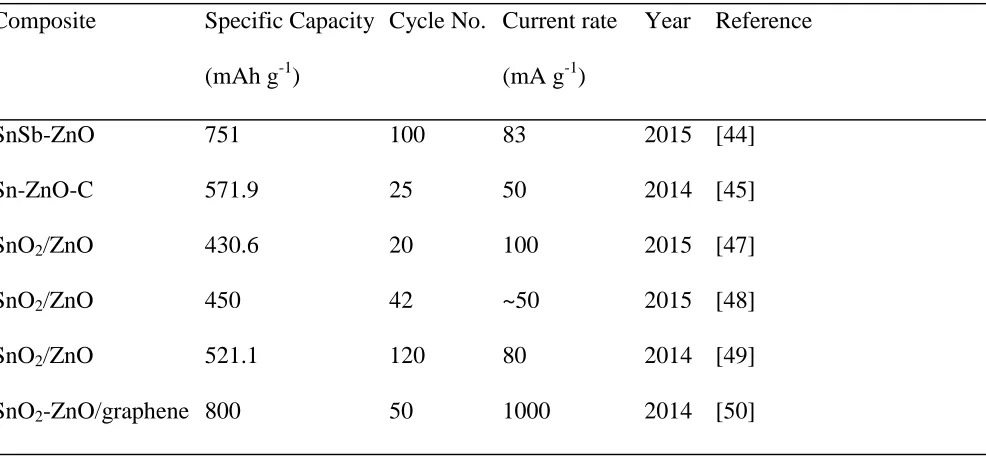
Table 3. The capacity of some composites containing Sn element and ZnO in recent years. Composite Specific Capacity Cycle No. Current rate Year Reference
(mAh g-1) (mA g-1)
SnSb-ZnO 751 100 83 2015 [44]
Sn-ZnO-C 571.9 25 50 2014 [45]
SnO2/ZnO 430.6 20 100 2015 [47]
SnO2/ZnO 450 42 ~50 2015 [48]
SnO2/ZnO 521.1 120 80 2014 [49]
SnO2-ZnO/graphene 800 50 1000 2014 [50]
Then the electrodes of SnZCd, SnZCw, and SnO2 after discharge-charge cycles were compared
by EIS measurement (Fig. 5E). The EIS curves could be well fitted by the equivalent circuit, Rs(RSEI+ctCSEI+ct)Zw [41], which meant that the curves could be simply decomposed as a semicircle and
a decline line. In the figure, the translation of EIS data from the origin coordinates was represented by the ohmic resistance of batteries (Rs), the semicircle was associated to the charge-transfer resistance
and the SEI film resistance (RSEI+ct), and the decline line related to the solid state diffusion of Li+ in the
[image:11.596.54.547.394.622.2]
similar Rs value, which indicating a similar Li+ and electron concentration in the electrolyte [42]. The
diameter (or the RSEI+ct value) of SnZCw was the first smallest and SnZCd was the second smallest,
indicating that the ability of the charge transfer and Li+ get through the SEI film of SnZCw was the first easiest, and those of SnZCd were the second easiest. Furthermore, the slope of the decline line (or the Zw value) of SnZCw was also smaller than that of SnZCd, the diffusion of Li+ in the composites
might be ascribed to the component contents in the composites. The contents of both C and ZnO in SnZCw were larger than those in SnZCd, which might be favour of the diffusion of Li+. Hence, the values of both RSEI+ct and Zw were in good agreement with the experiment result that the
electrochemical performance of SnZCw was larger than that of SnZCd.
Study showed that the specific capacities of ZnO/C composites directly pyrolyzing ZIF-8 under N2 atmosphere at 700, 800, and 900 °C were below 300 mAh g-1 after cycled for 50 times at 50 mA g-1
[43]. However, the specific capacities of both SnZCd and SnZCw were larger than those. Little research on composites containing both Sn element and ZnO as anodes for LIBs was report in recent years (Table 3). The specific capacity of SnZCw was less than that of SnSb-ZnO [44] and Sn-ZnO-C [45] in Table 3, which might be the result from the lower dispersion between Sn and ZnO in nanoscale. Study showed that Zn and Sn cannot form ternary compounds with Li [46]. If Li2O could be the bridge
connecting Sn to Zn and alleviate the stress from the two metals, the capacity of Sn/Zn composite could be improved. However, it still need further experiments to confirm.
4. CONCLUSIONS
Two composites of Sn core with C-ZnO shell of different thickness were successfully fabricated by reducing SnO2 with ZIF-8. The contents of ZnO and Sn in the two composites were
different. When they served as the anodes for LIBs, the O element in ZnO might be passed to Sn via the Li2O generated from the decomposition of ZnO during the discharge. The Sn core with a thicker
C-ZnO shell, SnZCw, had a more larger and steady discharge capacity in the discharge-charge cycles.
ACKNOWLEDGEMENT
This work was financially supported by National Natural Science Foundation of China (21465014 and 21465015), Science and Technology Support Program of Jiangxi Province (20123BBE50104 and 20133BBE50008), Natural Science Foundation of Jiangxi Province (20142BAB203010 and 20143ACB21016), The Ministry of Education by the Specialized Research Fund for the Doctoral Program of Higher Education (20133604110002) and the Ground Plan of Science and Technology Projects of Jiangxi Educational Committee (KJLD14023).
References
1. N.R.C. Stuart R. Batten, Xiao-Ming Chen, Javier Garcia-Martinez, Susumu Kitagawa, Lars
Öhrström, Michael O’Keeffe, Myunghyun Paik Suh and Jan Reedijk, Pure Appl. Chem., 85 (2013) 1715-1724.
2. S.-L. Li and Q. Xu, Energ. Environ. Sci., 6 (2013) 1656-1683.
4. Q. Qu, J. Yun, Z. Wan, H. Zheng, T. Gao, M. Shen, J. Shao and H. Zheng, RSC Adv., 4 (2014) 64692-64697.
5. L. Zhang, H.B. Wu and X.W. Lou, J. Am. Chem. Soc., 135 (2013) 10664-10672. 6. H. Yang, P.E. Kruger and S.G. Telfer, Inorg. Chem., 54 (2015) 9483-9490.
7. C.H. Kuo, Y. Tang, L.Y. Chou, B.T. Sneed, C.N. Brodsky, Z.P. Zhao and C.K. Tsung, J. Am. Chem. Soc., 134 (2012) 14345-14348.
8. Y. Song, L. Zuo, S. Chen, J. Wu, H. Hou and L. Wang, Electrochim. Acta, 173 (2015) 588-594. 9. G. Huang, F. Zhang, X. Du, Y. Qin, D. Yin and L. Wang, ACS Nano, 9 (2015) 1592-1599. 10.W. Niu, L. Li, X. Liu, N. Wang, J. Liu, W. Zhou, Z. Tang and S. Chen, J. Am. Chem. Soc., 137
(2015) 5555-5562.
11.N. Nitta, F. Wu, J.T. Lee and G. Yushin, Mater. Today, 18(2015) 252-264.
12.B. Zhu, Y. Jin, Y. Tan, L. Zong, Y. Hu, L. Chen, Y. Chen, Q. Zhang and J. Zhu, Nano Lett., 15 (2015) 5750-5754.
13.H. Kim, Y. Son, C. Park, M.-J. Lee, M. Hong, J. Kim, M. Lee, J. Cho and H.C. Choi, Nano Lett., 15 (2015) 4135-4142.
14.Y. Sun, S. Jin, G. Yang, J. Wang and C. Wang, ACS Nano, 9 (2015) 3479-3490. 15.C. Cui, X. Liu, N. Wu and Y. Sun, Mater. Lett., 143 (2015) 35-37.
16.H. Lee and J. Cho, Nano Lett., 7 (2007) 2638-2641.
17.X. Xia, X. Wang, H. Zhou, X. Niu, L. Xue, X. Zhang and Q. Wei, Electrochim. Acta, 121 (2014) 345-351.
18.D. Bresser, F. Mueller, D. Buchholz, E. Paillard and S. Passerini, Electrochim. Acta, 128 (2014) 163-171.
19.D. Wang, X. Li, J. Yang, J. Wang, D. Geng, R. Li, M. Cai, T.-K. Sham and X. Sun, Phys. Chem. Chem. Phys., 15 (2013) 3535-3542.
20.J.S. Zhu, D.L. Wang, L.B. Cao and T.F. Liu, J. Mater. Chem. A, 2 (2014) 12918-12923. 21.T. Song, M. Yan and M. Qian, J Porous Mat., 22 (2015) 713-719.
22.P. Nithyadharseni, M.V. Reddy, B. Nalini, M. Kalpana and B.V.R. Chowdari, Electrochim. Acta, 161 (2015) 261-268.
23.P. Gurunathan, P.M. Ette and K. Ramesha, ACS Appl. Mater. Inter., 6 (2014) 16556-16564. 24.S. Chen, J. Wu, R. Zhou, L. Zuo, P. Li, Y. Song and L. Wang, Electrochim. Acta, 180 (2015)
78-85.
25.S.-H. Yu, D.J. Lee, M. Park, S.G. Kwon, H.S. Lee, A. Jin, K.-S. Lee, J.E. Lee, M.H. Oh, K. Kang, Y.-E. Sung and T. Hyeon, J. Am. Chem. Soc., 137 (2015) 11954-11961.
26.D.-W. Kim, I.-S. Hwang, S.J. Kwon, H.-Y. Kang, K.-S. Park, Y.-J. Choi, K.-J. Choi and J.-G. Park, Nano Lett., 7 (2007) 3041-3045.
27.G. Lu, S.Z. Li, Z. Guo, O.K. Farha, B.G. Hauser, X.Y. Qi, Y. Wang, X. Wang, S.Y. Han, X.G. Liu, J.S. DuChene, H. Zhang, Q.C. Zhang, X.D. Chen, J. Ma, S.C.J. Loo, W.D. Wei, Y.H. Yang, J.T. Hupp and F.W. Huo, Nat. Chem., 4 (2012) 310-316.
28.S.J. Yang, S. Nam, T. Kim, J.H. Im, H. Jung, J.H. Kang, S. Wi, B. Park and C.R. Park, J. Am. Chem. Soc., 135 (2013) 7394-7397.
29.E. Dutu, F. Dumitrache, C.T. Fleaca, I. Morjan, L. Gavrila-Florescu, I.P. Morjan, I. Sandu, M. Scarisoreanu, C. Luculescu, A.M. Niculescu and E. Vasile, Appl. Surf. Sci., 336 (2015) 290-296. 30.H. Liu, R. Hu, M. Zeng, J. Liu and M. Zhu, J. Mater. Chem., 22 (2012) 8022-8028.
31.Z. Zhu, S. Wang, J. Du, Q. Jin, T. Zhang, F. Cheng and J. Chen, Nano Lett., 14 (2013) 153-157. 32.J. Hou, C. Cao, F. Idrees and X. Ma, ACS Nano, 9 (2015) 2556-2564.
33.C. Botas, D. Carriazo, G. Singh and T. Rojo, J. Mater. Chem. A, 3 (2015) 13402-13410. 34.M.V. Reddy, G.V. Subba Rao and B.V.R. Chowdari, Chem. Rev., 113 (2013), 5364-5457. 35.X.H. Huang, X.H. Xia, Y.F. Yuan and F. Zhou, Electrochim. Acta, 56 (2011) 4960-4965. 36.X. Huang, S. Cui, J. Chang, P.B. Hallac, C.R. Fell, Y. Luo, B. Metz, J. Jiang, P.T. Hurley and J.
37.X. Qian, T. Hang, G. Ran and M. Li, RSC Adv., 5 (2015) 31275-31281.
38.G. Wang, B. Wang, X. Wang, J. Park, S. Dou, H. Ahn and K. Kim, J. Mater. Chem., 19 (2009) 8378-8384.
39.J. Wu, C. Chen, Y. Hao and C. Wang, Colloid. Surface. A, 468 (2015) 17-21. 40.X.H. Huang, R.Q. Guo, J.B. Wu and P. Zhang, Mater. Lett., 122 (2014) 82-85.
41.X. Shen, D. Mu, S. Chen, B. Wu and F. Wu, ACS Appl. Mater. Inter., 5 (2013) 3118-3125. 42.J. Liang, X. Li, Z. Hou, W. Zhang, Y. Zhu and Y. Qian, ACS Nano, 10 (2016) 2295-2304. 43.Y. Han, P. Qi, S. Li, X. Feng, J. Zhou, H. Li, S. Su, X. Li and B. Wang, Chem. Commun., 50
(2014) 8057-8060.
44.Y. Li, W. Zhang, H. Cai, J. Wang, X. Ren and P. Zhang, RSC Adv., 5 (2015) 105643-105650. 45.L. Fan, J. Zhang, Y. Zhu and Y. Qian, Chinese Sci. Bull., 59 (2014) 2006-2011.
46.M.N. Obrovac and V.L. Chevrier, Chem. Rev., 114 (2014) 11444-11502.
47.Y. Zhao, X. Li, L. Dong, B. Yan, H. Shan, D. Li and X. Sun, Int. J. Hydrogen Energ., 40 (2015) 14338-14344.
48.Y. Huang, X. Liu, L. Lu, J. Fang, H. Ni and Z. Ji, Appl. Phys. A-Mater., 120 (2015) 519-524. 49.J. Zhu, G. Zhang, S. Gu and B. Lu, Electrochim. Acta, 150 (2014) 308-313.
50.Q. Guo, S. Chen and X. Qin, Mater. Lett., 128 (2014) 50-53.