R E S E A R C H A R T I C L E
Open Access
Identification of genomic aberrations in
hemangioblastoma by droplet digital PCR
and SNP microarray highlights novel
candidate genes and pathways for
pathogenesis
Ruty Mehrian-Shai
1*, Michal Yalon
1†, Itai Moshe
1, Iris Barshack
2,3, Dvorah Nass
3, Jasmine Jacob
1, Chen Dor
1,
Juergen K. V. Reichardt
4, Shlomi Constantini
2,5†and Amos Toren
1,2†Abstract
Background:The genetic mechanisms underlying hemangioblastoma development are still largely unknown. We used high-resolution single nucleotide polymorphism microarrays and droplet digital PCR analysis to detect copy number variations (CNVs) in total of 45 hemangioblastoma tumors.
Results:We identified 94 CNVs with a median of 18 CNVs per sample. The most frequently gained regions were on chromosomes 1 (p36.32) and 7 (p11.2). These regions contain theEGFRandPRDM16genes. Recurrent losses were located at chromosome 12 (q24.13), which includes the genePTPN11.
Conclusions:Our findings provide the first high-resolution genome-wide view of chromosomal changes in hemangioblastoma and identify 23 candidate genes:EGFR, PRDM16, PTPN11, HOXD11, HOXD13, FLT3, PTCH, FGFR1, FOXP1, GPC3, HOXC13, HOXC11, MKL1, CHEK2, IRF4, GPHN, IKZF1, RB1, HOXA9,and micro RNA, such as hsa-mir-196a-2 for hemangioblastoma pathogenesis. Furthermore, our data implicate that cell proliferation and angiogenesis promoting pathways may be involved in the molecular pathogenesis of hemangioblastoma.
Keywords:Hemangioblastoma, CGH, digital PCR, cancer
Background
Hemangioblastomas (HB) are highly vascular tumors, which account for approximately 3 % of all tumors of the central nervous system (CNS) [1]. It occurs in a subset of CNS locations, including the cerebellum (37 %), brainstem (10 %), and spinal cord (50 %) [1]. They are classed as grade one tumors under the World Health Organization's classification system. While most of these tumors are low grade and benign, some hemangioblastomas can present aggressive and occasionally malignant behavior. Heman-gioblastomas occur as sporadic tumors (75 %) or as a
manifestation of an autosomal dominantly inherited disorder, von Hippel-Lindau (VHL) disease (25 %) [2].
VHL hemangioblastomas are most commonly caused by germline exon deletions or truncating mutations [3] of the Von Hippel-Lindau (VHL) tumor-suppressor gene. The VHL protein, which is the critical part of a ubiquitin ligase protein complex that binds to the hypoxia-inducing factors HIF-1 and HIF-2 transcription factors and targets them for ubiquitination and proteosomal degradation. Dysregulation of this VHL-associated function causes in-creased expression of a variety of growth factors, including erythropoietin, PDGF, VEGF and TGF. Upregulation of these factors may lead to angiogenesis and tumorigenesis. Additional mechanisms of tumorigenesis have been de-scribed outside of the HIF pathway, including alterations in microtubule binding and stabilization, abnormal
* Correspondence:[email protected] †Equal contributors
1Pediatric Hemato-Oncology, Edmond and Lilly Safra Children’s Hospital and Cancer Research Center, Sheba Medical Center, Tel Hashomer affiliated to the Sackler School of Medicine, Tel-Aviv University, Tel Aviv, Israel Full list of author information is available at the end of the article
extracellular matrix composition as well as apoptosis and transcription regulation [4]. For most VHL disease related hemangioblastomas, the inactivation or loss of both alleles of the VHL gene is required. In addition to the phenotypic variability associated with allelic heterogeneity, genetic modifiers may influence the phenotypic expression of VHL disease. Allelic variants in theCCND1, MMP1 and
MMP3genes have been reported to influence hemangio-blastoma development [5]. This reiterates the need for elucidating other genetic alterations specific for heman-gioblastoma beside the hits of VHL gene. Moreover, in a subset of tumors including mostly sporadic hemangioblas-tomas, the genetic pathways involved in tumorigenesis have not been defined yet [6].
Copy number variants (CNVs) are alterations of DNA sections in result of genomic deletions (fewer than the normal number) or duplications (more than the normal number) on certain chromosomes and are common to many human cancers. Comparative genomic hybridization (CGH) by single nucleotide polymorphism (SNP) arrays is a cutting edge tech-nology that allows characterization of CNVs. SNP array karyotyping provides genome-wide assessment of copy number and loss of heterozygosity (LOH) in one assay. SNP array platforms, such as Affymetrix SNP 6.0 (Affymetrix, Santa Clara, CA, USA), often identify amplifications/deletions at a single gene level, which could not have been accomplished by previous methods. Thus, modern SNP arrays offer a powerful method for the discovery of oncogene and tumor suppressor gene involvement in tumors, as well as for improved cancer classification [7].
In contrast to surveillance of genome wide alterations by CGH arrays it is possible to directly quantify the abso-lute copy number of specific DNA loci by Droplet Digital PCR (ddPCR). In ddPCR, target sequences are amplified by PCR and the reaction products are partitioned into droplets and amplified to endpoint with TaqMan probes as in qPCR, then their concentrations are determined based on the number of fluorescently positive and nega-tive droplets in a sample well. The absolute number of target and reference DNA molecules is calculated and provides the target copy number variation (CNV) [8].
In the present study we used high-resolution SNP arrays for the first time to genome wide analysis of aberrations in hemangioblastomas aiming at the identification of novel pathogenetic mechanisms and possible targets for rational therapy. We validated the main reoccurring genetic changes by ddPCR highly precise quantification.
Methods Study population
A total of 44 hemangioblastoma samples were used for the present study. Thirteen frozen samples obtained
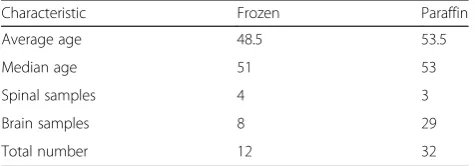
from The Sourasky Medical Center, Tel Aviv, Israel were used for the CGH analysis. Additional 32 formalin fixed paraffin embedded (FFPE) samples from Sheba Medical Center, Tel Hashomer, Israel were used as validation group. The study was approved by the ethical review boards of both Sheba and Tel Aviv Sourasky Medical Centers and was consistent with the declaration of Helsinki including informed consents. Clinical parame-ters, such as sex, age at diagnosis, and pathologic classi-fication were collected from patient records. Clinical information of the patient’s cohort is outlined in Table 1.
CGH analysis
[image:2.595.304.542.648.731.2]DNA was purified from frozen tissues using DNeasy (Qiagen Inc., Valencia, CA). One sample of pooled nor-mal genomic DNA, provided by Affymetrix, was used as experimental positive control. 250 ng of genomic DNA was digested with NspI (New England Biolabs, Inc) and then ligated to Nsp adaptors. The adaptor-ligated DNA fragments were amplified, fragmented using DNase I, end labelled with a biotinylated nucleotide, and hybrid-ized to a human cytoscan HD array (Affymetrix) at 50 ° C for 17 h. After hybridization, the arrays were washed, stained, and finally scanned with a GeneChip scanner 3000 (Affymetrix). All procedures were performed ac-cording to the manufacturer’s protocols. Array experi-ments were performed using the high-resolution Affymetrix CytoScan HD microarray (Affymetrix, Inc, Santa Clara, CA) containing 2,696,550 markers of which 1,953,246 are non-polymorphic markers and 750,000 SNPs with over 99 % accuracy to detect accurate break-point estimation as well as loss of heterozygosity (LOH) de-termination. This chip covers 340 International Standards for Cytogenomic Arrays (ISCA) constitutional genes, 526 cancer genes (99.6 %) and 36,121 RefSeq genes. The chip uses marker intervals of 25 markers / 100 kb. Analysis of CEL files from the Affymetrix CytoScan HD Array or Cytogenetics Whole-Genome 2.7 M Array was done with the Chromosome Analysis Suite (ChAS) software for cytogenetic analysis. Signal processing was done by Signal Covariate Adjustment, Fragment Correction, Dual Quantile Normalization and PLIER signal summarization. Dual Quantile Normalization was done to equalize each array’s intensity distribution copy number and SNP probes separately. For SNP
Table 1Cohort characteristics
Characteristic Frozen Paraffin
Average age 48.5 53.5
Median age 51 53
Spinal samples 4 3
Brain samples 8 29
markers, multiple probes for each allele were summa-rized to single values. Copy number (CN) was calcu-lated by hidden Markov model copy number segments after log2 calculation, high pass filter image correc-tion, log2 ratio covariate adjustment and systematic residual variables removal. The baseline for CN = 2 (normal autosomal copy number state) was established and used by the analysis software by Affymetrix com-pany using a set of 380 phenotypically normal individ-uals named as reference. The reference sample includes 186 females and 194 male. For chromosome X, only females were used and for chromosome Y only males were used. Log2 ratios for each marker are calculated relative to the reference signal profile. Re-sults of the summarized Data (CYCHP files) were viewed as chromosomal aberrations in table and graphical formats. We also added visual inspection of probe performance for altered segments. Reference in-tensity intended to represent the copy normal state (typically 2). Log ratios above 0 mean CN gain, log ra-tios below 0 mean CN loss and log rara-tios around 0 represent no change. Abnormal DNA copy numbers are identified automatically using 25 markers for loss/ 50 markers for gains.
VHL sequencing
To screen theVHLgene for mutations in our cohort, we performed direct sequencing of the coding region. Exons 1, 2 and 3 of theVHLgene and their immediately flank-ing sequences were amplified by PCR as described previ-ously [9]. The PCR amplification products were purified by using the QIAquick PCR Purification Kit (Qiagen), according to the manufacturer’s instructions. The ampli-fication primers were used as primers in the sequencing reactions, except for exon 1, for which we designed a new cycle sequencing primer (5′CGAAGATACGGAGG TCGA3′). Cycle sequencing was performed using the ABI PRISM Big Dye Terminator Cycle Sequencing Ready reaction kit (Applied Biosystems, Foster City, CA, USA), followed by isopropanol precipitation. The frag-ments were sequenced by automated sequencing analysis on an ABI Prism 377 sequencer (Applied Biosystems).
Droplet digital PCR
Copy Number validation was done on all samples, fro-zen and paraffin embedded, hemangioblastoma biop-sies. Genomic DNA was purified using QIAamp DNA mini (Qiagen). Copy number variation (CNV) test was performed by droplet digital PCR (ddPCR) as previ-ously described [10]. In short, 16 ng of genomic DNA samples were added to 2xddPCR supermix (Bio-Rad) with final concentration of 500nM of each primer and 250nM probe in duplex of the tested gene and RNaseP. RNaseP served as a CNV = 2 reference gene. Probes for
the tested genes contained a FAM reporter and RNaseP contained HEX. The genomic DNA and PCR reaction mixtures were partitioned into an emulsion of approxi-mately 20,000 droplets using the QX100 droplet gener-ator (Bio-Rad, USA). The droplets were transferred to a 96-well PCR plate, heat sealed, and placed in a conven-tional thermal cycler. Thermal cycling conditions were: 95oC for 10 min followed by 40 cycles of 94oC for 30 s, 60oC for 60 s and one cycle of 98oC for 10 min and finally 4oC hold. Following PCR, the plates were loaded into QX100 droplet reader (Bio-Rad) and the CNV value was calculated using Quantasoft software (Bio-Rad, USA). Primers and probes for selected areas enlisted in Table 2 were designed using Primer Express software (PE Corp, USA) and specificity was verified using NCBI BLAST on-line tool (National Library of Medicine, USA). RNaseP primers and probes were obtained from Bio-Rad.
Results
SNP array profiling identifies recurrent CNVs
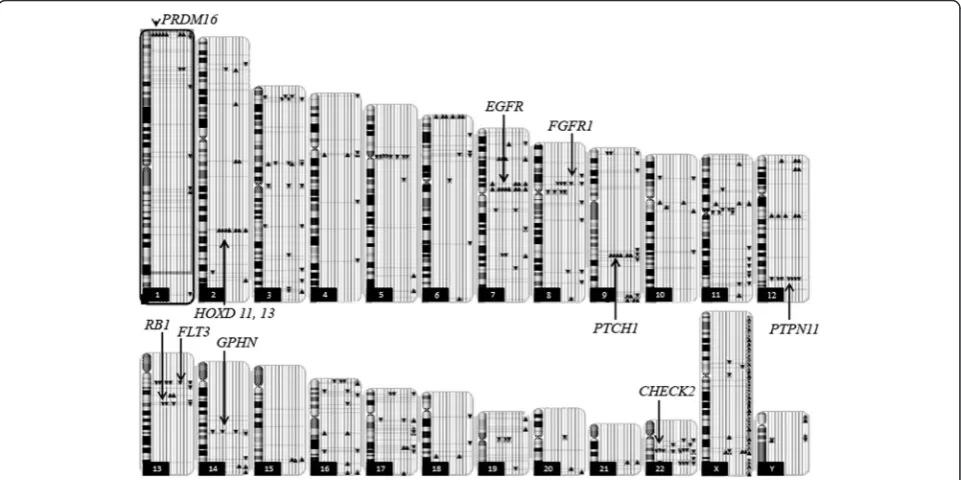
The systematic genome-wide gain and loss segments based CNVs data detected by SNP profiling in hema-gioblastoma is detailed in the karyoview (Fig. 1). We identified 94 CNVs with a median of 18 CNVs per sample. Twenty-three of them involved noncoding regions in centromeres that are known to harbor spurious CNVs, most of them were less than 100 Kb long, and 56 were found in at least two samples. The most frequently gained regions were on chromosomes 1 (p36.32) and 7 (p11.2). These regions contain the
PRDM16 and EGFR genes, respectively. Recurrent losses were located at chromosome 12 (q24.13) which includes the PTPN11 gene. Pathway analysis revealed that EGFR, Notch and HedgeHog signaling were the most frequently altered pathways promoting angiogen-esis and proliferation. Mir 551a (part of PRDM16) gain was detected in seven samples, miR-196a-2 gain was observed in five samples and miR-196b gain was detected in four samples. The list of recurrent CNVs found in at least five specimens (Fisher exact testp-value < 0.05), including type of alteration, involved chromosome, cytobands, and overlapping genes/miRNAs according to the RefSeq database is provided in Table 3. Two samples had LOH affecting theCHECK2region (Fig. 2).
VHL status
3p25.3 for these samples. Sequencing based mutational analysis of VHL did not reveal any additional muta-tions. Samples 7 and 10 incurred CNVs similarly to the other samples. The average number of CMVs in the other samples was seven. Sample 7 had 14 of the com-mon CNVs thus had more than the average CNVs but sample 10 had less CNVs (six) which is similar to the average.
CNV validation by digital droplet PCR
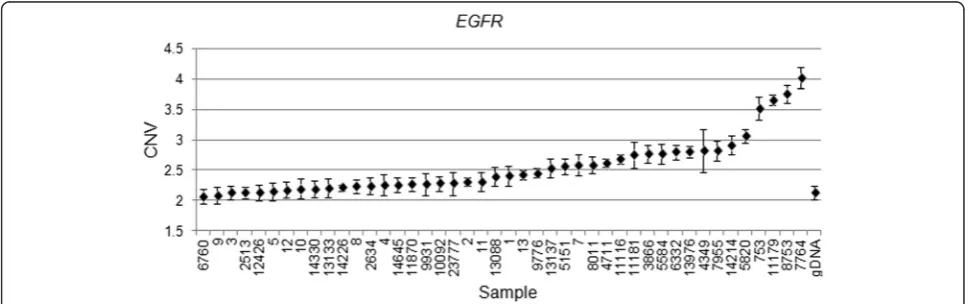
[image:4.595.55.540.100.324.2]We validated our findings in a subset of four genes (EGFR, CHECK2, PTCH1and PTPN11) in the discovery cohort used for the array CGH and in an additional independent set of 32 FFPE specimens, using copy vari-ation detection by digital droplet PCR (ddPCR) analysis. Samples were partitioned into thousands of nanoliter-sized droplets; single template molecules were amplified Table 2Digital PCR primers and probes for selected areas
Gene Oligonucleotides Sequence (5′-3′) reporter
PTPN11 Forward primer TTAGAGACAGGGTCCCACTCTTG
-Reverse primer GCTTGAGGATGCAGTAAGCTATGA
-Probe CCTGGCTGGAGTGCAGTGGCGT FAM
CHECK2 Forward primer CATTTTTCTCTTAGTATCTTTCTGGGAAT
-Reverse primer CATTTCTGAGCCCAGCAATACA
-Probe TCACAATCCAGGGCTACAGTAAGACCCATG FAM
PTCH1 Forward primer GCGTGCGAAGGTGGAGACT
-Reverse primer TCATTGGCCTCCCACTTGA
-Probe TGTCTTCTCCCCCATGTCGG FAM
EGFR Forward primer AGGAGGAACAACGTGGAGACA
-Reverse primer GAGACACCGGAGCCACAGA
-Probe CCCAGAGGTGGAACGTTGGCCC FAM
RNaseP Forward primer GATTTGGACCTGCGAGCG
-Reverse primer GCGGCTGTCTCCACAAGT
-Probe CTGACCTGAAGGCTCT Hex
[image:4.595.58.539.454.694.2]on a thermocycler, and counted for fluorescent signal. Absolute copy numbers of target and reference se-quences were determined by Poisson algorithms [8]. The RNase P (Ribonuclease P) amplicon maps within the sin-gle exonRPPH1gene on 14q11.2 was used as the stand-ard reference assay for copy number analysis [11]. Validation results were as follows: EGFR amplification was detected in 29 of 32 patient samples (Fig. 4),PTCH1was amplified in 18 of 32 patients (Fig. 5) and CHEK2 was
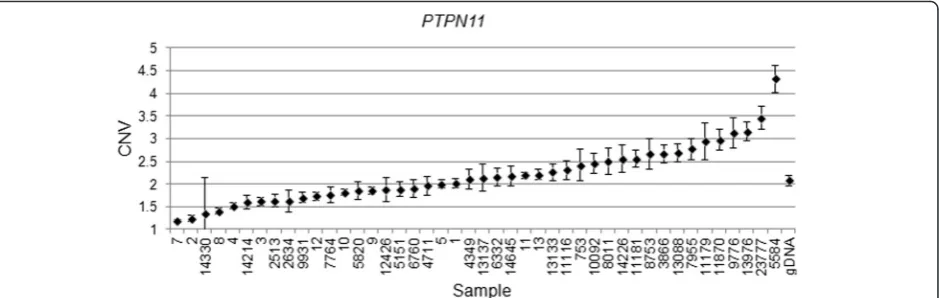
deleted in 27 of 32 (Fig. 6). Surprisingly,PTPN11was deleted in 7/32 whilst it was amplified in 17/32 specimens (Fig. 7).
[image:5.595.56.541.98.289.2]It is important to note that in result of normal cell admix-ture within tumor samples a high CNV means either high fraction of tumor cells with relatively high copy number in each cell or low fraction of tumor cells with very high copy number in each cell. Likewise, low CNV means either high fraction of tumor cells with relatively low copy number in each cell or low fraction of tumor cells with relatively very Table 3Frequent chromosome losses and gains involving single genes
Number of samples Type Chromo some Band Gene miRNA GV
7 Gain 7 p11.2 EGFR
-7 Gain 1 p36.32 PRDM16 hsa-mir-551ahsa-mir-551a v
7 Loss 12 q24.13 PTPN11
-7 Gain 2 q31.1 HOXD11, HOXD13 HOHOHOXD13
HOXD11HOXD13 v
6 Loss 13 q12.2 FLT3
-6 Gain 9 q22.32 PTCH v
5 Loss 8 p11.22 FGFR1
-5 Loss 3 p13 FOXP1
-5 Gain X q26.2 GPC3
-5 Gain 12 q13.13 HOXC13, HOXC11 hsa-mir-196a-2 v
5 Loss 22 q13.1 MKL1 v
5 Loss 22 q12.1 CHEK2 v
The column“Number of samples”represents the number of patients with a particular genomic abnormality. For each variation the type of variation (gain or loss), location on chromosome and band, the gene located in this locus and miRNAs located in this locus are enlisted. Variants reported in the Database of Genomic Variants (DGV) database in genes are denoted as“v”and if none reported as“-”under the column DGV
[image:5.595.61.538.451.683.2]low copy number in each cell. In short if the fraction of tumor cells is low then the relative copy number (both high and low CNV) is even higher than what is reported. In our cohort, histopathologic assessment by a pathologist deter-mined that 47 percent of samples had more than 95 % tumor, 7 percent had more than 90 % tumor, 29 percent of samples had more than 70–80 % tumor, 14 percent of sam-ples had between 50–70 % tumor and 3 percent had between 40–50 % tumor.
Discussion
We report here for the first time a genome-wide, high-resolution systematic analysis of chromosomal changes in hemangioblastoma. Using the SNP array 6 (Affymetrix) we analyzed 1.8 million genetic markers genome wide to identify amplifications/deletions up to single gene level.
We identified a total of 94 CNVs, 23 of them involved noncoding regions. 56 (31 gains and 25 losses) were found in at least two specimens. The most frequently gained regions were on chromosomes 1 (p36.32) and 7 (p11.2). The most frequently deleted region was on chromosome 12 (q24.13).
Our findings provide the first high-resolution genome-wide view of chromosomal changes in hemangioblastoma and identify 23 common, ie found in 4 or more patients, candidate genes for hemangioblastoma pathogenesis (Table 3): EGFR, PRDM16, PTPN11, HOXD11, HOXD13, FLT3, PTCH, FGFR1, FOXP1, GPC3, HOXC13, HOXC11, MKL1, CHEK2, IRF4, GPHN, IKZF1, RB1, HOXA9, HOXA11 and several microRNA, including hsa-mir-196a-2. We note that some of these microalterations have been reported very rarely previously in tissue samples from Fig. 3VHL locus (Ch.3 p25.3) deletion data display. The smooth signal derived from the raw data is displayed. The smooth signal value is
calculated using the intensity values of the flanking probes and the data is displayed by a continuous line which is filled down to the x axis. Focusing on VHL locus was done by selecting the specific region of the chromosome and zooming in such that this region spans the entire x-axis. The data points containing the probe values are overlaid on the graph. Smooth signal value can be between zero or four depending on the Log(2) ratio raw values of the surrounding probes.aSample 7 and (b) Sample ten smooth signal is one exhibiting deletion inVHLlocus (labeled with dashed line). Probes around the area are normal (around 2)
[image:6.595.55.541.88.239.2] [image:6.595.56.541.532.684.2]healthy subjects (according to Database of Genome Variants (DGV), which are reported in Table 3. However, in our tumor samples these alterations are significantly more common (p < 0.00001).
Functional annotation analysis by David [12] reviled that two pathways are prominently affected in the hemangio-blastoma samples: the cell proliferation and angiogenesis promoting pathways. The cell proliferation pathway in-cludes the following genes: CHEK2, EGFR, FGFR, FLT3
andPTCH1. The angiogenesis pathway includes the genes
EGFR and FGFR, which are significant because they are also involved in blood vessel formation. Importantly, three of these genes were verified by ddPCR:EGFR, CHEK2and
PTCH1. Furthermore,PTPN11was selected for verification as it was lost strikingly often (Table 3).
Epidermal growth factor receptor (EGFR) is a tyrosine kinase receptor that has been documented with increased expression in a variety of human cancers such as breast
cancer, [13], early stage non-small-cell lung cancers and gliomas [14, 15]. Our findings are in line with three prior immunohistochemical studies that foundEGFR overexpres-sion in hemangioblastomas [16] [17] [18]. Fibroblast growth factor receptor 1 (FGFR1) micro deletions have been reported in myeloid and lymphoid neoplasms [19]. Interest-ingly we discovered that the FGFR1 deletion involves the FGFR1 2nd intron (chromosome 8, 38291333–38314367), which according to UCSC genome browser hg19 includes a regulatory site. Checkpoint kinase 2 (CHEK2) has been implicated in DNA repair, cell cycle arrest, and apoptosis in response to DNA double-strand breaks [20]. Mutations in
CHEK2have been reported to be possibly associated with breast cancer and liposarcoma development [21, 22]. The protein patched homolog 1 (PTCH1) is a sonic hedgehog receptor. Loss of function mutations inPTCH1are associ-ated with development of various types of cancers, includ-ing medulloblastoma [23, 24], pancreatic cancer [25] and Fig. 5PTCH1Copy number variation (CNV) values for clinical samples and one normal genomic DNA sample. Genomic DNA copy number alterations were assessed via ddPCR. The CNV is shown as the number of copies and the Poisson distribution at 95 % confidence interval. The copy number value of normal diploid sequence has a score of two. Copy number above two means amplification in that region and copy number below two means deletion in that region
[image:7.595.65.539.88.239.2] [image:7.595.61.539.533.683.2]colorectal cancer [26]. In contrast to these observations, we find consistent PTCH1 gains in our cohort of hemangio-blastoma patients (Table 3). In support of our findings there are reports of PTCH1 also acting as an oncogene in a mouse model of skin basal cell carcinomas [27].
FMS-like tyrosine kinase 3 (FLT3) plays a role in hematopoiesis including early hematologic differentiation and early B and T-cell development [28] and dendritic cells differentiation [29]. Activating FLT3 mutations are some of the most common molecular abnormalities in acute myeloid leukemia (AML) [30]. Interestingly, in our data, we find losses ofFLT3(Table 3). Consistent with our findings, others have reported deletions inFLT3in AML as well [31] [32]. Among the altered genes mapped in many of the recurrently gained regions we recognized several HOX genes (Table 3) and microRNAs (miRNAs) residing in the same region. HOX genes encode master transcription factors important in development and have been reported to be commonly altered in human solid tu-mors [33]. On the other hand, miRNAs are small regula-tory RNAs that have recently been implicated in a variety of cancers [34]. miR-196a-2 and miR-196b gain were the most common miRNA CNV in our patients. Interestingly, miR-196a-2 differs from miR-196b by one nucleotide [35]. The miR-196 gene family is located in the regions of homeobox (HOX) transcription factors that are essential for embryogenesis. Up-regulation of miR-196a has been found in breast cancer, adenocarcinoma, leukemia and esophageal adenocarcinoma [35]. Accordingly the relevant causative change may actually be altered miRNA expres-sion rather thanHOXgene expression. Other studies have reported a 12-fold increase in miR-9 and a 15-fold de-crease of miR-200a in hemangioblastomas distinguishing hemangioblastomas from metastatic clear cell renal cell carcinomas in the CNS [36]. Prdm16 is preferentially expressed by stem cells throughout the nervous and
haematopoietic systems and promotes stem cell mainten-ance [37]. Megakaryoblastic leukemia protein-1 (MKL1), is a transcription factor that regulates many processes, including remodeling of neuronal networks and epithelial-mesenchymal transition [38]. Moreover, deregulation by genetic alterations and/or alteredMKL1transcription has been shown to have role in myeloproliferative neoplasms [39]. Finally and most interestingly, protein tyrosine phos-phatase, non-receptor type 11(PTPN11) gene encodes the tyrosine phosphatase SHP2 protein required for RTK signaling and has a role in survival, proliferation and differentiation [40]. The fact that we find the PTPN11
gene is deleted in some hemangioblastoma patients and is amplified in others may suggest that these tumors actually originate from different cellular lineages. In fact, we found that spinal tumors were overwhelmingly deleted in the
PTPN11region: 5 of 7 spinal tumors were deleted whilst 1 was amplified and 1 was chromosomally normal at this locus. In contrast, cerebellar hemangioblastomas were generally amplified: 16 out 37 were indeed amplified. However, 10 cerebellar tumors were deleted and 11 of 37 were normal in this genomic region. Interestingly, differ-ential overexpression or deletion of PTPN11 has been shown in other tumors. For example, mutations in
PTPN11has been reported to be associated with develop-ment of Juvenile Myelomonocytic Leukemia (JMML) [41], acute myeloblastic leukemia (AML) [42], and acute lymphoblastic leukemia (ALL) [43]. Overexpression in gastric carcinomas has been reported [44]. In contrast,
[image:8.595.69.539.88.237.2]act in a cell-specific manner: as a tumor suppressor on one hand in the progenitor cells of spinal hemangioblasto-mas, whilst it acts as an oncogene in the cells of origin of cerebellar hemangioblastoma tumors.
Previous analysis of six VHL-related CNS hemangio-blastomas showed loss of chromosome 3p or the whole of chromosome 3 to be the most common abnormality, which is detected in 70 % and loss of 1p11-p31 in 10 % [47]. More relevant to our findings, published CGH studies on 10 sporadic cerebellar hemangioblastomas detected losses of chromosomes 3 (70 %), 6 (50 %), 9 (30 %), and 18q (30 %) and a gain of chromosome 19 (30 %) [48]. We indeed detected losses and gains in these areas but they were not frequent (15-20 %). Chromosome 3 losses were more abundant, mostly on p13 (5 samples FOXP1) and p25 (3 samples showed
PPARG loss and 2 samples showed VHLloss). Interest-ingly, FOXP1 transcription factor, located on chromo-some 3(p13), can function as a tumor suppressor gene. Low expression in glioma [49] and Hodgkin lymphoma has been shown [50]. Differences in methodology, sam-ple size and definition of aberration inclusion criteria may account for some of the apparent inconsistencies between previous studies and our findings. For example, previous results were obtained from VHL-related hemangioblastomas using techniques that identify dele-tions that are larger than 2 Mb. In the current study we used modern CGH microarrays which scan the DNA every 1 kb and thus we were able to identify very subtle genomic changes. One of the most striking observations in our study is that many CNVs affected single genes (Table 3) and revealed candidate genes, which have not been implicated in hemangioblastomas. This represents an important outcome of this study compared with pre-vious investigations using CGH. Some of the new genes identified here as affected by CNVs in hemangioblas-toma may serve as targets for future precisely targeted anti- cancer therapy. For example, antiangiogenic ther-apy can be given to patients with lesions that are not resectable.
Conclusions
In this study, we have demonstrated in two different tumor cohorts and using two different techniques for copy number alteration detection, SNP and digital PCR, that
Chek2 is deleted and EGFR, PTPN11, Ptch1 amplified in majority of hemangioblastoma patients. EGFR is the only gene that has been previously reported as a candidate gene with hemangioblastoma. Independent of HB tumor loca-tion PTPN11 may act as tumor suppressor or oncogene depending on the tumor cell of origin. These findings have potentially relevant clinical value, as this the first high resolution for chromosomal alteration in HB. Future re-search should be dedicated to the prospective validation
of these alterations and further characterization of tumors that carry the deletions/amplifications, as well as of defin-ing the role of these genes. This may offer insights into hemangioblastoma biology, provide DNA-based markers that can be analyzed by FISH suitable for routine clinical applications and eventually lead to the development of effective targeted therapies for HB.
Abbreviations
CNVs:Copy number variations; HB: Hemangioblastomas; CNS: Central nervous system; VHL: von Hippel-Lindau; CGH: Comparative genomic hybridization; SNP: Single nucleotide polymorphism; LOH: Loss of heterozygosity; ddPCR: Droplet Digital PCR; CNV: Copy number variation; FFPE: Formalin Fixed Paraffin Embedded; RNase P: Ribonuclease P;
EGFR: Epidermal growth factor receptor;FGFR: Fibroblast growth factor receptor 1;CHEK2: Checkpoint kinase 2;PTCH1: Protein patched homolog 1;
FLT3: FMS-like tyrosine kinase 3; AML: Acute myeloid leukemia; miRNA: microRNA;MKL1: Megakaryoblastic leukemia protein-1; PTPN11: protein tyrosine phosphatase non-receptor type 11.
Competing interests
The authors declare that they have no competing interest.
Authors’contributions
RMS conceived, designed and coordinated the study, performed the CGH analysis and drafted the manuscript, IM carried out the droplet digital PCR experiments, IB and DN participated in collecting the FFPE samples, JJ and CD carried out the CGH experiments, JR provided advice and revised the manuscript, MY, SC and AT participated in collecting the frozen samples, designing and coordinating of the study. All authors read and approved the final manuscript.
Acknowledgments
This research was funded by The Sheba Medical Research fund. We thank Sarah South, PhD, University of Utah, for insightful remarks on Affymetrix CGH analysis.
Author details
1Pediatric Hemato-Oncology, Edmond and Lilly Safra Children’s Hospital and Cancer Research Center, Sheba Medical Center, Tel Hashomer affiliated to the Sackler School of Medicine, Tel-Aviv University, Tel Aviv, Israel.2Sackler Faculty of Medicine, Tel Aviv University, Tel Aviv, Israel.3Institute of Pathology, Sheba Medical Center, Tel Hashomer, Israel.4Division of Tropical Health and Medicine, James Cook University, Townsville, QLD, Australia. 5Department of Pediatric Neurosurgery, Dana Children’s Hospital, Tel-Aviv-Sourasky Medical Center, Tel-Aviv, Israel.
Received: 19 June 2015 Accepted: 6 January 2016
References
1. Lonser RR, Glenn GM, Walther M, Chew EY, Libutti SK, Linehan WM, et al. von Hippel-Lindau disease. Lancet. 2003;361(9374):2059–67. doi:10.1016/S0140-6736(03)13643-4.
2. Maher ER, Iselius L, Yates JR, Littler M, Benjamin C, Harris R, et al. Von Hippel-Lindau disease: a genetic study. J Med Genet. 1991;28(7):443–7. 3. McNeill A, Rattenberry E, Barber R, Killick P, MacDonald F, Maher ER.
Genotype-phenotype correlations in VHL exon deletions. Am J Med Genet A. 2009;149A(10):2147–51.
4. Kaelin Jr WG. The von Hippel-Lindau tumour suppressor protein: O2 sensing and cancer. Nat Rev Cancer. 2008;8(11):865–73.
5. Ricketts C, Zeegers MP, Lubinski J, Maher ER. Analysis of germline variants in CDH1, IGFBP3, MMP1, MMP3, STK15 and VEGF in familial and sporadic renal cell carcinoma. PLoS ONE. 2009;4(6):e6037. doi:10.1371/journal.pone. 0006037.
7. Dutt A, Beroukhim R. Single nucleotide polymorphism array analysis of cancer. Curr Opin Oncol. 2007;19(1):43–9. doi:10.1097/CCO.
0b013e328011a8c1.
8. Hindson BJ, Ness KD, Masquelier DA, Belgrader P, Heredia NJ, Makarewicz AJ, et al. High-throughput droplet digital PCR system for absolute quantitation of DNA copy number. Anal Chem. 2011;83(22):8604–10. doi:10.1021/ac202028g.
9. Hoebeeck J, van der Luijt R, Poppe B, De Smet E, Yigit N, Claes K et al. Rapid detection of VHL exon deletions using real-time quantitative PCR. Laboratory investigation; a journal of technical methods and pathology. 2005;85(1):24–33. doi:10.1038/labinvest.3700209.
10. Roberts CH, Jiang W, Jayaraman J, Trowsdale J, Holland MJ, Traherne JA. Killer-cell Immunoglobulin-like Receptor gene linkage and copy number variation analysis by droplet digital PCR. Genome Med. 2014;6(3):20. doi:10.1186/gm537.
11. Fernandez-Jimenez N, Castellanos-Rubio A, Plaza-Izurieta L, Gutierrez G, Irastorza I, Castano L, et al. Accuracy in copy number calling by qPCR and PRT: a matter of DNA. PLoS ONE. 2011;6(12):e28910. doi:10.1371/journal. pone.0028910.
12. da Huang W, Sherman BT, Lempicki RA. Bioinformatics enrichment tools: paths toward the comprehensive functional analysis of large gene lists. Nucleic Acids Res. 2009;37(1):1–13. doi:10.1093/nar/gkn923.
13. Shien T, Tashiro T, Omatsu M, Masuda T, Furuta K, Sato N, et al. Frequent overexpression of epidermal growth factor receptor (EGFR) in mammary high grade ductal carcinomas with myoepithelial differentiation. J Clin Pathol. 2005;58(12):1299–304. doi:10.1136/jcp.2005.026096.
14. Veale D, Kerr N, Gibson GJ, Kelly PJ, Harris AL. The relationship of quantitative epidermal growth factor receptor expression in non-small cell lung cancer to long term survival. Br J Cancer. 1993;68(1):162–5. 15. Rich JN, Hans C, Jones B, Iversen ES, McLendon RE, Rasheed BK, et al. Gene
expression profiling and genetic markers in glioblastoma survival. Cancer Res. 2005;65(10):4051–8. doi:10.1158/0008-5472.CAN-04-3936.
16. Chen GJ, Karajannis MA, Newcomb EW, Zagzag D. Overexpression and activation of epidermal growth factor receptor in hemangioblastomas. J Neurooncol. 2010;99(2):195–200. doi:10.1007/s11060-010-0125-9. 17. Bohling T, Hatva E, Kujala M, Claesson-Welsh L, Alitalo K, Haltia M.
Expression of growth factors and growth factor receptors in capillary hemangioblastoma. J Neuropathol Exp Neurol. 1996;55(5):522–7. 18. Reifenberger G, Reifenberger J, Bilzer T, Wechsler W, Collins VP.
Coexpression of transforming growth factor-alpha and epidermal growth factor receptor in capillary hemangioblastomas of the central nervous system. Am J Pathol. 1995;147(2):245–50.
19. Yang JJ, Park TS, Choi JR, Park SJ, Cho SY, Jun KR, et al. Submicroscopic deletion of FGFR1 gene is recurrently detected in myeloid and lymphoid neoplasms associated with ZMYM2-FGFR1 rearrangements: a case study. Acta Haematol. 2012;127(2):119–23. doi:10.1159/000334707.
20. Jackson SP, Bartek J. The DNA-damage response in human biology and disease. Nature. 2009;461(7267):1071–8. doi:10.1038/nature08467. 21. Walsh T, Casadei S, Coats KH, Swisher E, Stray SM, Higgins J, et al.
Spectrum of mutations in BRCA1, BRCA2, CHEK2, and TP53 in families at high risk of breast cancer. JAMA. 2006;295(12):1379–88.
doi:10.1001/jama.295.12.1379.
22. Manoukian S, Peissel B, Frigerio S, Lecis D, Bartkova J, Roversi G, et al. Two new CHEK2 germ-line variants detected in breast cancer/sarcoma families negative for BRCA1, BRCA2, and TP53 gene mutations. Breast Cancer Res Treat. 2011;130(1):207–15. doi:10.1007/s10549-011-1548-5.
23. Kool M, Jones DT, Jager N, Northcott PA, Pugh TJ, Hovestadt V, et al. Genome Sequencing of SHH Medulloblastoma Predicts Genotype-Related Response to Smoothened Inhibition. Cancer Cell. 2014;25(3):393–405. doi:10.1016/j.ccr.2014.02.004.
24. Mascaro Cordeiro B, Dias Oliveira I, de Seixas Alves MT, Saba-Silva N, Capellano AM, Cavalheiro S et al. SHH, WNT, and NOTCH pathways in medulloblastoma: when cancer stem cells maintain self-renewal and differentiation properties. Childs Nerv Syst. 2014. doi:10.1007/s00381-014-2403-x
25. Xin Y, Shen XD, Cheng L, Hong DF, Chen B. Perifosine inhibits S6K1-Gli1 signaling and enhances gemcitabine-induced anti-pancreatic cancer efficiency. Cancer Chemother Pharmacol. 2014;73(4):711–9. doi:10.1007/s00280-014-2397-9.
26. Chung JH, Bunz F. A loss-of-function mutation in PTCH1 suggests a role for autocrine hedgehog signaling in colorectal tumorigenesis. Oncotarget. 2013;4(12):2208–11.
27. Kang HC, Wakabayashi Y, Jen KY, Mao JH, Zoumpourlis V, Del Rosario R, et al. Ptch1 overexpression drives skin carcinogenesis and developmental defects in K14Ptch(FVB) mice. J Invest Dermatol. 2013;133(5):1311–20. doi:10.1038/jid.2012.419.
28. Schmidt-Arras D, Schwable J, Bohmer FD, Serve H. Flt3 receptor tyrosine kinase as a drug target in leukemia. Curr Pharm Des. 2004;10(16):1867–83. 29. Laouar Y, Welte T, Fu XY, Flavell RA. STAT3 is required for Flt3L-dependent
dendritic cell differentiation. Immunity. 2003;19(6):903–12.
30. Moreno I, Martin G, Bolufer P, Barragan E, Rueda E, Roman J, et al. Incidence and prognostic value of FLT3 internal tandem duplication and D835 mutations in acute myeloid leukemia. Haematologica. 2003;88(1):19–24. 31. Armstrong SA, Mabon ME, Silverman LB, Li A, Gribben JG, Fox EA, et al. FLT3
mutations in childhood acute lymphoblastic leukemia. Blood. 2004;103(9): 3544–6. doi:10.1182/blood-2003-07-2441.
32. Chang P, Kang M, Xiao A, Chang J, Feusner J, Buffler P, et al. FLT3 mutation incidence and timing of origin in a population case series of pediatric leukemia. BMC Cancer. 2010;10:513. doi:10.1186/1471-2407-10-513. 33. Bhatlekar S, Fields JZ, Boman BM. HOX genes and their role in the development of human cancers. J Mol Med (Berl). 2014;92(8):811–23. doi:10.1007/s00109-014-1181-y.
34. Di Leva G, Garofalo M, Croce CM. MicroRNAs in cancer. Annu Rev Pathol. 2014;9:287–314. doi:10.1146/annurev-pathol-012513-104715.
35. Chen C, Zhang Y, Zhang L, Weakley SM, Yao Q. MicroRNA-196: critical roles and clinical applications in development and cancer. J Cell Mol Med. 2011; 15(1):14–23. doi:10.1111/j.1582-4934.2010.01219.x.
36. Venneti S, Boateng LA, Friedman JR, Baldwin DA, Tobias JW, Judkins AR, et al. MiRNA-9 and MiRNA-200a distinguish hemangioblastomas from metastatic clear cell renal cell carcinomas in the CNS. Brain Pathol. 2012; 22(4):522–9. doi:10.1111/j.1750-3639.2011.00551.x.
37. Chuikov S, Levi BP, Smith ML, Morrison SJ. Prdm16 promotes stem cell maintenance in multiple tissues, partly by regulating oxidative stress. Nat Cell Biol. 2010;12(10):999–1006. doi:10.1038/ncb2101.
38. Tijssen MR, Ghevaert C. Transcription factors in late megakaryopoiesis and related platelet disorders. J Thromb Haemost. 2013;11(4):593–604. doi:10. 1111/jth.12131.
39. Scharenberg MA, Chiquet-Ehrismann R, Asparuhova MB. Megakaryoblastic leukemia protein-1 (MKL1): Increasing evidence for an involvement in cancer progression and metastasis. Int J Biochem Cell Biol. 2010;42(12): 1911–4. doi:10.1016/j.biocel.2010.08.014.
40. Agazie YM, Movilla N, Ischenko I, Hayman MJ. The phosphotyrosine phosphatase SHP2 is a critical mediator of transformation induced by the oncogenic fibroblast growth factor receptor 3. Oncogene. 2003; 22(44):6909–18. doi:10.1038/sj.onc.1206798.
41. Tartaglia M, Niemeyer CM, Fragale A, Song X, Buechner J, Jung A, et al. Somatic mutations in PTPN11 in juvenile myelomonocytic leukemia, myelodysplastic syndromes and acute myeloid leukemia. Nat Genet. 2003; 34(2):148–50. doi:10.1038/ng1156.
42. Ucar C, Calyskan U, Martini S, Heinritz W. Acute myelomonocytic leukemia in a boy with LEOPARD syndrome (PTPN11 gene mutation positive). J Pediatr Hematol Oncol. 2006;28(3):123–5. doi:10.1097/01.mph.0000199590. 21797.0b.
43. Tartaglia M, Martinelli S, Cazzaniga G, Cordeddu V, Iavarone I, Spinelli M, et al. Genetic evidence for lineage-related and differentiation stage-related contribution of somatic PTPN11 mutations to leukemogenesis in childhood acute leukemia. Blood. 2004;104(2):307–13.
doi:10.1182/blood-2003-11-3876.
44. Kim JS, Shin OR, Kim HK, Cho YS, An CH, Lim KW, et al. Overexpression of protein phosphatase non-receptor type 11 (PTPN11) in gastric carcinomas. Dig Dis Sci. 2010;55(6):1565–9. doi:10.1007/s10620-009-0924-z.
45. Bard-Chapeau EA, Li S, Ding J, Zhang SS, Zhu HH, Princen F, et al. Ptpn11/ Shp2 acts as a tumor suppressor in hepatocellular carcinogenesis. Cancer Cell. 2011;19(5):629–39. doi:10.1016/j.ccr.2011.03.023.
46. Yang W, Wang J, Moore DC, Liang H, Dooner M, Wu Q, et al. Ptpn11 deletion in a novel progenitor causes metachondromatosis by inducing hedgehog signalling. Nature. 2013;499(7459):491–5. doi:10.1038/ nature12396.
47. Lui WO, Chen J, Glasker S, Bender BU, Madura C, Khoo SK, et al. Selective loss of chromosome 11 in pheochromocytomas associated with the VHL syndrome. Oncogene. 2002;21(7):1117–22. doi:10.1038/sj.onc.1205149. 48. Sprenger SH, Gijtenbeek JM, Wesseling P, Sciot R, van Calenbergh F,
cerebellar hemangioblastomas revealed by comparative genomic hybridization. J Neuro-Oncol. 2001;52(3):241–7.
49. Xue L, Yue S, Zhang J. FOXP1 has a low expression in human gliomas and its overexpression inhibits proliferation, invasion and migration of human glioma U251 cells. Mol Med Rep. 2014;10(1):467–72. doi:10.3892/mmr.2014.2197. 50. Nagel S, Meyer C, Kaufmann M, Drexler HG, MacLeod RA. Deregulated FOX
genes in Hodgkin lymphoma. Genes Chromosomes Cancer. 2014;53(11): 917–33. doi:10.1002/gcc.22204.
• We accept pre-submission inquiries
• Our selector tool helps you to find the most relevant journal
• We provide round the clock customer support
• Convenient online submission
• Thorough peer review
• Inclusion in PubMed and all major indexing services
• Maximum visibility for your research
Submit your manuscript at www.biomedcentral.com/submit