UNIIVERSITI TEKNIKAL MALAYSIA MELAKA
FAKULTI KEJURUTERAAN ELEKTRIK
LAPORAN SARJANA MUDA (PSM II)
BEKU 4983
DESIGN AND DEVELOPMENT OF PC BASED SOFTWARE FOR TIME
AND
FREQUENCY DOMAINIDAWATI BINTI HATIB (B010410150)
SUPERVISOR
DESIGN
AND
DEVELOPMENT OFPC BASED SOFTWARE FOR TIME &
FREQUENCY
DOMAINIDAWATI BINTI HATIB
This Report Is Submitted In Partial Fulfillment of Requirements For The Bachelor
Degree of Electrical Engineering (Power Electronic & Drives)
Faculty of Electrical Engineering Universiti Teknikal Malaysia Melaka
"I hereby declare that I have to read through this report that I has comply the partial fulfillment for awarding the degree of Bachelor of Electrical Engineering
( Power Electronic & Drives)"
Signature
W F U U A BIN ALWl $ SUHAlMl
...
Supervisor's Name : p6iiS.
...
DESIGN
AND
DEVELOPMENT OFPC BASED SOFTWARE FOR TIME & FREQUENCY DOMAIN
IDAWATI BINTI HATIB B 010410150
" I hereby declare that this report is a result of my own work except for the excerpts
that have been cited clearly in the references."
I dedicate this to my beloved parents, my whole family, lecturers, and to all my friends,
ACKNOWLEDGEMENT
I would like to acknowledgement the following people, who have assisted and
supported me in the completion of this thesis.
I would like to express my sincere gratitude to my supervisor Mr. Saihlza Alwi @
Suhaimi for his constant guidance, encouragement and for his patience throughout
the completion of this thesis.
I would like to express my deepest gratitude to my family who have endured with
me, supported and encouraged me with their continuous love since the beginning,
now and hopefblly until the days to come.
Last, my never ending gratitude to God Almighty for
ABSTRACT
One of the most widely used pieces of electronic test equipment is the
oscilloscope which shows the shape of a video pulse appearing at a selected
equipment test point. Today, many people are used to observe signals in the time
domain with an oscilloscope. However, most oscilloscopes do not have the frequency
domain to see spectrum signals. In addition, it will not help much in determining what a signal looks like in the frequency domain. This is where spectrum analyzers
come in. Spectrum Analyzer also as a test equipment, is used to sweep over a band of
frequencies to determine what frequencies are being produced by a specific circuit
under test, and then the amplitude of each frequency component. This project is
called PC based software for time and frequency domain which is to develop a
software and display in time and frequency domain using DAQ card instrument. This
PC based software is controlled with easy to use windows software. This allows for
more organized data display and larger screen size. By using Visual Basic 6.0, the
interface is designed with fiiendly graphical user interfkce (GUI). This software also
has data management like saving data and picture, loading, screen capture and
ABSTRAK
Salah satu alatan ujian elektronik yang digunakan secara meluas adalah
osiloskop, di mana ia menunjukkan bentuk paparan denyut video pada peralatan
yang dijadikan sebagai titik ujian. Kebanyakan orang menggunakan osiloskop
sebagai alat untuk mendapatkan isyarat dalam bentuk domain masa. Bagaimanapun,
kebanyakan osiloskop tidak mempunyai domain tkekuensi untuk memaparkan isyarat
spektrum. Itu adalah faktor mengapa penganalisis spektnun direkabentuk.
Penganalisis spektrum juga adalah sejenis alatan ujian yang digunakan untuk
menukar gantikan kumpulan frekuensi kepada satu tkekuensi yang sesuai, bergantung
kepada litar yang di uji dan amplitud setiap komponen fiekuensi. Projek ini dikenali
sebagai perisian domain masa dan fiekuensi berpandukan komputer peribadi dimana ianya adalah untuk membangunkan perisian dan memaparkan domain masa dan
domain hkuensi dengan menggunakan peralatan DAQ kad. Perisian ini mudah
dikawal dengan menggunakan p e r i s h tetingkap. h i membolehkan data dipaparkan
dan saiz paparan boleh diubah suai mengikut kehendak pengguna, dengan mengaplikasikan Paparan Pengguna Grafik (GUI) yang mema pengguna dan
mengunakan Visual Basic 6.0. Perisian domain masa dan fiekuensi berpandukan
komputer Peribadi ini juga mempunyai pengurusan data yang teratur seperti menyimpan data dan gambar, masukan perisian, tangkapan paparan dan mengawal
isyarat dalam masa yang sebenar. Bahagian USB di gunakan sebagai sambungan
CONTENTS
PAGE
PROJECT
TITLE DECLARATION DEDICATIONACKNOWLEDGEMENT ABSTRAK
CONTENTS
LIST
OF
FIGURES LIST OF TABLE ABBREBI ATIONI INTRODUCTION
1.1 ProjectBackground
1.2 Objectives
1.3 Problem Statement
1.4 Scope Of Project
1.5 AdvantagestBenefits
1.6 Novelty
II
LITERATUREREVIEW
2.1 Overview
2.2 Fundamentals Of Oscilloscope
2.2.1 Principles of operations
2.2.2 Setting Up and Interpreting the Trace
2.3 Digital Signal Processor
2.3.1 Signal Sampling
2.3.2 Nyquist Theorem
2.3.3 Frequency Domain
2.4 Fundamental Of Spectrum Analyzer
2.4.1 Concept of Real Time Spectrum
2.4.2 Fast Fourier Transform Analysis
2.5 Relation Between DAQ Card And
Visual Basic
2.6 Rapid Prototyping 2.7 Visual Basic 6.0
2.7.1 Creating a Component Works
2.7.2 Configuring Controls in Property Pages
2.8 Study and research of the project
m
PROJECT METHODOLOGY3.1 Background
3.2 Project Flow
IV
RESULT AND DISCUSSTION4.1 Overview
4.2 PC Based Software
4.2.1 Flash Graphic Design
4.2.2 Laboratory Account Database
4.2.3 Loading Software
4.2.4 GUI of PC Based Software 4.2.5 Tools Setting
4.2.6 Graph Analysis Preview
4.2.7 Graph Type
4.3 Voltage Transducer
4.3.1 Circuit Simulation Analysis
4.3.2 Voltage Transducer Device
4.4 Project Analysis
viii
V CONCLUSION AND SUGGESTION
5.1 Conclusion 5.2 Suggestion
REFERENCES
LIST OF FIGURES
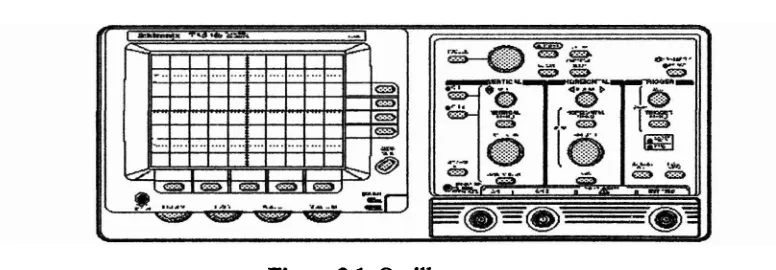
Oscilloscopes
The internal parts of an oscilloscope
Deflection of an electron in a uniform electric field
voltage displayed with different gain and sweep
Example of trace interpretation
Main component of a DSP system
Spectrum Analyzer
Waveform of Complex signal
Complex signal in both the time and frequency domain
The sample-frame-block structure
The relation DAQ card and Visual Basic 6.0
Rapid Prototype
Componentworks Controls into the Toolbox
The properties of CWKnob control
The flow chart methodology of this project
Show the main flash design interface
The INTRO form flash design
The OBJECTNE form flash design
The ADVANTAGES form flash design
The NOVELTY form flash design
The DETAlL form flash design Loading account menu
Laboratory Identify User form
Update Profile and Register User form
Loading the PC Based Software
PC Based Software GUI & Oscilloscope
PC Based S o h a r e GUI & Spectrum Analyzer 39
Tools form properties 39
Print preview form properties 4 1 The sine Output for Real Time form 42
The triangle output for Real Time form 42 The rectangular output for Real T i e form 43
Illustrate the voltage transducer circuit using MULTISIM
Software 43
Oscilloscope display for minimum value 44
Oscilloscope display for maximum value 45 Voltage Transducer with DAQ card 45
Schematic voltage divider in Voltage Transducer 46
LIST OF TABLES
TITLE
Button function of PC Based Software
Simulation result
DAQ card FFT GUI PC
VT
VB
-
Data Acquisition card-
Fast Fourier Transform-
Graphical User InterfaceCHAPTER I
INTRODUCTION
1.1 Project Background
Nowadays, all relatively inexpensive computers designed for an individual
user. In medium price, personal computers range anywhere. All are based on the
microprocessor technology that enables manufacturers to put an entire CPU on one
chip. For education like university student, they used personal computer as reference
to get knowledge or information, doing the task for assignment and also made
technology experiment to improve their understanding. In other word, personal
computer is a medium of new technology to step forward for giving human a good
culture live.
Evolution was coming with fresh idea. The PC based software has been
developed to face the innovative technology. PC based software is easy to control
when using windows software. With friendly graphical user interface, PC based
software also has data management in real time. In addition, data management can
also do printing work and capture image.
In this chapter, the objectives, scope, problem statements, and a brief
1 3 Project Objectives
There are four objectives of this project which are:
i. To obtain the basic knowledge of Visual Basic (VB) programming language.
ii. To develop a system that can capture real time input signal by using DAQ
card, having data management and printing output through Personal
Computer (PC).
iii. To display the waveform in real time using DAQ card technology.
iv. To analyze the Fast Fourier Transform (FFT) and fkquency contents of the input signal given.
1 3 Problem Statement
Currently, oscilloscope and signal spectrum analyzers used in laboratory for
education purpose are quite expensive, therefore some of the experiments cannot be
carried out. By using Data Acquisition (DAQ) card technology, many applications
can be performed with cost effective.
Nowadays, both oscilloscope and spedrum analyzer are used as testing
equipment in industry and also for education purpose. Using the innovation concept,
the software is developed with same function as the real oscilloscope to make it
different and creative. It also casl attract people to learn and know more about digital
signal processing.
Besides, oscilloscope and spectrum analyzer only have small monitor to
monitor the waveform and the data could not be save in text when the data is
necessary for analysis or comparison .Using this software, all problem can be solved
and some of the functions can make the test or experiment more effective. It also can
save the time for conducting result oriented experiments followed by a reliable result
Therefore, by using a low cost spectrum analyzer based mainly on DAQ card
and VB graphical user interfaces (GUI), this software is suitable for education
purpose.
1.4 Scope of Project
There are several factors that to be considered in implementation of this
project:
i. Use of National Instrument DAQ card.
ii. The frequency input that can be measure is 0 to 4000Hz.
iii. For voltage transducer, it will be designed to receive low voltage signal. The
range is between 0 to 30V before entering to DAQ card.
iv. This project has sampling fkquency that used for sample data. It is about
8000Hz as indication.
v. Can display the real time voltage and FFT of the signal.
vi. The main component will be designed using Visual Basic 6.0 for graphical
user interface (GUI).
The advantages of this project are:
1. Desktop or laptop is used to make it easy to bring and use it anywhere.
2. The GUI of this software is very user friendly and also high-resolution
display.
3. More data storage and simple to save any parameter used for measure the
real-time signal and analysis of the signal.
4. More function such as resizable monitor screen, screen caption, printing and
other functions which is much more convenient compare to real equipment
that used for analysis.
1.6 Novelty
The novelties of this project are:
1. A low cost o f Oscilloscope and Spectrum Analyzer.
2. Useful tool in education for doing experiment and helps student in learning. 3. Able to measure lower fkquency and more efficient in producing output
signal.
CHAPTER I1
2.1 Overview
This section, will discuss about the theories and concepts of this project in
detail. Also, it will explain about the perspective and method that have been used in
this project. The concept that will be discussed is about the Oscilloscope, DSP, DAQ
card and programming language sohare. It also include about spectrum analyzer
technology which is very expensive to be developed. Using the advantages of
Personal Computer, the s o h a r e is developing to give something new or preference
idea for this project.
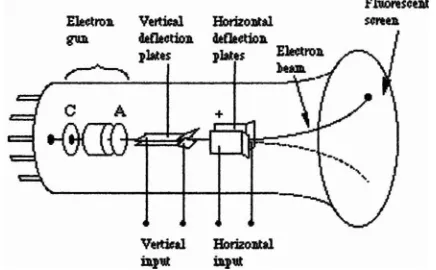
[image:21.544.94.482.544.679.2]2.2 Fundamentals of Oscilloscope
Knowing how to use an oscilloscope is an important skill in many technical
fields. Oscilloscopes are widely used both as diagnostic instruments in electronics
development and as monitors in experimental research. They are valuable because
they display a graph of voltage versus time, and they can do this for rapidly varying
voltages in "real time". The oscilloscope is an electronic instrument based on the
cathode ray tube (CRT), the essentiai parts of which are an electron gun which
produces a fine electron beam and a fluorescent film which lights up when struck by
the electrons. These parts are enclosed by a glass envelope which has been evacuated
and sealed [I].
Other important parts of an oscilloscope include a time-base generator that
serves as a clock, and two sets of deflection plates that are used to steer the electron
beam. The visible part of the CRT tube, the "screen", is the outside of the glass wall
on whose inner surface lies the fluorescent film. The screen is inscribed with a set of
axes enclosed by a grid. As the oscilloscope operates, the electron beam traces a
graph of voltage versus time on the fluorescent film behind these axes. The
horizontal axis is the time axis, and the vertical axis is the voltage axis. It can think
of the oscilloscope as a voltmeter with a display screen.
23.1 Principles Of Operation
An osciIloscope is essentially an electron gun like those used in some
TV
sets [image:22.544.191.409.525.660.2](see Figure 2 2 ) .
The gun produces a beam of electrons. A set of parallel plates (the "Vertical
deflection platesn) oriented in horizontal planes is located near the exit of the electron
gun. As the beam emerges from the gun, it must pass between these plates. The
voltage to be displayed (i.e., the "signaln) is amplified and applied across these plates
producing an electric field which deflects the electrons vertically-up or down-
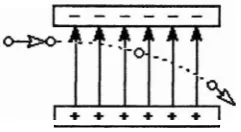
[image:23.543.227.348.192.258.2]depending on the polarity of the signal [I] (see Figure 2.3).
Figure 23: Deflection of an electron in a uniform electric field
The Gain knob adjusts the vertical amplifier so the resulting trace can be
reduced or enlarged vertically on the screen. The beam then passes through a second
set of similar plates but oriented in vertical planes. A potential difference applied
across these plates produces an electric field which deflects the electrons left or right.
These "Horizontal deflection plates" make the beam move sideways at a constant
speed. The speed is controlled by the Sweep knob. Adjusting the sweep speed can
spread out or compress a trace [I].
If the two deflecting voltages were constant, the electron beam would strike a
fixed point on the fluorescent film and you would see a stationary spot. However,
these voltages are time-varying, so the spot moves around on the screen. The
fluorescent material has the property of emitting light for several milliseconds after
the electrons have passed, so the total effect is for the electrons to leave a visible trail
behind them a curve on the screen [I].
The horizontal deflection voltage (or "sweep" voltage) varies in such a way
that when the beam reaches the right-hand edge of the screen, it starts over at the left-
hand side. If the signal to be displayed varies periodically in time, it is possible to
synchronize the sweep voltage with the signal so that the m e appears motionless
on the screen. This is done with the Trigger Level control which sets the oscilloscope
button lets user choose whether user want the oscilloscope to trigger on a positive or
negative voltage. A trace that is running across the screen can usually be stabilized by adjusting the trigger level [I].
Many electrical signals have both AC (time varying) and
DC
(constant) components. Sometimes the DC component of a signal is so large that it drowns out the AC component. The switch labeled AC-GND-DC is set to whatever type of voltage (AC or DC) will be measured. Setting it to AC feeds the incoming signalthrough a capacitor, which filters out the DC component while passing the AC
component undisturbed. If the switch is set to DC the capacitor is bypassed and the entire signal reaches the oscilloscope.
The oscilloscopes used in this course have two separate vertical inputs, or
"channels", so the scope can display two voltages at the same time. The Mode
switches allow user to choose the channel (1 or 2) or combination of channels which
will be displayed on the screen. The Source (sometimes labeled Int. TTrig.) switch is
used to select which channel is used for the trigger. The source is usually set to a
channel which has an input to be displayed [I].
2.2.2 Setting Up and Interpreting the
Trace
Let the oscilloscope w m up for a few minutes before trying to use it. User
can adjust the intensity of the beam and focus it to a fine line while you wait. The
trace will be sharper if the intensity is low. The trace should be a horizontal line if
nothing is connected to the oscilloscope. When the AC-GND-DC switch set to GND, this line marks the place on the screen where V = 0. The vertical Position knob will
move the line vertically until it's where user want it. The left edge of the trace marks
the point where t = 0. The trace can be moved back and forth with the horizontal
Position knob.
Once the oscilloscope is connected to the circuit, user may have to adjust the
gain and sweep to get a readable trace. Figure 2.4 shows how changing the gain and