Volume 2006, Article ID 25861, Pages1–13 DOI 10.1155/WCN/2006/25861
Multiservice Vertical Handoff Decision Algorithms
Fang Zhu and Janise McNair
Wireless & Mobile Systems Laboratory, Department of Electrical and Computer Engineering, University of Florida, P.O. Box 116130, Gainesville, FL 32611, USA
Received 8 October 2005; Revised 22 March 2006; Accepted 26 May 2006
Future wireless networks must be able to coordinate services within a diverse-network environment. One of the challenging prob-lems for coordination is vertical handoff, which is the decision for a mobile node to handoffbetween different types of networks. While traditional handoffis based on received signal strength comparisons, vertical handoffmust evaluate additional factors, such as monetary cost, offered services, network conditions, and user preferences. In this paper, several optimizations are proposed for the execution of vertical handoffdecision algorithms, with the goal of maximizing the quality of service experienced by each user. First, the concept of policy-based handoffs is discussed. Then, a multiservice vertical handoffdecision algorithm (MUSE-VDA) and cost function are introduced to judge target networks based on a variety of user- and network-valued metrics. Finally, a per-formance analysis demonstrates that significant gains in the ability to satisfy user requests for multiple simultaneous services and a more efficient use of resources can be achieved from the MUSE-VDA optimizations.
Copyright © 2006 F. Zhu and J. McNair. This is an open access article distributed under the Creative Commons Attribution License, which permits unrestricted use, distribution, and reproduction in any medium, provided the original work is properly cited.
1. INTRODUCTION
Future wireless networks must be able to coordinate ser-vices within a diverse network environment. For example, a widely deployed third generation (3G) cellular and data ser-vice, such as the general packet radio service (GPRS), may be supplemented by the local deployment of high bandwidth wireless local area networks (WLANs), such as IEEE 802.11 and the European high performance radio LAN (HiperLAN). Furthermore, as shown inFigure 1, existing networks, such as satellite, cellular, and WLAN, will need to integrate with emerging networks and technologies, such as wireless mesh networks and Wi-Max to allow a user to transparently and seamlessly roam between systems.
Seamless roaming involves handoff, which is the process of maintaining a mobile users active connections as it moves within a wireless network [1]. Vertical handoff, or intersys-tem handoff, involves handoffbetween different types of net-works [2,3]. Traditionally, handoffdecisions have been based on an evaluation of the received signal strength (RSS) be-tween the base station and the mobile node. However, tradi-tional RSS comparisons are not sufficient to make a vertical handoffdecision, as they do not take into account the various attachment options for the mobile user. More recently, band-width and the type of network have been considered as fac-tors. For example, the third generation partnership project
(3GPP) is currently developing standards for the issue of when, where, and how to initiate a vertical handoffbetween the 3G cellular network and WLAN networks. Future wire-less integration must include still other relevant factors, such as monetary cost, network conditions, mobile node condi-tions, and user preferences, as well as the capabilities of the various networks in the vicinity of the user. Thus, a complex, adaptive, and intelligent approach is needed to implement vertical handoffprotocols to produce a satisfactory result for both the user and the network.
1.1. Related work
LEO or GEO satellites
FES
Global
CSS
Satellite cell BS
Suburban Urban In-building
CSS CSS
CSS
Picocell Microcell Macrocell
Figure1: Diverse third- and fourth-generation (3G and 4G) wireless networks.
TCP timeout and throughput [8,9], and packet loss [10]. However, the vertical handoffdecision did not consider mul-tiple networks supporting mulmul-tiple services for each user.
The related papers that explored vertical handoffdecision mainly focus on traditional issues, such as RSS and data rate. In [11], a fast-Fourier-transform- (FFT-) based signal decay detection scheme was used to reduce the ping-pong hand-offeffect, and an adaptive threshold configuration approach was proposed to prolong the time a user stays in WLAN. In [12,13], a vertical handoffalgorithm was proposed that took into account RSS, data rate, and packet loss due to handoff delay for a single service per user. A vertical handoffsystem based on computed background noise and signal strength was proposed in [14]. In [15], the WISE handoffdecision algorithm was proposed to maximize energy-efficiency with-out sacrifice of overall network degradation. In [16], a QoS-based handoffmethod between UMTS and WLAN was pro-posed, but the definition of QoS was not defined in the pa-per. Finally, several papers have focused on mobility level and user position in the network. In [17], mobility level was proposed as a proper metric for multi-tier handoffs. In [2], multi-network architectural issues were explored, and an ad-vanced neural-network-based vertical handoffalgorithm was developed to satisfy user bandwidth requirements. In [18], a vertical handoff algorithm based on pattern recognition was presented. Although the above-mentioned research ad-dresses handoffdecision, most research address 3G/WLAN issues, and do not provide a way to incorporate a general, user-defined idea of quality of service, on which to base ver-tical handoffdecisions.
Several papers have created utility functions to better evaluate the choice for vertical handoff. In [19], the verti-cal handoffdecision function was a measurement of network quality. However, no performance analysis was provided. In [20], an active application-oriented handoffdecision al-gorithm was proposed for multi-interface mobile terminals to reduce the power consumption caused by unnecessary handoffs and other unnecessary interface activation, and in [21], a policy-enabled handoffdecision algorithm was
pro-posed along with a cost function that considers several hand-offmetrics. However, multi-service handoffwas not fully dis-cussed. However, the multiple active services case was not considered. The work in [22] adaptively adjusted the handoff stability period based on a utility function to avoid unneces-sary handoffs and reduce decision time. Finally, the authors have presented a tutorial on vertical handoffs in [3], and in [23], introduce a cost function-based vertical handoff deci-sion algorithm for multiservices handoff. Preliminary results demonstrated significant gain in throughput. This paper ex-tends the work to examine the system performance with re-spect to blocking probability and user satisfactions, that is, the ability of the network to satisfy all of the users simultane-ous requests.
In this paper, several optimizations are proposed to en-hance the handoffdecision process and to make the follow-ing contributions: (1) the development of a handoff cost function that addresses an environment where users conduct multiple active sessions among a variety of wireless network choices, (2) the design of a multiservice vertical handoff deci-sion algorithm (MUSE-VDA), which incorporates a network elimination process to potentially reduce delay and process-ing in the handoff calculation, and (3) a constraint opti-mization analysis for the proposed handoffcost function for different types of user services spread among multiple net-works. InSection 2, the policy-based handoffapproach is de-scribed.Section 3introduces the MUSE-VDA cost function and algorithm to decide target networks based on a variety of user- and network-valued metrics. Finally, in Sections4and 5, the performance analysis and numerical results demon-strate the load-balancing advantages of the proposed tech-nique, as well as the significant gains in satisfied user requests and a more efficient use of resources.Section 6concludes the paper.
2. POLICY-BASED VERTICAL HANDOFFS
network devices within a single administrative domain to implement a set of quality-of-service- (QoS-) based services [24].Figure 2shows two possible conceptual architectures of policy-based solutions that have been proposed by the IETF. The two main architectural elements for policy control are the policy enforcement point (PEP) and the policy decision point (PDP). These two elements may be located in the same network node (as shown inFigure 2(a)) or in different nodes (as shown inFigure 2(b)). The latter is especially convenient to apply local policies.
PEP is a component that runs on a policy-aware node, such as an access point, and is the point at which the poli-cies are enforced. Policy decisions are made primarily at the PDP, based on the policies extracted from a network policy database. The PDP as specified by the IETF may make use of additional mechanisms and protocols to achieve additional functionality such as user authentication, accounting, and policy information storage.
In the case of vertical handoff, the policy database holds information regarding the metrics to be considered for a vertical handoff, where handoff metrics are the measured qualities that give an indication of whether or not a hand-offis needed. As stated previously, in traditional handoffs, only RSS and channel availability are considered. In the envi-sioned integrated wireless system, the following new metrics are suggested [3].
(i) Service type. Different types of services require various
combinations of reliability, latency, and data rate.
(ii)Monetary cost. A major consideration to users, as
dif-ferent networks may employ different billing strategies that may affect the user’s choice to handoff.
(iii)Network conditions. Network-related parameters such as traffic, available bandwidth, network latency, and congestion (packet loss) may need to be considered for effective network usage. Use of network informa-tion in the choice to handoffcan also be useful for load balancing across different networks, possibly relieving congestion in certain systems.
(iv)System performance. To guarantee the system
perfor-mance, a variety of parameters can be employed in the handoff decision, such as the channel propaga-tion characteristics, path loss, interchannel interfer-ence, signal-to-noise ratio (SNR), and the bit error rate (BER). In addition, battery power may be another cru-cial factor for certain users. For example, when the bat-tery level is low, the user may choose to switch to a network with lower power requirements, such as an ad hoc Bluetooth network.
(v)Mobile terminal conditions. MT condition includes
dy-namic factors such as velocity, moving pattern, moving histories, and location information.
(vi) User preferences. User preference can be added to cater
to special requests for users that favor one type of sys-tem over another.
The use of new vertical handoffmetrics and the policy-based networking architecture increases the complexity of the handoffprocess and makes the handoffdecision more
PDP
Policy DB
PEP
Network node
(a) PEP and PDP located in the same network node
PDP
Policy DB
PEP
Network node Policy server
(b) PEP and PDP located in different network nodes
Figure2: Two possible policy-based network architectures.
and more ambiguous. However, the use of an optimized cost function can simplify the handoffprocess and speed up the handoffdecision. Then, intelligent techniques can be devel-oped to evaluate the effectiveness of new decision algorithms, balanced against user satisfaction and network efficiency.
2.1. Proposed vertical handoff interworking scenarios
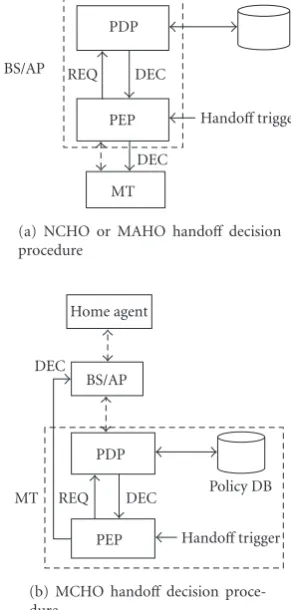
To demonstrate the operation of the policy-based architec-tures, the following two scenarios are described: (1) net-work-controlled handoff(NCHO)/mobile-assisted handoff (MAHO), where the network generates a new connection and finds new resources for the handoff, performing any ad-ditional routing operations, and (2) mobile-controlled hand-off(MCHO), where the mobile terminal must take its own measurements and make the evaluations for the handoff de-cision.
PDP
(a) NCHO or MAHO handoffdecision procedure
(b) MCHO handoffdecision proce-dure
Figure3: Two scenarios for policy-based architectures.
and network conditions, from the database located in local or home network, makes the handoffdecision, and returns the decision message to the PEP. The handoffdecision is made using utility-function-based algorithms as proposed in [23]. The PEP then informs the mobile terminal about the handoff decision and enforces the policy decision by handing offto the target network. In NCHO/MAHO, we propose that the PDP point is represented by the base station (BS) or access point (AP).
In MCHO, the mobile terminal finds new resources and the network approves the handoffdecision. Thus, we propose that the PDP is located at the mobile terminal. As shown in Figure 3(b), when the mobile terminal detects a severe QoS degradation, its PEP module triggers the handoffdecision process by sending a handoffdecision request message to the PDP. While some information is already available at local database, the PDP may also need other necessary informa-tion, such as network conditions, from the network devices. Other information may not be immediately available at the BS or AP, and may need to be extracted from the network. Upon receiving all handoffmetrics, the PDP makes the hand-offdecision and returns the decision to the PEP. The PEP then informs the network the handoffdecision by forwarding the DEC message, along with enforced authentication infor-mation. A handoffwill take place once the network approves. It may be a limiting factor to achieve the necessary
process-ing for a vertical handoffcontrolled by the mobile terminal. However, if simple metrics are set, a combination of the two techniques, that is, mobile-assisted handoff(MAHO), may be a viable option.
3. MULTISERVICE VERTICAL HANDOFF DECISION ALGORITHM COST FUNCTION
The MUSE-VDA vertical handoffcost function measures the benefit obtained by handing offto a particular network. It is evaluated for each networknthat covers the service area of a user. The network choice that results in the lowest calcu-lated value of the cost function is the network that provides the most benefit, where the benefit is defined by the given handoffpolicy.
The cost function evaluated for networknincludes the cost of receiving each of the user’s requested services from networknand is calculated:
Cn= s C
n
s, (1)
wheresis the index representing the user-requested services, andCsnis the per-service cost function for networkn.Cns rep-resents the QoS experienced by choosing to receive services from networknand is calculated as
Cn
where Qns,j is the normalized QoS provided by network n for parameter j and services.Wsn,j is the weight which in-dicates the impact of the QoS parameter on the user or the network.Cns includes both a normalized value for the QoS parameter and a weight for the impact of the parameter on either the user or the network. For an example from the users perspective, suppose that a mobile terminal requests a ser-vice with a specified minimum delay and minimum power consumption requirement. If the mobile terminal has a low battery life, the power consumption takes on greater impor-tance than meeting the delay constraints. For an example of a network-based QoS request and the corresponding impact, the availability of the services requested by the user in the target network impacts the network congestion in the tar-get network. Using the impact factor, the network may direct users toward a less desirable, but less congested network.
The handoffdecision problem thus equals the following constraint optimization problem:
where Ens,j is the network elimination factor, indicating
whether the constraintifor servicescan be met by network
Begin with a list of active services Select the service with highest priority Evaluate (4) for each possible target network Handoffto networknbased on the optimal result of (4) Yes
No Any unassigned services left?
Update resource database End
Figure4: Scenario 2: prioritized session handoff.
requested delay for a real-time service, and should be imme-diately removed from consideration as a handofftarget for the requested service.
The application of the vertical handoffcost function is flexible to allow for different vertical handoff policies. To demonstrate the performance of the new cost function, two different policy scenarios are explored.
3.1. Collective session handoff
It is assumed that a single user may conduct multiple com-munication sessions. In the first vertical handoffpolicy, the vertical handoffdecision is optimized for all sessions collec-tively, that is, all of the users active sessions are handed off to the same target network at the same time. The cost func-tion,Cn, is determined for all sessions going to a single net-work. The optimal target network for handoffis determined by solving (3).
3.2. Prioritized session handoff
The second vertical handoffpolicy prioritizes each service and then optimizes the vertical handoffdecision individu-ally for each session, that is, each of the users active sessions may be independently handed offto a different target net-work. In this scenario, the mobile terminal maintains a list of its current active sessions, arranged in priority order. Then, the cost functionCsnis evaluated for the highest priority ser-vice. The optimal target network is chosen by minimizing the per-service cost:
minCns =
s W
n
s,jQns,j s.t.Ens,j=0, ∀i. (4)
Then, the next highest priority service is selected, the cor-responding cost function is evaluated, and the target network is determined. The process continues to the last active ses-sion. If the constraints for one session cannot be met, then the user loses the individual session only. The process for the second scenario is outlined inFigure 4.
3.3. Cost function example
As an example, consider a reporter in the field using wire-less networks to send audio, video reports, and photographic images to a home base, but whose equipment is running low on battery power. There are three available networks, UMTS, WLAN, and satellite. The cost function calculation from (3) is formed as follows:
(i) n represents the three network choices, UMTS, WLAN, or a satellite network.
(ii) srepresents the services needed, in this case, audio, video, and images.
(iii) j represents the constraint parameters: bandwidth, battery power consumption, and delay.
(iv) For collective handoff, a calculation of (3) is made for each network.
(1) For example, for the UMTS network,
CUMTS=WUMTS
video, bandwidthQUMTSvideo, bandwidth
+Wvideo, battery powerUMTS QUMTSvideo, battery power
+Wvideo, delayUMTS QUMTSvideo, delay
+Waudio, bandwidthUMTS QUMTSaudio, bandwidth
+Waudio, battery powerUMTS QUMTSaudio, battery power
+Waudio, delayUMTS QUMTSaudio, delay
+Wimage, bandwidthUMTS QUMTSimage, bandwidth
+Wimage, battery powerUMTS Qimage, battery powerUMTS
+Wimage, delayUMTS QUMTSimage, delay.
(5)
(2) Then,CWLANandCSatelliteare calculated similarly. (3) The lowest of the three costsCUMTS,CWLAN, and
CSatellitereveals the target network. If satellite cost is the lowest, then all sessions, video, audio, and images, are sent via the satellite network.
(v) For prioritized session handoff, a calculation of (4) is made for the highest priority session.
(1) For example, if the video feed has the highest pri-ority, thenCUMTS
video is calculated first:
CUMTS video =
WUMTS
video, bandwidthQUMTSvideo, bandwidth
+Wvideo, battery powerUMTS QUMTSvideo, battery power
+Wvideo, delayUMTS QUMTSvideo, delay.
(6)
(2) ThenCWLANvideo andCvideoSatelliteare calculated similarly. (3) The lowest of the three costsCvideoUMTS,CvideoWLAN, and
CSatellite
video reveals the target networkfor video service
Network 3
SN3 SN3 N1 SN3 N2
SN1 N3 SN2 N3
SN3 SN3 N1N2
Network 1 Network 2
SBOUND
D L E
H
O R
K C I S
A P B
T
G M F
Q
Figure5: 3G/WLAN overlay network scenario.
(4) The calculation is repeated for the next highest priority service, say the audio feed. Thus, in the prioritized session handoffit may be the case that the video is sent via satellite for the bandwidth, but the audio is sent via UMTS.
In the next section, the performance of the proposed MUSE-VDA algorithm and cost function is analyzed. First, a sample overlay network scenario is provided, along with a description of the mobility model, followed by calculations of the blocking probability and the average percentage of user requests that are satisfied by the network.
4. MUSE-VDA PERFORMANCE ANALYSIS
For effective comparison with other techniques, the per-formance analysis considers the case of 3G/WLAN hand-off scenario, where received signal strength (RSS), chan-nel availability, and bandwidth are the specified constraints. However, note that any other network combination or any other combination of the vertical handoffmetrics listed in Section 2can just as easily be substituted in the evaluation.
The top view of a typical 3G network overlay environ-ment is shown inFigure 5, where three networks of diff er-ent maximum data rates coexist in the same wireless service area. Network 1 (centered at A) and Network 2 (centered at B) each represent a WLAN, while Network 3 (centered at C) represents a GPRS network. The shaded circles on the left and right represent the area where RSS from Network 1 or Network 2 is stronger than that from Network 3. To high-light the effects of the vertical handoffprocedure among the three networks, only the users within the overlapping areas are considered, represented by the dashed square inFigure 5.
4.1. Mobility model
User mobility trajectories are characterized by the widely used random waypoint (RWP) model [25]. Adjustments have been included to account for the shortcomings of the waypoint model described in [12]. Each user chooses uni-formly at random a destination point (or waypoint) in the dashed rectangle inFigure 5. A user moves to this destina-tion with a velocityv, which is chosen uniformly in the inter-val (vmin,vmax 0). (Thevmin andvmax are chosen to be 0.3 m/s and 12.5 m/s, resp.) When the user reaches the way-point, it remains static for a predefined pause time, and then moves again according to the same rule. Note that user tra-jectories characterized by the improved RWP model can be assumed to be uniformly distributed at any given time.
A user with active sessions that enters the overlay of all three networks must decide when and where to execute a ver-tical handoffrequest. If the request is accepted, the appropri-ate amount of bandwidth is assigned by the serving network. If the request is denied at one network, the request can be reassigned to another network, if resources are available at the second network. If the second (or third) network is not available, the request is blocked from the system. Next, we formulate the calculation of the blocking probabilities.
4.2. Blocking probability
Each of the three networks in Figure 5 is modeled as an
M/M/1/Nnqueue system [26], whereNn is the number of available channels in Networkn.Nnis calculated:
whereBnis the total bandwidth of Networkn, andDis the average data rate of each user. The traffic load within the overlay cells isρ=λ/μ, whereλis the arrival rate of service requests,μis the departure rate, and arrivals and departures are modeled as Poisson distributions. Handoffcalls are given a higher priority than new calls, and for simplicity, a buffer-less handoffalgorithm is used.
For the blocking probability of Networkn,Pbn, we use the blocking probability of anM/M/1/Nnqueue when there areNnusers in system [26]:
whereρnis the effective load experienced by Networkn:
ρn=rnρ (9)
andrnis the percentage of total requests that will go to Net-workn, based on the vertical handoffdecision metrics. To determinern, both original handoffrequests and the hand-offrequests that arrive are included, to account for the times that the user has been rejected by another network. Since it is assumed that the users are uniformly distributed, the service request load can be calculated according to the proportion of the coverage area within the boundary region. The coverage areas are labeled inFigure 5, and the corresponding coverage, the execution of the RSS and MUSE-VDA algorithms are de-scribed inTable 1.
For the RSS-based handoffalgorithm, the values ofrnfor
n=1, 2, 3 are calculated as follows:
described inTable 1, andSBOUNDis the geometric area of the boundary region.
For the MUSE-VDA handoffalgorithm, the values ofrn
forn=1, 2, 3 are calculated:
Finally, we develop a calculation for a measure of the ser-vice obtained by each user, as compared to the serser-vices re-quested by each user. This is defined here asaverage
percent-age of users’ satisfied requests(APUSR).
4.3. Average percentage of satisfied user requests
Each user comes to the network overlay area with a certain set of requests, including various services and data rates. As mentioned previously, the ability of the network to satisfy user requests depends on whether the sessions are treated as a collective or as prioritized, individual sessions. In the col-lective MUSE-VDA and the RSS technique, all requests from one user are considered collectively. Thus, if a target network cannot satisfy all of the requests as a collective, then the user is blocked from the system. In the prioritized MUSE-VDA technique, each session is treated individually, and thus one user may have a subset of their requests satisfied, while other portions are blocked. The APUSR tracks the percentage of incoming requests that actually receive service at one of the available networks.
The APUSR is calculated for the overlay network as fol-lows:
whereARi is the APUSR for Regioni, and where the regions are described inTable 1.ARiis calculated:
ARi=
j
tijPNij, (13)
wheretijis the maximum APUSR that can be received from NetworkNij in Regioni, andP(Nij) is the probability that NetworkNijis available and chosen by a user. Finally,P(Ri) is the probability that a user is located in Regioni:
PRi=S Si
BOUND.
(14)
In the next section, we implement the performance anal-ysis and obtain results for several service request scenarios.
5. NUMERICAL RESULTS
Table1: RSS and MUSE-VDA algorithm description for 3G WLAN overlay network inFigure 5.
Region number Region area label Algorithm descriptions
1 SN3 (DEH,JFG) Network 3 provides the only coverage
2 SN3−N1N2
(HIJK) Network 3 has the strongest RSS.
RSS Algorithm: if the request is denied by Network 3, the user
can try either Network 1 or Network 2 with equal probability.
MUSE-VDA: the network order with respect to decreasing data rate is as follows:
Network 1>Network 2>Network 3.
The outcome of the cost function will be to choose Network 1, then Network 2
if Network 1 is denied, then Network 3, if Network 2 is denied.
3 SN3−N1
(DHKJGP) Network 3 has the strongest RSS.
RSS Algorithm: Network 3 is chosen first. If the request is denied by Network 3, the user tries Network 1.
MUSE-VDA: according to the decreasing data rates, the selection made by the cost function is first Network 1, then Network 3 if Network 1 is denied.
4 SN3−N2
(EHIJFS) Network 3 has the strongest RSS.
RSS Algorithm: Network 3 is chosen first. If the request is denied by Network 3, the user tries Network 2.
MUSE-VDA: according to the decreasing data rates, the selection made by the cost function is first Network 2, then Network 3 if Network 2 is denied.
5 SN1−N3
(OPQA) Network 1 has the strongest RSS.
RSS Algorithm: Network 1 is chosen first. If the request is denied by Network 1, the user tries Network 3.
MUSE-VDA: according to the decreasing data rates, the selection made by the cost function is first Network 1, then Network 3 if Network 1 is denied.
6 SN2−N3
(RSTB) Network 2 has the strongest RSS.
RSS Algorithm: Network 2 is chosen first. If the request is denied by Network 2, the user tries Network 3.
MUSE-VDA: according to the decreasing data rates, the selection made by the cost function is first Network 2, then Network 3 if Network 2 is denied.
Sbound Boundary region
Table2: System parameters.
Network (n) Network type Resource
1 WLAN 2 Mbps [27]
2 WLAN 1 Mbps [27]
3 GPRS Up to 8 slots,
21.4 Kbps per slot [27]
As mentioned previously, the random waypoint model is used to simulate user mobility, with the following param-eters:vmin = 0.3 m/s (1 km/h),vmax = 12.5 m/s (45 km/h), andvthreshold=5.5 m/s (20 km/h).
5.1. RSS-based algorithm results
First, the RSS performance is examined to provide a base-line for comparison with the MUSE-VDA results.Figure 6(a) shows the APUSR with the increasing network load for an RSS-based handoffalgorithm. Since Network 3 has the strongest transmit power, it is the preferred service provider. Thus, at the low-load range, Network 3 must satisfy a large portion of the total requests. With increasing network load, the resources of Network 3 are used up earlier than the re-sources of the other two networks. The affect is to separate the APUSR into three regions.
0
(a) Average percentage of user satisfied requests (APUSR)
0
Figure6: Performance of the RSS-based algorithm.
(2) In the second region, 1< ρ <2, GPRS begins to deny users, and the WLANs begin to receive more requests. (3) In the third region, 2< ρ, all three networks are
satu-rated and the QoS degrades for all networks.
Thus, the problem with the RSS approach is that there is no load balancing according to the service requests of the users and the available networks.
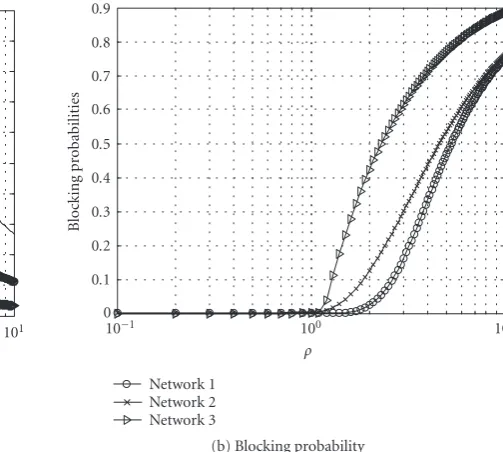
Figure 6(b) demonstrates the corresponding blocking probability of each network for the traditional RSS algo-rithm. An increase in blocking probability of Network 3 ear-lier than Networks 1 and 2 can be observed. Mobile users thus have a greater chance to select Network 1 and Network 2 as service provider. Since they have a total APUSR that is higher than Network 3 by itself, a “hump” can be observed. The result that Network 3 is chosen more often as the tar-get handoffcell leads to two unsatisfactory effects: (1) unbal-anced load assignment and (2) low overall achievable data rate. Only when the resource in Network 3 is highly con-sumed, Networks 1 and 2 will have a greater chance to be the service provider. Thus a more intelligent handoffalgorithm that can balance the usage of overlay networks is needed, and a higher overall APUSR is expected.
5.2. RSS with mobility metric
Next, we compare the RSS-only technique versus a mobility-level technique. Mobility mobility-level is a metric that can be com-bined with RSS based to improve system performance. For example, fast moving users (v > vthreshold) are selected to receive service from the largest cell, while medium-to-slow users (v < vthreshold) receive service from the small cells. Figure 7 shows the APUSR and blocking probability com-parison of the pure RSS based algorithm and the RSS-based algorithm combined with mobility level consideration. The mobility level algorithm demonstrates an improved APUSR
performance. However, its achievable APUSR is lower than that of MUSE-VDA (which will be discussed in more detail later in this section), that is, there remains a load-balancing issue for increasing requests.
We now examine the MUSE-VDA performance by con-sidering two handoffscenarios: (1) collective handoff, where all of the user’s active sessions are handed offto the same tar-get network at the same time, and (2) prioritized multinet-work handoff, where each service is prioritized and optimal decision is made individually for each session.
5.3. MUSE-VDA
The MUSE-VDA cost functions, (3) and (4), are evaluated for each network based on the following parameters:
(i) Network indexnrepresents the two WLANs and one GPRS network, as shown inTable 2.
(ii) Two constraints are considered: available bandwidth and RSS (R), where the limiting constraint for bandwidth is
Bn
s −Breq ≥ 0 for some network nand services, and the limiting RSS contraint isRn−Rth≥0.
(iii) The weights in the cost functions are normalized to 1, meaning that each service contraint is treated with equal weight.
(iv) The QoS factor is a normalized bandwidth calcula-tion, whereQnCBR, bandwidth=ln|1/BnCBR|, andQnABR, bandwidth=
ln|1/BnABR|.
(v) The target network is chosen according to the proce-dure described inTable 1.
0 0.1 0.2 0.3 0.4 0.5 0.6 0.7 0.8 0.9 1
APUSR
10 1 100 101
ρ
RSS
RSS + mobility MUSE-VDA
(a) Average percentage of user satisfied requests (APUSR)
0 0.1 0.2 0.3 0.4 0.5 0.6 0.7 0.8 0.9 1
Bloc
king
pr
obabilities
10 1 100 101
ρ
RSS
RSS + mobility
(b) Blocking probability
Figure7: Performance of the RSS-based algorithm with added mobility considerations.
0 0.1 0.2 0.3 0.4 0.5 0.6 0.7 0.8 0.9 1
APUSR
10 1 100 101
ρ
Network 1 Network 2
Network 3 Total
(a) Average percentage of user satisfied requests (APUSR)
0 0.1 0.2 0.3 0.4 0.5 0.6 0.7 0.8 0.9
Bloc
king
pr
obabilities
10 1 100 101
ρ
Network 1 Network 2 Network 3
(b) Blocking probability
Figure8: Performance of the MUSE-VDA algorithm.
mobile users, depending on their location. Thus, at the low-load range, Network 1 and Network 2 satisfy the most por-tion of the total request. With the increasing network load, the resource of Network 1 and Network 2 is consumed ear-lier than the resources of Network 3. Then mobile users start to select Network 3 more frequently than in low-load range. The portion of requests satisfied by Network 3 thus starts to increase when the portion satisfied by Network 1 and Net-work 2 decreases. In this case, there are only two regions rep-resented in the figure.
(1) In the first region, 0.1 < ρ < 1, most of the requests go to the WLANs, which are able to handle the higher data rate requests.
(2) In the second region, 1 < ρ, WLANs begin to deny users, and the GPRS provides a useful alternative. All three networks are being utilized and the performance degrades gradually.
0.2 0.3 0.4 0.5 0.6 0.7 0.8 0.9 1
APUSR
0 0.1 0.2 0.3 0.4 0.5 0.6 0.7 0.8 CBR (kbps)
RSS
Collective MUSE-VDA Prioritized MUSE-VDA
Figure9: APUSR with varying CBR data rate requests.
Figure 8(b) demonstrates the corresponding blocking probability of each network. An increase in blocking prob-ability of Networks 1 and 2 earlier than Network 3 can be observed, which indicates that WLANs are favorite networks due to their relative larger available bandwidth to each user.
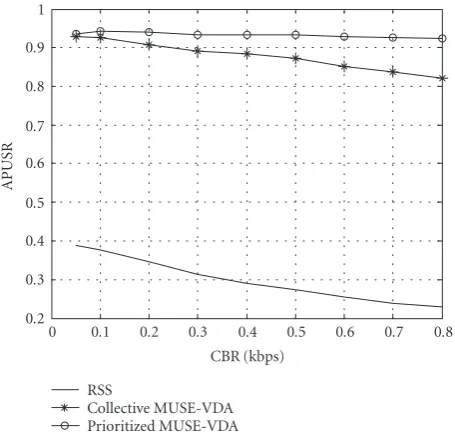
5.4. MUSE-VDA results for more demanding CBR services
In future wireless networks, users may request much higher CBR service rates, as video and audio conferencing and other real-time services become prevalent. Thus, the next set of simulations study the impact of increasing the request of CBR services. Results are now presented for APUSR and blocking probability for three cases: the traditional handoff protocol based on the strongest RSS, the cost function with collective handoff, and the cost function with the prioritized handoff.Figure 9shows APUSR versus CBR (per user) with zero blocking rates for all three algorithms. Here, each user may request variable CBR and up to 1 Mbps ABR services. The figure demonstrates that APUSR decreases with an in-crease in CBR request for all three algorithms. However, as each user’s request increases, the ability of the large net-work to support the variable data rate decreases more dra-matically. By optimally spreading user’s services over several networks using the prioritized MUSE-VDA technique, more bandwidth can be assigned to ABR services, which results in a higher overall APUSR per user.
Figure 10 shows APUSR and blocking probability ver-sus user requests for the three handoff algorithms for the more demanding CBR requests. In this case, Network 3 is eliminated in RSS-based and collective MUSE-VDA handoff algorithms, due to its limited data rate per user (less than 170 kbps). Thus, users will only be able to choose between Networks 1 and 2. This increases the APUSR in RSS-based algorithm in light traffic (ρ <1 inFigure 10(b)), since users
0 0.1 0.2 0.3 0.4 0.5 0.6 0.7 0.8 0.9 1
APUSR
10 1 100 101
ρ
RSS
Collective MUSE-VDA Prioritized MUSE-VDA
(a) Average percentage of user satisfied requests (APUSR)
0 0.1 0.2 0.3 0.4 0.5 0.6 0.7 0.8 0.9 1
Bloc
king
pr
obabilities
10 1 100 101
ρ
RSS
Collective MUSE-VDA Prioritized MUSE-VDA
(b) Blocking probability
Figure 10: MUSE-VDA performance for more demanding CBR
data rate requests.
6. CONCLUSION
Expanding services through the use and coordination of di-verse networks creates the challenge of developing a more complex, adaptive, and intelligent vertical handoffprotocol. In this paper, MUSE-VDA has been developed to maximize the benefit of the handofffor both the user and the network. The optimizations incorporate a network elimination feature to reduce the delay and processing required in the evaluation of the cost function, and a multinetwork optimization is in-troduced to improve APUSR for mobile terminals with mul-tiple active sessions. A performance analysis demonstrated significant gains in the ability to satisfy user’s requests for multiple simultaneous services and a more efficient use of resources from the proposed optimizations.
In this treatment, a “proof-of-concept” has been pro-vided based on the ability of a user or network to choose among different network types, based on different service re-quirements. Future work is ongoing to look at a more com-plex treatment, including the study of optimal and reason-able weight selection, QoS factor normalizations, and policy decision point architecture implementations.
REFERENCES
[1] I. F. Akyildiz, J. McNair, J. S. Ho, H. Uzunalio˘glu, and W. Wang, “Mobility management in next-generation wireless sys-tems,”Proceedings of the IEEE, vol. 87, no. 8, pp. 1347–1384, 1999.
[2] K. Pahlavan, P. Krishnamurthy, A. Hatami, et al., “Handoffin hybrid mobile data networks,”IEEE Personal Communications, vol. 7, no. 2, pp. 34–47, 2000.
[3] J. McNair and F. Zhu, “Vertical handoffs in fourth-generation multinetwork environments,”IEEE Wireless Communications, vol. 11, no. 3, pp. 8–15, 2004.
[4] W. Wu, N. Banerjee, K. Basu, and S. K. Das, “SIP-based vertical handoffbetween WWANs and WLANs,”IEEE Wireless Com-munications, vol. 12, no. 3, pp. 66–72, 2005.
[5] H. Badis and K. Al-Agha, “Fast and efficient vertical handoffs in wireless overlay networks,” inProceedings of IEEE Interna-tional Symposium on Personal, Indoor and Mobile Radio Com-munications (PIMRC ’04), vol. 3, pp. 1968–1972, Barcelona, Spain, September 2004.
[6] J. Tourrilhes and C. Carter, “P-Handoff: a protocol for fine-grained peer-to-peer vertical handoff,” in Proceedings of the 13th IEEE International Symposium on Personal, Indoor, and Mobile Radio Communications (PIMRC ’02), vol. 2, pp. 966– 971, Lisbon, Portugal, September 2002.
[7] M. Bernaschi, F. Cacace, and G. Iannello, “Vertical hand-offperformance in heterogeneous networks,” inProceedings of IEEE International Conference on Parallel Processing (ICPP ’04), pp. 100–107, Montreal, Quebec, Canada, August 2004. [8] H. Huang and J. Cai, “Improving TCP performance during
soft vertical handoff,” inProceedings of the 19th IEEE Inter-national Conference on Advanced Information Networking and Applications (AINA ’05), vol. 2, pp. 329–332, Taipei, Taiwan, March 2005.
[9] S.-E. Kim and J. A. Copeland, “TCP for seamless verti-cal handoff in hybrid mobile data networks,” in Proceed-ings of IEEE Global Telecommunications Conference (GLOBE-COM ’03), vol. 2, pp. 661–665, San Francisco, Calif, USA, De-cember 2003.
[10] M. Salamah, F. Tansu, and N. Khalil, “Buffering requirements for lossless vertical handoffs in wireless overlay networks,” inProceedings of 57th IEEE Semiannual Vehicular Technology Conference (VTC ’03), vol. 3, pp. 1984–1987, Jeju, South Ko-rea, April 2003.
[11] Q. Zhang, C. Guo, Z. Guo, and W. Zhu, “Efficient mobil-ity management for vertical handoff between WWAN and WLAN,”IEEE Communications Magazine, vol. 41, no. 11, pp. 102–108, 2003.
[12] M. Ylianttila, M. Pande, J. Makela, and P. Mahonen, “Opti-mization scheme for mobile users performing vertical hand-offs between IEEE 802.11 and GPRS/EDGE networks,” in
Proceedings of IEEE Global Telecommunications Conference (GLOBECOM ’01), vol. 6, pp. 3439–3443, San Antonio, Tex, USA, November 2001.
[13] M. Ylianttila, J. Makela, and P. Mahonen, “Supporting re-source allocation with vertical handoffs in multiple radio net-work environment,” inProceedings of the 13th IEEE Interna-tional Symposium on Personal, Indoor, and Mobile Radio Com-munications (PIMRC ’02), vol. 1, pp. 64–68, Lisbon, Portugal, September 2002.
[14] S. Sharma, I. Baek, Y. Dodia, and T. Chiueh, “OmniCon: a mobile IP-based vertical handoffsystem for wireless LAN and GPRS links,” inProceedings of IEEE International Conference on Parallel Processing (ICPP ’04), pp. 330–337, Montreal, Quebec, Canada, August 2004.
[15] M. Nam, N. Choi, Y. Seok, and Y. Choi, “Wise: energy-efficient interface selection on vertical handoffbetween 3G networks and WLANs,” in Proceedings of the 15th IEEE International Symposium on Personal, Indoor and Mobile Radio Communi-cations (PIMRC ’04), vol. 1, pp. 692–698, Barcelona, Spain, September 2004.
[16] S. Jung, D.-H. Cho, and O. Song, “QoS based vertical hand-offmethod between UMTS systems and wireless LAN net-works,” inProceedings of 60th IEEE Semiannual Vehicular Tech-nology Conference (VTC ’04), vol. 6, pp. 4451–4455, Los Ange-les, Calif, USA, September 2004.
[17] J. M. Holtzman and A. Sampath, “Adaptive averaging method-ology for handoffs in cellular systems,”IEEE Transactions on Vehicular Technology, vol. 44, no. 1, pp. 59–66, 1995.
[18] A. Mehbodniya and J. Chitizadeh, “An intelligent vertical handoffalgorithm for next generation wireless networks,” in
Proceedings of the 2nd IEEE/IFIP International Conference on Wireless and Optical Communications Networks (WOCN ’05), pp. 244–249, Dubai, UAE, March 2005.
[19] A. Hasswa, N. Nasser, and H. Hassanein, “Generic vertical handoff decision function for heterogeneous wireless net-works,” inProceedings of the 2nd IEEE/IFIP International Con-ference on Wireless and Optical Communications Networks (WOCN ’05), pp. 239–243, Dubai, UAE, March 2005. [20] W.-T. Chen and Y.-Y. Shu, “Active application oriented vertical
handoffin next-generation wireless networks,” inProceedings of IEEE Wireless Communications and Networking Conference (WCNC ’05), vol. 3, pp. 1383–1388, New Orleans, La, USA, March 2005.
[21] H. J. Wang, R. H. Katz, and J. Giese, “Policy-enabled hand-offs across heterogeneous wireless networks,” inProceedings of the 2nd IEEE Workshop on Mobile Computing Systems and Ap-plications (WMCSA ’99), pp. 51–60, New Orleans, La, USA, February 1999.
Distributed Systems (ICPADS ’04), vol. 10, pp. 541–548, New-port Beach, Calif, USA, July 2004.
[23] F. Zhu and J. McNair, “Optimizations for vertical handoff deci-sion algorithms,” inProceedings of IEEE Wireless Communica-tions and Networking Conference (WCNC ’04), vol. 2, pp. 867– 872, Atlanta, Ga, USA, March 2004.
[24] R. Yavatakar, D. Pendarakis, and R. Guerin, A Framework for Policy-Based Admission Control, Internet Engineering Task Force, February 2006,http://www.ietf.org.
[25] D. B. Johnson and D. A. Maltz,Dynamic Source Routing in Ad Hoc Wireless Networks, Kluwer Academic, Norwell, Mass, USA, 1996.
[26] D. Bertsekas and R. Gallager,Data Networks, Prentice Hall, En-glewood Cliffs, NJ, USA, 1991.
[27] K. Pahlavan and P. Krishnamurthy,Principles of Wireless Net-works, Prentice Hall, Upper Saddle River, NJ, USA, 2002.
Fang Zhu received the B.S. degree from Beijing University of Posts and Telecom-munications, Beijing, China, in 1999, the M.S. degree from Colorado State Univer-sity, Fort Collins, Colorado, in 2002, and the Ph.D. degree from University of Florida, Gainesville, Fla, in 2005. She is currently with Verizon as a Software Systems Archi-tect. Her research interests include mobil-ity management, qualmobil-ity of service, and
re-source management for the next generation wireless systems.
Janise McNairholds the B.S. degree and the M.S. degree in electrical engineering from the University of Texas at Austin (1991 and 1993, resp.), and the Ph.D. degree in elec-trical and computer engineering from the Georgia Institute of Technology, Atlanta, Georgia, USA (2000). She is currently an Assistant Professor in the Department of Electrical and Computer Engineering at the University of Florida. She is a Member of