Int. J. Electrochem. Sci., 13 (2018) 6347 – 6357, doi: 10.20964/2018.07.61
International Journal of
ELECTROCHEMICAL
SCIENCE
www.electrochemsci.org
Screen Graphene-printed Electrode for Trace Cadmium
Detection in Rice Samples Combing with Portable Potentiostat
Yuanjie Teng*,Yuchao Zhang, Kai Zhou, Zhengxiang Yu
State Key Laboratory Breeding Base of Green Chemistry-Synthesis Technology, College of Chemical Engineering, Zhejiang University of Technology, Hangzhou 310014, Zhejiang Province, P. R. China
*
E-mail: [email protected]
Received: 7 March 2018 / Accepted: 8 May 2018 / Published: 5 June 2018
A disposable screen graphene-printed electrode (SGPE) was developed by directly printing the prepared graphene paste on the surface of screen-printed carbon working electrode, and a differential pulse stripping voltammetry (DPV) method combing with portable potensiostat were introduced to the rapid detection of trace Cd2+ in rice samples. The surface morphology of SGPE was characterized by scanning electron microscope, and the graphene structure and its electrochemical activity were confirmed by Raman spectroscopy and cyclic voltammetry. Results showed that SGPE presents better conductivity than screen-printed carbon electrode or glass carbon electrode. The pre-concentration potential and time were optimized as -1.5 V and 500 s. And a pH 8.2 basic buffer was selected because OH- did not pose an interference (Ksp of Cd(OH)2 =2.5×10⁻¹⁴) and show a good stripping current signal.
The obtained results from portable potentiostat were similar to the results obtained by inductively coupled plasma mass spectrometry (ICP-MS). Therefore, the proposed SGPE and its effectively analytical method could be further improved for the realization of an ideally rapid on-site detector for trace Cd2+ detection in rice samples.
Keywords: screen graphene-printed electrode; cadmium; portable potentiostat;differential pulse stripping voltammetry;rice samples
1. INTRODUCTION
in China. However, these methods suffer from serious matrix interference, and remaining methods usually require professionals and complex pre-treatment process; thus, they cannot realize rapidly on-site detection[7-9] and cannot satisfied with the huge amount of samples' requirement.
By contrast, electroanalytical methods including polarography and stripping voltammetry[10], require significantly less expensive equipments which also can be simplified to ensure portability for trace heavy metal detection because of their rapid and on-site detection features. Nowadays, commercial heavy metal ion analyzers[11] have been introduced to the market. However, a large sample amounts and complex electrode modification were required because the detection usually need column electrodes(e.g., dropping mercury electrode[12], glass carbon electrode[13],diamond electrode[14]) which were mostly modified by polymers[15-17], nano-materials[13,18], ion liquids[19-20] to improve the conductive performances of the basic electrodes.
In this study, screen-printed carbon electrodes(SPCEs), which are mainly used in blood glucose meters[21-22], were introduced in the proposed detection system because of its once-used and costless advantages. Also, commercially used graphene was introduced because it has been widely reported as a good conductor. However, the graphene was mostly modified on the surface of electrode by simply mixed with nanoparticles, polymers, ion liquids[23-25]. Herein, the prepared graphene pastes, which were directly printed on the surfaces of carbon working electrodes of SPCEs, can provide good conductivity because of immobilized organized sp2 graphite. Also, it has the advantage of mass production and good repeatability. In this study, the development of SGPEs was proved useful for Cd2+ detection without bismuth or mercury film pre-concentration[1, 26-28]
Moreover, the development of analytical instruments is moving towards to a specialized market; thus, specialized instruments with reduced size because of the development of Micro Electro Mechanical System (MEMS) technology[29] are designed for specialized detection. In this paper, the Cd2+ detection method was successfully applied to a portable potentiostat, which could be further developed into a specialized detector for Cd2+ detection in rice.
2. EXPERIMENTAL
2.1. Materials and Reagents
Graphene was purchased from Suzhou Hengqiu Graphene Co.,Ltd. Standard cadmium solution (1000 mg/L, in 1.0 mol/L HNO3), tris(hydroxymethyl)aminomethane, and sodium polyacrylate
(molecular weight, ~5100) were obtained from Aladdin Industrial Corporation. CH3COOH,
CH3COONa, NaH2PO4, Na2HPO4, NaOH, KCl, NaCl, HCl, K3[Fe(CN)6] and absolute alcohol were
purchased from Sinopharm Chemical Reagent Co.,Ltd. CH3COOH–CH3COONa buffer solution (0.2
mol/L; pH 3.8,4.2, 4.6, 5.0, and 5.4), phosphorus buffer solution (0.2 mol/L; pH 5.8, 6.2, 6.6, 7.0, 7.4, 7.6, and 8.0), and tris–HCl buffer solutions (0.05 mol/L; pH 8.0, 8.2, 8.4, 8.6, and 8.8) were prepared. Cadmium stock solution (100 mg/L) and working solution with different concentrations were prepared by diluting the standard cadmium solution with 2% HNO3. All other chemical reagents used were of
water (18.2 MΩ, Hangzhou Yongjieda Purification Technology, Co., Ltd., China). Positive and negative rice samples were provided by Hangzhou Grain and Oil Detection Center.
2.2. Apparatus and Measurements
Electrochemical experiments were conducted at room temperature on a CHI 660D electrochemical workstation(CHI Instruments Inc., USA) and a portable smart phone controlled potentiostat(Xenstat, Ningbo Mxense Bio-Tech Co., Ltd.). All the electrochemical experiments were performed with the SPCE (Ningbo Mxense Bio-Tech Co., Ltd.) and SGPE, including the carbon or graphene working electrode, carbon counter electrode, and Ag/AgCl reference electrode. The buffers were used as electrolytes in all the experiments. The rice samples were digested using a microwave digestion system (Sineo Microwave Chemistry Technology. Co., Ltd.). The data of the real samples were determined and compared using an ELAN DRC-e ICP-MS(Perkin Elmer). The SEM images of SPCE and SGPE morphologies were recorded using aS-4700 SEM(HITACHI, Japan). Raman spectrum was recorded using a LabRAM HR UV 800 Laser Micro Raman Spectrometer (JOBIN YVON, France).
2.3. Preparation of SPCE, Graphene Paste and SGPE
The scheme and similar fabrication steps of SPCE were reported in our previous paper[30]. Carbon ink(Jelcon AC-3G, Jujo Chemical Co., Ltd., Japan), silver ink(BY2100, Shanghai Baoyin Electronic Materials Co., Ltd., China), Ag/AgCl ink(Cambridge Nano-Tech Limited Co., Ltd., China), and insulated ink (Acheson colloids Co., USA) were successively printed using a stencil and dried in a drier after every printing.
For the preparation of the graphene paste, 2 mL of graphene slurry and 2 mL of ultrapure water were combined into 4 mL centrifuge tube at a rotation rate of 13,000 rpm for 10 min. The supernatant was decanted, and 4 mL of water was added to the precipitate. The mixture was ultrasonically dispersed to ensure optimal dispersion. Subsequently, centrifugation was performed again. The centrifugation product was ultrasonically dispersed in 0.5 mL of pure water. Finally, graphene paste was obtained.
Then, Scheme 1 shows the fabrication procession of SGPE. The graphene paste was printed on the surface of the carbon working electrode in SPCE by squeegee blade using a screen-printed stencil with 80 mesh and circle arrays (3mm diameter). Finally, the fabricated SGPE was stored in a desiccator overnight.
2.4. Cd2+ Pre-concentration and Differential Pulse Stripping Voltammetry
solution. The smartphone controls the portable potentiostat by Bluetooth, and the SGPEs immersed in the self-fabricated electrochemical cells were connected to the portable potentiostat (Scheme 1). The SGPEs were initially pre-concentrated at a potential of -1.0, -1.1, -1.2, -1.3, -1.4, -1.5 V for 200, 300, 400, 450, 500, or 550 s , respectively, under stirring. After standing for 10 s, the electrical currents of the SGPEs were measured by differential pulse stripping voltammetry (DPV) from -1.3 V to -0.5 V and recorded.
The SGPEs were cleaned for reuse. Firstly, each SGPE was transferred to a buffer solution at a potential of 0.3 V for 120 s. Then, it was immersed into NaOH(0.1 mol/L) for 10 s and washed with ultrapure water. Cleaning was terminated when the electrical current of the Cd2+ was approximate to zero.
Scheme 1. Scheme of the fabrication of SGPE by screen-printing and DPV performed on SGPE
2.5. Rice Samples Digestion
The rice samples were digested using the microwave digestion system. Approximately 0.3~ 0.5 g of each rice samples was added into a polytetrafluoroethylene inner pot mixed with 2.5 mL of concentrated HNO3 and 2.5 mL of pure water. Then, each mixture was shaken well, sealed and placed
in the outer pot. After setting the parameters of the microwave digestion instrument, the digestion pot was placed on the rotating disc, and the system was turned on. Subsequently, the digestion pot was placed on the cooling fan after digestion. The digestion liquid should be colorless or light yellow. Then, the digestion liquid was heated until the acid was nearly saturated. Finally, the remaining digestion liquid was transferred to a 50 mL flask, into which a buffer solution was added up to a set volume.
3. RESULTS AND DISCUSSION
3.1. Characterization of SGPE
graphite material on SGPE, including the D band at 1350 cm-1, the G band at 1582 cm-1, and the 2D band at 2700 cm-1. The IG/I2D>1 and broaden 2D band show that the graphene was multilayered[31].
Also, the SGPE reveals low background signals.
The cyclic voltammograms of glass carbon electrode [figure 1D(a)], bare SPCE[figure 1D(b)], and SGPE [figure 1D(c)] in 2 mmol/L K3Fe(CN)6 at a scan rate of 0.1Vs-1 were presented. The SGPE
electrode reveals evident reduction and oxidation peaks of K3Fe(CN)6; the absolute current of SGPE is
about 2 times as large as glass carbon electrode. Furthermore, the real effective area of SGPE which was calculated by ip=269n3/2AD1/2v1/2CR* in 1M KCl, 2mM K3[Fe(CN)6] solution is about 7 times
larger than the area of SPCE. All the electrochemical results illustrate that the electrochemical behavior of SGPE is better than that of bare SPCE without electrochemical pretreatment which exhibits a weak peak on glass carbon electrode. Therefore, the good performance of SGPE contributes to the good electro activity of graphene and the roughness surface of SGPE.
Finally, the repeatability (RSD=8.53% [n=9]) of the SGPEs is further determined by comparing the reduction currents of nine different electrodes in 2 mmol/L K3Fe(CN)6.
Figure 1. SEM images of SPCE(A) and SGPE(B), Raman spectrum of SGPE(C) and cyclic voltammograms of glass carbon electrode vs Hg/HgCl2 (a), SPCE(b) and SGPE(c) vs Ag/AgCl
in 2 mmol/L K3Fe(CN)6 (D)
3.2. Effects of Pre-concentration Potential, Time, Electrolytes and pH
The Cd2+ was firstly reduced to Cd on the surface of the used sensor at negative potential. Then, the stripping curve of Cd oxidized to Cd2+ was recorded. The stripping peak intensity of Cd was affected by the detection conditions.
As shown in the cyclic voltammogram(figure 2A) of the SGPE in 2 mmol/L K3[Fe(CN)6] (0.1
mol/L KCl) from 0 to −1.8 V, the current increased sharply after −1.5 V, indicating the reduction in H+
[image:5.596.168.428.325.523.2]
time of 500 s. The electrical currents were recorded. The current increased as the potential increased. Therefore, −1.5 V was selected for the subsequent experiment.
The stripping behaviors of 5×10⁻⁶ mol/L cadmium ions at different pre-concentration times(100, 200, 300, 400, 450, 500 and 550 s) and a potential of -1.5 V were investigated(figure 2B). The electrical current sharply increased from 100 to 300 s, and then slowly increased as the pre-concentration time was increased to 550 s. Therefore, the amount of cadmium on the SGPE surface was nearly saturated beyond 500 s. Therefore, 500 s was selected for the subsequent experiment.
The peak current values of Cd2+ are strongly related to the type of buffers and their pH levels (figure 2C). Results show that the peak currents in the phosphorus buffer solutions(0.2 mol/L, pH 5.8, 6.2, 6.6, 7.0, 7.4, 7.6, and 8.0) were weaker than those of the CH3COOH–CH3COONa buffer solutions
( 0.2 mol/L, pH 3.8, 4.2, 4.6, 5.0, and 5.4) and tris–HCl buffer solutions (0.05 mol/L; pH 8.0, 8.2, 8.4, 8.6, 8.8). The basic buffer presented better current signals. The strongest current was achieved using pH 8.2 tris-HCl buffer solution. Basic buffers have been rarely used in heavy metal ions detection[32-34], because of OH- may become an interference ion in Cd2+ determination; however, in this study, the precipitate of Cd(OH)2 was not produced when the Cd2+ concentration was lower than 10-3 mol/L (Ksp
[image:6.596.101.489.369.471.2]of Cd(OH)2 = 2.5×10⁻¹⁴)[35]. Therefore, pH 8.2 was selected as the optimum pH.
Figure 2. Cyclic voltammogram of SGPE in 2 mmol/L K3[Fe(CN)6] (0.1 mol/L KCl) from 0 to -1.8 V,
insert: the relationship of pre-concentration potential and electrical current(A), the relationship of electrodeposition time(100, 200, 300, 400, 450, 500 and 550 s) and the electrical current(B), the relationship of pH and electrical current, phosphorus buffer solution (0.2 mol/L, pH 5.8, 6.2, 6.6, 7.0, 7.4, 7.6, 8.0) ; CH3COOH–CH3COONa buffer solution (0.2 mol/L, pH 3.8, 4.2, 4.6,
5.0, 5.4); Tris–HCl buffer solution (0.05 mol/L; pH 8.0, 8.2, 8.4, 8.6, 8.8)(C)
3.3. Interferences
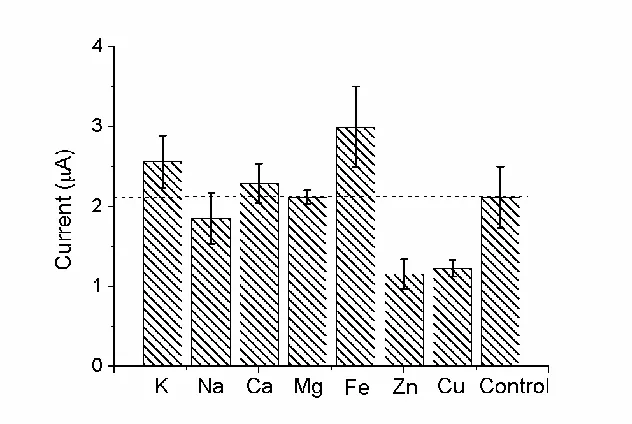
Figure 3. Peak currents of Cd2+ in the presence and absence of foreign ions (Ca2+(100 times), K+(2000 times), Na+(100 times), Mg2+(500 times), Fe3+(20 times), Zn2+(30 times), Cu2+(4 times))
3.4. Pretreatment and Recovery in Rice Samples
[image:7.596.139.455.73.285.2]Recovery experiments were conducted because of the matrix effect of the rice samples. Three standard solutions of Cd2+were added to the negative rice samples. Table 1 shows the recoveries ranging between 82.0 % and 102.0 %.
Table 1. The recovery and precision (n=6) No. Addition
value (μmol/L)
Detection value (μmol/L)
Recovery (%)
RSD (%)
1 0.100 0.082 82.0 4.68
2 0.500 0.510 102.0 5.31
3 1.000 0.985 98.5 9.54
Figure 4. The DPV curves of different concentrations of Cd2+ at CHI, insert: standard addition curves of three rice samples (n=5)
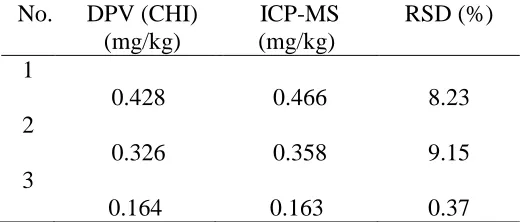
Subsequently, the Cd2+ concentrations of the three real rice samples were calculated and compared with the results obtained by ICP-MS(Table 2). The results of the two methods were similar; therefore, Cd2+ can be detected using an electrochemical workstation.
Table 2. The Cd2+ concentration in real samples by CHI comparing with ICP-MS No. DPV (CHI)
(mg/kg)
ICP-MS (mg/kg)
RSD (%) 1
0.428 0.466 8.23
2
0.326 0.358 9.15
3
0.164 0.163 0.37
3.5. Portable Potentiostat for Cd2+ Detection in Rice Samples
[image:8.596.168.431.459.570.2][image:9.596.148.438.175.377.2]
potentiostat can be further developed for accurate and rapid on-site detection. Moreover, most the reported Cd2+ detection methods were used for water samples, although lower detection limits presented (Table 4). However, the detection limit of this proposed method is 10-7 mol/L, which has satisfied the requirement of Cd2+ detection in rice and it is costless because of using portable potensiostat.
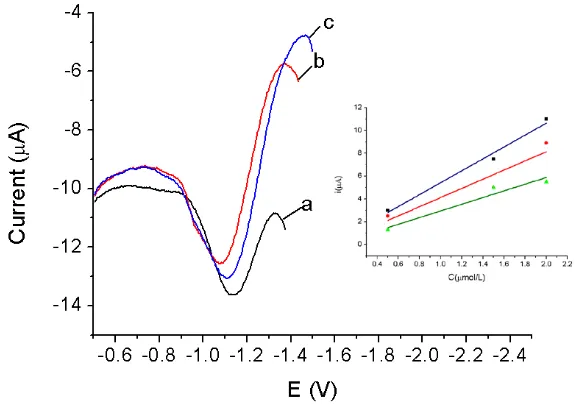
[image:9.596.158.435.463.547.2]Figure 5. The DPV curves of 0.5(a), 1.5(b) and 2 μmol/L(c) Cd2+ at Xenstat, insert: standard addition curves of three rice samples
Table 3. The Cd2+ concentration in real samples by Xenstat comparing with ICP-MS
No. DPV
(Xenstat) (mg/kg)
ICP-MS (mg/kg)
RSD (%)
1 0.551 0.466 11.86
2 0.332 0.358 5.54
[image:9.596.79.518.587.766.2]3 0.153 0.163 4.52
Table 4. Comparison of the analytical performance of Cd2+ sensors
Electrode Modifier System Limits of detection Samples Reference
GCE Polyaniline Autolab
TYPE III
2.67 × 10⁻¹⁰ mol L−1 Tap water 36
SPCE Sparked tin nanoparticles Autolab
PGSTAT12 potentiostat
0.5 µg L−1 Tap and bottled
water
37
SPCE Bismuth film/crown
ether/Nafion
eDAQ potentiostat
0.27 µg L−1 rice 1
GCE Bismuth film/1-Nitroso-2-Napthol/Nafion
CHI 660A
0.24 μg L-1
Water 38
mercury drop electrode
Hollow fiber solid phase microextraction
Metrohm Model 797
VA
GCE Mixture of
(SWCNTs/Biomass) PGSTAT Autolab
302N
10−7 mol L−1 water 39
Abbreviations: GCE, glassy carbon electrode; SPCE, screen-printed carbon electrode
4. CONCLUSIONS
A useful electrode for trace Cd2+ detection in rice samples was developed by directly screen-printing graphene pastes on the surface of SPCEs. This graphene electrode can provide good conductivity and it did not require bismuth film pre-concentration. The proposed detection method was also applied to a portable smartphone-controlled electrometer for rapid on-site detection. The results obtained by the proposed detection method were in good agreement with the results obtained by ICP-MS.
ACKNOWLEDGEMENTS
This work is financially supported by the Natural Science Foundation of Zhejiang Province (No. LQ17B050002) and Analysis and Measurement Foundation of Zhejiang Province (No. 2015C37068).
References
1. K. Keawkim, S. Chuanuwatanakul, O.Chailapakul, S.Motomizu, Food Control, 31(2013), 14. 2. H.Q.Liu, S.Q.Li, Y.Qu, H.Chen, Spectrosc. Spect. Anal., 32(2012), 541.
3. Q.Y.Ye, Y.Li, Y.Jiang, X.P.Yan, J Agr. Food Chem., 51(2003), 2111. 4. H.M.Yu, X.Ai, K.L.Xu, C.B.Zheng, X.D.Hou, Analyst, 141(2016),1512.
5. Y.N.Wu, R.He,; Z.G.Wang, J. Yuan, C.R.Xing, L.F.Wang, X.R.Ju , Anal. Methods, 8(2016), 6313.
6. Z.Es'haghi,M. Khalili, A.Khazaeifar, G.H.Rounaghi, Electrochim. Acta., 56(2011), 3139. 7. F.Long, A.Zhu, H.C.Shi, H.C.Wang, J.Q. Liu, Sci. Rep., 3(2013), 1.
8. D.Li, D. W. Li, J.S.Fossey, Y.T. Long, Anal. Chem., 82(2010), 9299.
9. J.R.Fang, X.X.Qiu, Z.J.Wan, Q.C.Zou, K.Q.Su, N.Hu, Anal. Methods, 8(2016), 6895. 10. G.Herzog, V. Beni, Anal. Chim. Acta., 769(2013), 10.
11. V.Beni, V.I.Ogurtsov, N.V.Bakunin, D.W.M.Arrigan, M.Hill, Anal. Chim. Acta., 552(2005), 190. 12. L.M.de Carvalho, P.C.do Nasciniento, A.Koschinsky, M.Bau, R.F.Stefanello, C.Spengler,
D.Bohrer, C. Jost, Electroanalysis, 19(2007), 1719.
13. H.Lin, M.X.Li, D.Mihailovic , Electrochim. Acta., 154(2015), 184.
14. A.Sugitani, T.Watanabe, T.A.Ivandini, T.Iguchi, Y.Einaga, Phys. Chem. Chem. Phys., 15(2013), 142.
15. L.Tang, J. Chen, G. Zeng, Y.Zhu, Y. Zhang, Y.Zhou, X.Xie, G.Yang, S.Zhang, Electroanalysis, 26(2014), 2283.
16. M.B.Gholivand, A.Azadbakht, A.Pashabadi, Electroanalysis, 23(2011), 364.
17. N.Promphet, P.Rattanarat, R.Rangkupan, O.Chailapakul, N.Rodthongkum, Sens. Actuators, B: Chem., 207(2015), 526.
18. M.A.Chamjangali, H. Kouhestani, F.Masdarolomoor, H.Daneshinejad, Sens. Actuators, B: Chem., 216(2015), 384.
20. M.Yang, T.J.Jiang, Z.Guo, J.H.Liu, Y.F.Sun, X.Chen, X.J.Huang, Sens. Actuators, B: Chem., 240(2017), 887.
21. Z.Taleat, A.Khoshroo, M.Mazloum-Ardakani, Microchim. Acta., 181(2014), 865.
22. J.Barton, M.B.G.Garcia, D.H.Santos, P.Fanjul-Bolado, A.Ribotti, M.McCaul, D.Diamond, P.Magni, Microchim. Acta., 183(2016), 503.
23. S.Cinti, F.Arduini, Biosens. Bioelectron., 89(2017), 107.
24. W.K.Chee, H.N.Lim, N.M.Huang, I.Harrison, Rsc Adv., 5(2015), 68014.
25. Z.Y.Yang, N.N.Dai, R.T.Lu, Z.H.Huang, F.Y.Kang, New Carbon Mater., 30(2015), 511. 26. B.Z.Liu, L.Y.Lu, M.Wang, Y.Q.Zi, Electroanalysis, 20(2008), 2363.
27. G.Chen, X.Hao, B.L. Li, H.Q.Luo, N.B.Li, Sens. Actuators, B: Chem., 237(2016), 570. 28. G.Zhao, H.Wang, G.Liu, Z.Q.Wang, Sens. Actuators, B: Chem., 235(2016), 67.
29. M.Kitajima, N.Wang, M.Q.X.Tay, J.M.Miao, A.J.Whittle, Micro Nano Lett., 11(2016), 582. 30. Y.J.Teng, C.Chen, C.X.Zhou, H.L.Zhao, M.B.Lan, Sci. China Chem. , 53(2010), 2581.
31. J.X.Wu, H.Xu,J.Zhang, Acta Chim.Sinica, 73(2014),301.
32. E.Nagles, V.Arancibia, R.Rios, Int. J Electrochem. Sc., 7(2012),4545.
33. L.Baldrianova, P.Agrafiotou, I.Svancara, A.D.Jannakoudakis, S.Sotiropoulos, J Electroanal. Chem, 660(2011), 31.
34. S.Abbasi, K.Khodarahmiyan, F.Abbasi, Food Chem., 128(2011), 254.
35. J. A. Dean, Lange's Handbook of Chemistry. McGraw-Hill Professional Publishing, 1998.
36. G.D. Zhu, Y.X.Ge, Y.Dai, X.H.Shang, J.M. Yang, J.Y. Liu, Electrochimica Acta, 268(2018),202. 37. M.G.Trachioti,J.Hrbac, M.I. Prodromidis, Sens. Actuators, B: Chem., 260(2018), 1076.
38.R.A. Segura, J.A. Pizarro, M.P. Oyarzun, Int. J. Electrochem. Sci., 11 (2016) 1707. 39.M. Dali, K. Zinoubi, A. Chrouda, J. Electroanal. Chem., 813(2018), 9.

![Figure 2. Cyclic voltammogram of SGPE in 2 mmol/L K3[Fe(CN)6] (0.1 mol/L KCl) from 0 to -1.8 V, insert: the relationship of pre-concentration potential and electrical current(A), the relationship of electrodeposition time(100, 200, 300, 400, 450, 500 and 550 s) and the electrical current(B), the relationship of pH and electrical current, phosphorus buffer solution (0.2 mol/L, pH 5.8, 6.2, 6.6, 7.0, 7.4, 7.6, 8.0) ; CH3COOH–CH3COONa buffer solution (0.2 mol/L, pH 3.8, 4.2, 4.6, 5.0, 5.4); Tris–HCl buffer solution (0.05 mol/L; pH 8.0, 8.2, 8.4, 8.6, 8.8)(C)](https://thumb-us.123doks.com/thumbv2/123dok_us/1790155.133424/6.596.101.489.369.471/voltammogram-relationship-concentration-relationship-electrodeposition-electrical-relationship-phosphorus.webp)