This is a repository copy of
Comparison of Spatial and Temporal Averaging on Ultrafast
Imaging in Presence of Quantization Errors
.
White Rose Research Online URL for this paper:
http://eprints.whiterose.ac.uk/101043/
Version: Accepted Version
Proceedings Paper:
Moubark, AM, Alomari, Z, Harput, S orcid.org/0000-0003-0491-4064 et al. (1 more author)
(2015) Comparison of Spatial and Temporal Averaging on Ultrafast Imaging in Presence of
Quantization Errors. In: 2015 IEEE International Ultrasonics Symposium (IUS). , 21-24 Oct
2015, Taipei, Taiwan. IEEE . ISBN 978-1-4799-8182-3
https://doi.org/10.1109/ULTSYM.2015.0311
(c) 2015, IEEE. Personal use of this material is permitted. Permission from IEEE must be
obtained for all other uses, in any current or future media, including reprinting/republishing
this material for advertising or promotional purposes, creating new collective works, for
resale or redistribution to servers or lists, or reuse of any copyrighted component of this
work in other works.
[email protected] https://eprints.whiterose.ac.uk/
Reuse
Unless indicated otherwise, fulltext items are protected by copyright with all rights reserved. The copyright exception in section 29 of the Copyright, Designs and Patents Act 1988 allows the making of a single copy solely for the purpose of non-commercial research or private study within the limits of fair dealing. The publisher or other rights-holder may allow further reproduction and re-use of this version - refer to the White Rose Research Online record for this item. Where records identify the publisher as the copyright holder, users can verify any specific terms of use on the publisher’s website.
Takedown
If you consider content in White Rose Research Online to be in breach of UK law, please notify us by
Comparison of Spatial and Temporal Averaging on
Ultrafast Imaging in Presence of Quantization Errors
Asraf Mohamed Moubark, Zainab Alomari, Sevan Harput, and Steven Freear
Ultrasound Group, School of Electronic and Electrical Engineering, University of Leeds, UK.E-mail: [email protected] and [email protected]
Abstract—In compound plane wave imaging (CPWI), multiple plane waves are used to insonify the imaging region with different steering angles. The compounding operation is effectively a spatial averaging filter that reduces the speckles of the image and increases the image contrast and its lateral resolution. Although spatial averaging often improves CPWI image quality, quantization errors which dependent on sampling frequency and element spacing (pitch), introduced during beam steering reduce this improvement. In this study, the effect of spatial and temporal averaging on speckle noise reduction, contrast resolution and spatial resolution in ultrafast ultrasound imaging is evaluated. The overall results from the simulations shows that the maximum effect of quantization errors on speckle noise is 0.18 dB, on the image contrast is 0.27 dB, on axial resolution is 2.38% and finally on lateral resolution is 1.44%. On the other hand, plane wave imaging (PWI) employing temporal averaging technique which is not bound with quantization errors relatively produces high contrast to noise ratio (CNR) and speckle signal to noise ratio (SSNR) at 40 MHz for both centre frequency compared to CPWI.
I. INTRODUCTION
The two main modalities in ultrafast imaging are PWI and CPWI. In plane wave imaging, all the transducer elements are excited simultaneously without any focusing or steering delay. The created planar wave fronts will insonfy the whole imaging area at once to create an image frame. There is a significant drawback in plane wave imaging which is the drop in image quality. The reason behind this downside in PWI is because the lack of transmit focusing. Thus, to improve the quality image without sacrificing the high frame rate too much, compound plane wave imaging was introduced.
Image compounding is the process of addition of several image frames into a single composite image in an attempt to reduce speckle noise, hence improving the visual quality for better diagnosis [1] [2]. As for CPWI, multiple plane waves are insonified with different steering angles in sequence, and the received signal is compounded coherently or incoherently to produce a high quality image [3] [4]. The time delay, τn
associated to each element for steering the plane wave at an angle β is given by
τn= dnsinβ
c (1)
Where n is number of elements in the transducer, d is the distance between adjacent elements, also known as pitch and c is average speed of sound in tissue. Even though the compounding process can improve the image quality, when
the plane wave is steered to any value of angle other than zero, quantization starts to appear on the wave front of the emitted field. The quantization effect is tightly related to minimum achievable time step, which is a function of the sampling frequency.
II. QUANTIZATIONERRORS
The ideal steered plane wave should be smooth curves, but in the real world it is unrealisable, mainly due to the limitation of the discrete elements. Delay profiles calculated using (1) for any steering angle will be rounded or quantized to a minimum discrete time interval results in rounding errors. The difference between theoretical delay profiles and quantized is known as phase quantization errors, or just as quantization errors [5]. The quantization errors for each elements,τeis given by
τe=|τn−τs| (2) τs=
kτnfsk fs
(3) Where fs is sampling frequency, τn is simulation time
delay andτsis quantized or rounded time delay for a certain
desired steering angles. A number of papers have discussed the quantization error problem which arises in PAI. Studies conducted by [6] and [7] mentioned that the quantization errors can cause side lobes to start to appear and can reduce the dynamic range of imaging. Meanwhile, [7] and [8] have analysed the effect of quantization errors on image dynamic range and mention the presence of grating lobes at critical angles. In another study conducted by [8], it is suggested that to decrease the quantization error effect, phase lock loops (PLL) can be used to increase the sampling frequency clock and thereby reduce the minimum time delay profile. Even though a significant number of papers have reported the presence and degradation caused by quantization errors, none of them have conducted studies on rounding errors or measured the performance of the final image quality produced. At the same time, all previous quantization error effect studies have been focused on PAI and not on CPWI. Thus this study has been carried out on CPWI image quality by measuring SSNR, CNR and its spatial resolution when the quantization errors are present in spatial or angular compounding.
The idea was to obtained independent RF signal without introducing quantization errors on the wave front. The same simulation setups as in Table II have been used in determining the performance of temporal averaging technique.
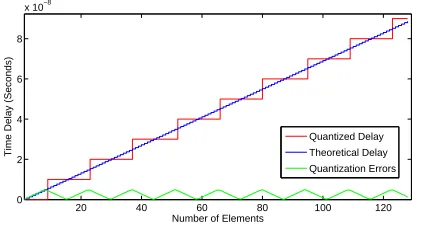
The errors present in steered plane wave can be classed as correlated or periodic errors since the errors occur periodically across an aperture as shown in Fig. 1 . This Correlated errors occurs as a result of the beams being steered with a linear delay profile as described by (1). An 128 element transducer with a steering angle of0.2, a sampling frequency of 100 MHz and a centre frequency of 5 MHz, was realised in simulation. In Fig. 1, theoretical and quantized delay calculated for said probe is shown. The error present between both delays is also shown. The errors is sinusoidal.
20 40 60 80 100 120
0 2 4 6 8
x 10−8
Number of Elements
Time Delay (Seconds)
[image:3.612.70.281.238.352.2]Quantized Delay Theoretical Delay Quantization Errors
Fig. 1. Quantized and Ideal delay profile for steering angles of0.2.
III. SIMULATION ANDPERFORMANCEEVALUATION
In order to study the effect of quantization errors on CPWI, two different simulations have been carried out. The first was to determine the steering angle which will cause maximum quantization error. The second was to use the steering angles calculated in first simulation to quantify the image quality on cyst and wires phantoms.
A. Steering Angle for maximum quantization errors
In this simulation, equation (2) and (3) has been used to calculate the time delay differences or quantization errors between theoretical and quantized setup for steering angles from−45to+45. The simulation setup is shown in Table II. The quantization errors produced for a sampling frequency of 100 MHz and centre frequency of 5 MHz is shown in Fig. 2. It can be seen that the maximum quantization errors occurring just after and before zero quantization errors occurs and continues to appear periodically for every n/fs where n
is integer. In order to study the effect of quantization errors efficiently, the first maximum quantization error to appear is ignored since the steering angles is too small and near to the normal. If a small steering angle near to zero is used for compounding, the chances of producing a low quality image are high, as in PWI. Thus in this studies, the second angles which produced maximum quantization errors has been chosen. Meanwhile others cases are shown in Table I.
TABLE I
STEERINGANGLES FORMAXIMUMQUANTIZATIONERRORS
fo, MHz fs, MHz
40 100 160
5 7.141◦ 2.845◦ 1.781◦
7 10.020◦ 3.992◦ 2.494◦
−3 −2 −1 0 1 2 3
0 0.5 1 1.5 2 2.5
3x 10
−7
Angles (Degree)
Time (Seconds)
Fig. 2. Total time difference between Quantized and theoretical delay profile for a sampling frequency of 100 MHz and a centre frequency of 5MHz.
B. Determining the image quality
In this second simulation, CPWI simulations has been performed with MATLAB using Field II [9] with parameters given in Table II.
TABLE II
STEERINGANGLES FORMAXIMUMQUANTIZATIONERRORS
Parameters Values Sampling Frequencies, MHz 40, 100, 160 Centre Frequencies, MHz 5, 7
Bandwidth 60 %
No. of Elements 128
Elements Spacing λ
A single image was formed by compounding three different plane waves steered at angles calculated in Table I. Three phantom cysts with a diameter of 5 mm and three wire phantoms located separately at 30, 40 and 50 mm depth from the transducer face are simulated. A total amount of 50000 scattering has been used in the simulation to achieve equal amount of scattering distribution throughout the ROI. To evaluate the effect of quantization errors, SSNR, CNR and spatial resolution of the images were computed. The SSNR is used to determine the speckle pattern formation on the image. Speckle is a granular texture which corresponds to the constructive and destructive interference of echoes received from scatters [10]. Speckle noise measured with SSNR values on the region of interest (ROI) as given by
SSNR(dB)= 20log10( µROI σROI
) (4)
Where µROI, is the mean and σROI, is the standard
is used to expresses the detectability of the object contrast between ROI inside the cyst and its background.
CNR(dB)= 20log10(
|µROI−µBack|
p
(σROI2+σBack2)/2
) (5)
To measure the SSNR and CNR of the cysts at different depth on the image produced, 2 different regions with same dimension of 4 mm x 4 mm have been selected for each measurement. The first ROI is inside the cyst while the other ROI is located outside the cyst at the same depth. This is to ensure that the attenuation caused by frequency doesn’t affect the measurements. The SSNR was measured at the highlighted regions R2, R4 and R6 as shown in Fig.3. While the CNR was measured between regions R1 and R2, R3 and R4, and R5 and R6. Meanwhile, in order to measure the spatial resolution of the wire phantoms, a full width half maximum technique (FWHM), -6 dB has been employed [11].
R9
R5 R6
R8 R4 R3
R7
R1 R2
Lateral Distance (mm)
A
x
ial Dista
n
ce
(m
m
)
-5 0 5
25
30
35
40
45
50
55 -50
-45 -40 -35 -30 -25 -20 -15 -10 -5 0
R3
R7
R1 R2
R8 R4
R9
R5 R6
Fig. 3. Geometry of the cyst (anechoic) with wire phantoms. The highlighted regions were used to measure the performance.
IV. RESULT
Results calculated for CPWI and PWI by using equation (4) and (5) for CNR and SSNR are represented in graphical form in Fig. 4. The CNR values for centre frequency of 5 and 7 MHz with sampling frequency of 40, 100 and 160 MHz are shown in Fig. 4(a), (b) and (c). Only at sampling frequency of 40 MHz there are significant different in CNR values between ideal and quantized delay from 30 to 50 mm for both centre frequency. Difference in CNR values between both delays for centre frequency of 5 MHz at 30, 40 and 50 mm are 0.04, 0.27 and 0.08 dB. As for centre frequency of 7 MHz through out the same depth the difference in CNR between the two delays are 0.09, 0.20 and 0.03 dB. When the sampling frequency increases to 100 and 160 MHz from 40 MHz, the are no significant changes in CNR for both delays. The SSNR values for centre frequency of 5 and 7 MHz with
sampling frequency of 40, 100 and 160 MHz are shown in Fig. 4(d), (e) and (f). The significant differences in SSNR values becomes visible at sampling frequency of 40 MHz. Difference in SSNR values between both delays for centre frequency of 5 MHz at 30, 40 and 50 mm are 0.04, 0.08 and 0.06 dB. As for centre frequency of 7 MHz through out the same depth the difference in SSNR for both delays are 0.09, 0.18 and 0.01 dB. There are no significant changes in SSNR values between ideal and quantized delays for sampling frequency 100 and 160 MHz. Although quantization errors inherited in CPWI and not on PWI, but the results for high sampling frequency (100 and 160 MHz) are still in favour of CPWI.
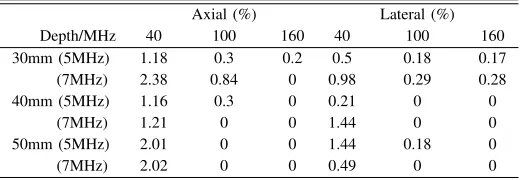
Differences in axial and lateral resolution between ideal and quantized delays in the highlighted region R7, R8 and R9 in Fig.3 for sampling frequency of 40, 100 and 160 MHz and centre frequency of 5 and 7 MHz is presented in Table III. It clearly shows that the percentage difference between the two delays become smaller as the sampling frequency increases from 40 to 160 MHz.
TABLE III
DIFFERENCE IN AXIAL AND LATERALRESOLUTION BETWEEN IDEAL AND
QUANTIZED DELAYS
Axial (%) Lateral (%)
Depth/MHz 40 100 160 40 100 160
30mm (5MHz) 1.18 0.3 0.2 0.5 0.18 0.17
(7MHz) 2.38 0.84 0 0.98 0.29 0.28
40mm (5MHz) 1.16 0.3 0 0.21 0 0
(7MHz) 1.21 0 0 1.44 0 0
50mm (5MHz) 2.01 0 0 1.44 0.18 0
(7MHz) 2.02 0 0 0.49 0 0
V. DISCUSSION
[image:4.612.312.572.331.421.2]30 35 40 45 50 0
2 4 6 8
CNR (dB)
40 MHz
(a)
30 35 40 45 50
3 4 5 6 7
100 MHz
(b)
30 35 40 45 50
3 4 5 6 7
160 MHz
(c)
30 35 40 45 50
0 2 4 6
SSNR (dB)
40 MHz
(d)
30 35 40 45 50
0 1 2 3 4 5
(e) Axial distance [mm]
100 MHz
30 35 40 45 50
1 2 3 4 5
160 MHz
[image:5.612.146.471.58.247.2](f)
Fig. 4. CNR and SSNR for sampling frequency of 40, 100 and 160 MHz with centre frequency of 5 and 7 MHz at 30, 40 and 50 mm depth. Solid red and blue lines are representing ideal and quantized delays for CPWI with centre frequency of 5 MHz while the dashed lines are representing centre frequency of 7 MHz. The solid and dashed green lines are representing PWI for centre frequency of 5 and 7 MHz respectively.
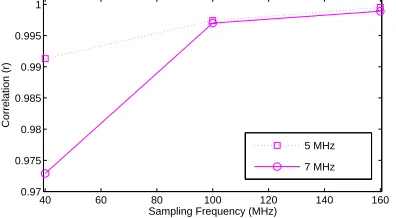
shows very high correlation values for sampling frequencies of 100 and 160 MHz compared to 40 MHz.
40 60 80 100 120 140 160 0.97
0.975 0.98 0.985 0.99 0.995 1
Sampling Frequency (MHz)
Correlation (r)
5 MHz 7 MHz
Fig. 5. Correlation between Quantized and Ideal delay profile.
Generally, centre frequency of 7 MHz shows significantly less deviation in SSNR and CNR when compared to 5 MHz due to quantization errors. This is due to the reason that pitch has been set to λ. The λ value increases when the centre frequency decreases according toλ=c/fo. Changes in axial
and lateral resolution very dependence on formation of speckle patterns. Since both delays does not differ much, there are only small changes in spatial resolution and the different become smaller as the sampling frequency increases.
VI. CONCLUSION
The quantization errors directly proportional to minimum achievable time step which is a function of the sampling frequency. Thus, increasing the sampling frequency will even-tually reduce the quantization errors. It is also proven that temporal averaging which is not bound with quantization er-rors relatively produces high CNR and SSNR at low sampling frequency(40 MHz) for both centre frequency compared to CPWI. The overall results shows that the quantization errors
does not have a significant effect on the final image quality of CPWI for the angular range of−10.02◦ to+10.02◦.
REFERENCES
[1] V. Behar, D. Adam, and Z. Friedman, “A new method of spatial compounding imaging,”Ultrasonics, vol. 41, no. 5, pp. 377–384, 2003. [2] Z. Alomari, S. Harput, S. Hyder, and S. Freear, “Selecting the number and values of the cpwi steering angles and the effect of that on imaging quality,” in Ultrasonics Symposium (IUS), 2014 IEEE International. IEEE, 2014, pp. 1191–1194.
[3] G. Montaldo, M. Tanter, J. Bercoff, N. Benech, and M. Fink, “Coherent plane-wave compounding for very high frame rate ultrasonography and transient elastography,”Ultrasonics, Ferroelectrics, and Frequency
Control, IEEE Transactions on, vol. 56, no. 3, pp. 489–506, 2009.
[4] D. Garcia, L. Tarnec, S. Muth, E. Montagnon, J. Por´ee, and G. Cloutier, “Stolt’s fk migration for plane wave ultrasound imaging,”Ultrasonics,
Ferroelectrics, and Frequency Control, IEEE Transactions on, vol. 60,
no. 9, pp. 1853–1867, 2013.
[5] S. Holm and K. Kristoffersen, “Analysis of worst-case phase quantiza-tion sidelobes in focused beamforming,”Ultrasonics, Ferroelectrics, and
Frequency Control, IEEE Transactions on, vol. 39, no. 5, pp. 593–599,
1992.
[6] W. L. Beaver, “Phase error effects in phased array beam steering,” in
Ultrasonics Symposium, 1977. IEEE, 1977, pp. 264–267.
[7] P. A. Magnin, O. T. Von Ramm, and F. L. Thurstone, “Delay quantization error in phased array images,”IEEE Transactions on Sonics Ultrasonics, vol. 28, pp. 305–310, 1981.
[8] P. R. Smith, D. M. Cowell, B. Raiton, C. V. Ky, and S. Freear, “Ultrasound array transmitter architecture with high timing resolution using embedded phase-locked loops,” Ultrasonics, Ferroelectrics, and
Frequency Control, IEEE Transactions on, vol. 59, no. 1, pp. 40–49,
2012.
[9] J. A. Jensen, “Field: A program for simulating ultrasound systems,” in
10Th Nordicbaltic Conference on Biomedical Imaging, Vol. 4,
Supple-ment 1, Part 1: 351–353. Citeseer, 1996.
[10] M. Toulemonde, O. Basset, P. Tortoli, and C. Cachard, “Thomsons multitaper approach combined with coherent plane-wave compounding to reduce speckle in ultrasound imaging,”Ultrasonics, vol. 56, pp. 390– 398, 2015.
[11] S. Harput, J. McLaughlan, D. Cowell, and S. Freear, “New performance metrics for ultrasound pulse compression systems,” inUltrasonics
[image:5.612.72.270.354.463.2]