rspb.royalsocietypublishing.org
Research
Cite this article:
Lind MI, Yarlett K, Reger J,
Carter MJ, Beckerman AP. 2015 The alignment
between phenotypic plasticity, the major axis
of genetic variation and the response to
selection.
Proc. R. Soc. B
282
: 20151651.
http://dx.doi.org/10.1098/rspb.2015.1651
Received: 9 July 2015
Accepted: 4 September 2015
Subject Areas:
evolution
Keywords:
Daphnia pulex
,
Chaoborus flavicans
,
Gasterosteus aculeatus
, genetic
accommodation, phenotypic plasticity,
predation
Author for correspondence:
Martin I. Lind
e-mail: [email protected]
Electronic supplementary material is available
at http://dx.doi.org/10.1098/rspb.2015.1651 or
via http://rspb.royalsocietypublishing.org.
The alignment between phenotypic
plasticity, the major axis of genetic
variation and the response to selection
Martin I. Lind
1,2, Kylie Yarlett
1, Julia Reger
1, Mauricio J. Carter
1,3and Andrew P. Beckerman
11Department of Animal and Plant Sciences, University of Sheffield, Western Bank, Sheffield S10 2TN, UK 2Animal Ecology, Department of Ecology and Genetics, Uppsala University, Uppsala 752 36, Sweden 3Centro Nacional del Medio Ambiente, Universidad de Chile, Avenida Larrain 9975, La Reina, Santiago, Chile
APB, 0000-0002-4797-9143
Phenotypic plasticity is the ability of a genotype to produce more than one phenotype in order to match the environment. Recent theory proposes that the major axis of genetic variation in a phenotypically plastic population can align with the direction of selection. Therefore, theory predicts that plasticity directly aids adaptation by increasing genetic variation in the direction favoured by selec-tion and reflected in plasticity. We evaluated this theory in the freshwater crustaceanDaphnia pulex, facing predation risk from two contrasting size-selective predators. We estimated plasticity in several life-history traits, theGmatrix of these traits, the selection gradients on reproduction and survival, and the pre-dicted responses to selection. Using these data, we tested whether the genetic lines of least resistance and the predicted response to selection aligned with plas-ticity. We found predator environment-specificGmatrices, but shared genetic architecture across environments resulted in more constraint in the Gmatrix than in the plasticity of the traits, sometimes preventing alignment of the two. However, as the importance of survival selection increased, the difference between environments in their predicted response to selection increased and resulted in closer alignment between the plasticity and the predicted selection response. Therefore, plasticity may indeed aid adaptation to new environments.
1. Introduction
Phenotypic plasticity is the ability of a genotype to produce more than one phenotype depending upon the environment [1]. The value of adaptive phenoty-pic plasticity is that it generates environment-specific phenotypes that are similar to what would be expected by a locally adapted specialist to that environment [1,2], thus reflecting what would be favoured by selection. Therefore, adaptive plasticity, it is argued, can influence local adaptation by producing phenotypes that are pre-adapted to the new environment. The role of plasticity in local adap-tation has experienced a recent upsurge in interest due to several important models that predict how plasticity may enable survival in novel and extreme environments long enough for genetic change to take place through a process called genetic accommodation [3–6].
Empirical plasticity research, however, remains largely focused on detecting genetic variation in plasticity of single or pairs of traits varying across environments. This narrow focus is even true for recent theory where models of adaptation linked to phenotypic plasticity typically focus on single plastic traits [4,6,7]. However, it has long been recognized that the genetic variance and covariance of multiple traits can be expressed in an environment-specific manner [8–11], and that selection acts on the variance and covariance among traits [12–14]. A plastic response thus often involves a set of traits responding in concert [8,15–17] and requires a multivariate view of plasticity [16,18,19]. Such a multivariate
perspective of plasticity can be captured in aGmatrix, the matrix of additive genetic variance and covariance among traits [8]. It is well known that exposure to extreme environments can release cryptic genetic variation and affect the genetic architecture of traits [20,21], but plasticity may also be restricted to phenotypic changes with no effect on the underlying genetic architecture at all, in which case plasticity may sometimes buffer against evol-utionary change [7].
Draghi & Whitlock [22] presented a model that deals with both the long-standing expectation that plasticity aids adaptation and the multivariate nature of plasticity. Linking developmental genetics, plasticity and adaptation, their theory predicts that plasticity can directly aid adaptation by increasing genetic variation along the lines of least resistance, known asgmax(sensuSchluter [23]), the major axis of genetic variation estimated from the G matrix. Using a simulation approach based upon a developmental gene network model, they recovered the well-established understanding that adaptive phenotypic plasticity evolves in a heterogeneous environment with reliable cues [2]. Importantly, however, their model resulted in an increase in genetic variance and covariance (and also mutational variance) in the direction of greatest divergence between the environments, which with stable selection gradients would be the direction most favoured by selection. Draghi & Whitlock [22] suggest that the plastic response to multivariate selection predisposes the develop-mental machinery to, and increases the genetic variance in, the direction of most divergence between the environments, as long as plasticity is adaptive and selection is sufficiently strong alonggmax. In this context, it is predicted that plasticity would align the phenotype to the major axis of genetic variation and, ultimately, be in line with the direction of selection. However, the theory has an underlying theoretic assumption of a stable
Gmatrix, an assumption that can be challenged [24–26]. We present a multivariate, experimental evaluation of this theory, and the assumption of a stableGmatrix [22], using a model system of phenotypic plasticity: predator-induced defences in the water flea, Daphnia pulex. Specifically, we evaluate whether phenotypic plasticity can align a phenotype with the major axis of genetic variation (gmax) and whether, ultimately, plasticity aligns a phenotype with the predicted response to selection [22]. We do so with D. pulex, which responds to predator chemical cues with inducible plastic and adaptive changes in morphology, life history and behav-iour [27 –30]. We focus on life-history plasticity, a major form of predator-induced plasticity in daphnids [29 –32] and one benefiting from substantial evolutionary theory linked to size-selective predation [33].
2. Methodology
(a) Species and study populations
Our work centres on 19 genotypes (clones) of D. pulex
(Cladocera), a microcrustacean with a cosmopolitan distribution, and a keystone herbivore of algae in ponds and lakes [34]. In the UK, it is subjected to contrasting and seasonal predation pressure by young-of-the-year fish in spring, and midge larvae during summer and autumn [35]. Fish are visual predators and prefer
largeDaphnia, which gives a benefit to individuals that mature
early and at a small size [32,36]. By contrast, midge larvae are
gape-limited, and therefore prey upon small juvenile Daphnia,
favouring growth to reach the size refuge and mature at a larger size [29,32,37].
Daphnia pulexwere collected in May and June 2009 in northern England from the ponds LD3 and LD6 in Cumbria, and Crabtree
in Yorkshire, from which 5, 7 and 7 clones (n¼19), respectively,
were identified using 17 microsatellite markers ( ponds, clones and markers are described in the electronic supplementary
material, table S1).The clones were maintained in the laboratory
in hard artificial pond water (ASTM [38]) under a 16 L : 8 D cycle
and fed the algaeChlorella vulgaris.
(b) Kairomone extraction to generate plasticity
To generate predator-induced responses, we isolated kairomones from both fish and midge larvae. Water enriched in fish
kairo-mones was generated following Beckerman et al. [32,39] by
housing two similar-sized (4–6 cm) three-spined sticklebacks Gasterosteus aculeatus(fed commercially available frozenDaphnia)
in 6 l artificial pond water at 12.58C in a controlled temperature
room for at least 24 h, whereafter the water was filtered through
a 47 mm filter (Fisherbrand, Fisher Scientific) and a 0.45mm
pore-sized filter (Sartorius Stedim Biotech). Midge kairomone was isolated via filtration and solid-phase extraction from frozen Chaoborus flavicans(Honka, Germany) following the protocol of Tollrian [31] (see also [32,35,39]).
(c) Life-table experiment and trait plasticity
We generated plasticity in four life-history traits, estimated from a standard life-table experiment: age and size at maturity, fecundity and somatic growth rate of adults. We defined age at maturity as the age when eggs were first released into the brood pouch, size at maturity as the linear distance between the top of the head and the base of the tail at age at maturity, and adult growth rate as the log-change in body size between the first and third clutch, divided by the time between these clutches. Fecundity was esti-mated as the number of eggs produced in the first three clutches
and used to calculate the intrinsic population growth rate (r).
Using data of three clutches is considered appropriate inD. pulex
where Riessen & Sprules ([40], fig. 4) showed that the first three
clutches can explain approximately 94% of totalr.
These data were collected from daphnids housed in a
temp-erature-controlled laboratory set to 218C and a 16 L : 8 D cycle. To
avoid maternal and grand-maternal effects, the clones were grown for three generations under experimental food conditions prior to the experiment. We initiated the experiment by exposing third-generation mothers between their second and third brood to the predation-risk treatment conditions, and the experimental animals used in the life-table experiments were neonates from their third brood. Each mother was placed in a 60 ml glass jar filled with experimental medium containing 49 ml ASTM [38],
food (C. vulgaris, 2105cells ml21) and marinure (a liquid
seaweed extract for micronutrients, Wilfrid Smith Ltd., Northans,
UK, 0.018mml21), and were selected for experiment when
holding black-eyed embryos (12 h prior to parturition). The predator cue treatments were constructed either by adding
0.5ml ml21of the concentrated midge kairomone to experimental
vessels or by replacing 20% of the ASTM with ASTM enriched with fish kairomones. These cue concentrations give strong induction of morphological and life-history traits and correspond to realistic predation pressures [17,32,39,41]. The neonates were exposed to the predator cue treatment during their whole development with water conditions reset daily by moving the individuals into fresh treatment medium (ASTM, food, marinure and kairomones).
Life-history traits were estimated under experimental
conditions and individuals were photographed daily to collect size-specific data on each replicate. The experiment started when one neonate from each mother was placed in a cylindrical glass tube (height: 150 mm, diameter: 19 mm) filled with 30 ml treatment medium. When reaching maturity, the adults were housed in 60 ml glass jars filled with 50 ml treatment medium. The experiment was
rspb.r
oy
alsocietypublishing.org
Pr
oc.
R.
Soc.
B
282
:
20151651
terminated when the adults reached their third clutch. Each of the
19 clonetreatment combinations was replicated 2–5 times (mean
3.8), giving a total sample size of 143 individuals (71 in the fish and 72 in the midge cue treatment).
Reproductive fitness was calculated as the intrinsic population
growth rate (r) in the absence of predation mortality (e.g. risk
cues only). We calculated r for each replicate by solving the
Euler–Lotka equation on life-table data spanning first instar to third clutch [42].
(d) Phenotypic plasticity, selection gradients and the
response to selection
Here we present how we (i) quantify plasticity and define ‘vectors of plasticity’ associated with predation risk, (ii) quantify the gen-etic covariance matrix and it’s major axis of variation, and then (iii) construct a composite selection gradient of survival and reproduction. We then detail how we (iv) generate predicted, predator-specific multivariate responses to selection from (ii) and (iii). This represents the raw material with which to evaluate Draghi & Whitlock’s [22] hypotheses and is summarized in electronic supplementary material, figure S1.
(i) Phenotypic plasticity and the multivariate vector of plasticity
We evaluated plasticity, genetic variation in plasticity and estimated the vector of plasticity using a Bayesian MCMC mixed model. We fitted a model with predator treatment as fixed effect and a random-regression specification for the random effect where each clone possessed its own intercept and slope. We estimated trait plas-ticity via the fixed effect. Genetic variation in plasplas-ticity is estimated by evaluating whether the slopes terms in the random effects speci-fication is significant. All tests were evaluated via 95% credible intervals from the joint posterior distribution of fixed and random effects. We also compared, using DIC (the Bayesian equivalent to AIC), a model with and without the random slopes term, as an additional test of genetic variation in plasticity.We then defined the vector of trait plasticity to midge and to fish predation risk for each of size at maturity, age at maturity and adult growth rate. The vector of plasticity is the ‘distance moved by each trait’ and was estimated from the treatment-specific mode of the trait values. Specifically, from the joint posterior distri-bution of trait values in each treatment, we constructed the joint posterior distribution of the mode of each vector.
We also here estimated the angle separating the vector of
plasticity to each predator,uplast, defined by the cosine formula
for a dot product [43]:
cosuplast¼
Pð
plasticitymidgeplasticityfishÞ
kplasticitymidgek kplasticityfishk: ð2:1Þ
Fecundity (r) was not included in the estimation of plasticity
and was reserved for the analysis of selection gradients (below).
The models for each trait were fitted in R [44] usingMCMCglmm
[45] with source pond (n¼3) as a fixed effect and clone (n¼19) as a
nested random effect, allowing for different intercepts and slopes. We used parameter-expanded priors, and models were fitted with a burn-in of 50 000 and sampling that produced 1000 estimates of the joint posterior distribution from more than 500 000 iterations of the chains. All models were checked for autocorrelation in the chains.
(ii) Estimating
G
matrices and
g
maxWe next estimated the predator treatment-specific variance –
covariance matrices (G) for the three traits. We used a Bayesian
MCMC multivariate mixed model (MCMCglmm[45]) to estimate
Gfollowing [19],
yi¼mþXbþZaþ1, ð2:2Þ
whereyiis a vector of trait values in treatmentiandZais a design
matrix relating individuals to total clonal genetic effectsa, which
estimates an unstructured G matrix of the genetic effects. All
trait data from the life-table experiment was first centred and
scaled to s.d.¼1.
As above, source pond (n¼3) was a fixed effect and clone
the random effect. The clone random effect was specified as an unconstrained variance –covariance matrix of the total genetic (clonal) variance and covariance among the three traits.
gmaxis the first principal component ofGand the major axis of
genetic variation. Using the tools presented in [19] for estimating
gmax and angles separating gmax from Bayesian MCMC mixed
models, we derived a joint posterior distribution ofgmax, and the
angle separatinggmaxbetween the two predation treatments via [43],
cos(uÞ ¼
P
ðgmaxðmidgeÞgmaxðfishÞÞ
kgmaxðmidgeÞk kgmaxðfishÞk
: ð2:3Þ
(iii) Estimating the selection gradient
b
Selection under predation risk in nature depends both upon reproduction and survival. Their relative importance depends upon the predation regime in ponds, which fluctuates over the season [35]. Therefore, we specified the following five selection gradients, each representing a different weighting of
reproduc-tion (bR) and survival (bS): bR,bRþ0.5bS,bRþbS, 0.5bRþbS
andbS.
The linear selection gradient bR was estimated as the
regression coefficients from multiple linear regression of traits
against intrinsic population growth rate (r) (see life-table
exper-iment above). As we were interested in comparing the alignment between the response to selection and the plasticity, fitness was centred and scaled to unit variance, to give comparable strength of selection between the predation treatments, only allowing the direction of selection to vary. These analyses were implemented
using parametric methods from thersmpackage [46] in R [44].
As all traits were measured on the same individuals, we used
ran-domization to test the significance of all parameters ofbR, taking
the potential non-independence of residuals into account [47].
The selection gradients on survival,bSwere defined from the
empirical and theoretical literature of size-selective predation on Daphnia.This literature (see [33] for theory) is strongly focused
around assumptions that gape-limited predators, such as
Chaobor-ous larvae, target small prey [37,48,49], while visually hunting
predators such as fish instead target large prey [36,50]. To reflect
this, we defined thebScoefficient for size at maturity to21 in the
fish treatment (highest fitness for smallDaphnia) and toþ1 in the
midge treatment (highest fitness for large Daphnia). All other
coefficients were set to zero in this instance.
Finally, to create the composite selection gradients,bRandbS
were standardized to a total length (strength of selection) of 1. We then created the composite selection gradients, representing
a several combinations of reproduction (bR) and survival (bS):bR,
bRþ0.5bS,bRþbS, 0.5bRþbSandbS. The resulting composite
selection gradients were also standardized to a length of 1, to enable meaningful comparisons of the response to selection in the following step.
(iv) Predicting the multivariate response to selection
We next estimated the vector of multivariate response to selection of size at maturity, age at maturity and adult somatic growth rate
using the multivariate breeders equation,Dz¼Gb[51].
Using theG-matrices estimated for each treatment and the
five composite selection gradients, we estimatedDz(2G5b¼
10Dz). Because G is a joint posterior distribution of 1000
estimates (see above), multiplyingGbybgenerates a joint
pos-terior distribution ofDz for each composite selection gradient
and treatment. We thus propagated the variability in our
rspb.r
oy
alsocietypublishing.org
Pr
oc.
R.
Soc.
B
282
:
20151651
estimates ofG(captured in the posterior distribution ofG) toDz [19,52]. We then estimated the angles between the
treatment-specific responses to selection for eachb, as defined in equation
(2.3) above.
(e) Alignment between plasticity,
g
maxand response
to selection
The above methods provide the raw material (see the electronic supplementary material, figure S1) to test the hypothesis that plasticity aids adaptation. From above, we have posterior distri-butions describing (i) the vectors of plasticity (how far a trait moves) and the angle between the plastic response, (ii) the
vec-tors of gmax (major axis of genetic variation) and the angle
between these major axes, and (iii) the predicted response to the five combinations of survival and reproductive selection,
Dz, in each treatment and the angle between these responses.
Our analyses rely on testing whether the angle between
vec-tors (e.g. between a vector of plasticity andDz) are significantly
different. Ovaskainen et al. [52] and Robinson & Beckerman
[19] make clear that while calculating the angle is straightfor-ward, a test of whether it is significant requires a special test statistic. Following Robinson & Beckerman [19] and Ovaskainen et al.[52], multiple samples of the posterior provide a way to
gen-erate multiple estimates ofu, which can be used to compare the
difference in angle within each group to differences in angle between each group [19,52]:
cuðGi,GjÞ ¼ ½uðGAi,GBiÞ þuðGAj ,GBjÞ ½uðGAi ,GAj Þ þuðGBi,GBjÞ:
Each and every one of our angle comparisons can be calcu-lated by applying this formula to the posterior distributions of each metric, resulting in a statistical test of whether angles
deviate or align. We formally define alignment as a non-signifi-cant angle difference within treatments. This definition is characterized as a ‘match’ between types of responses.
However, this definition of alignment is sensitive to low power, as alignment is acceptance of the null hypothesis. There-fore, we also evaluated alignment via mismatch [53] where we predict that vectors that are aligned within treatments are signifi-cantly mis-aligned between treatments. We calculated the
mismatch between the predator-specificgmax/Dzand the plastic
trait expression induced by the wrong predator (e.g. the angle
betweengmax(fish)and plasticitymidge). A non-significant angle of
alignment combined with a significantly different angle of mis-match is the strongest inference about alignment, as it tests our power to reject the null hypothesis.
3. Results
(a) Plasticity
Daphnia pulexshowed plastic changes between predator treat-ments (figure 1; electronic supplementary material, table S2). Exposure to midge kairomones resulted in larger size at matu-ration (midge: 1.87 mm; fish: 1.68 mm; pMCMC,0.001) and a lower adult growth rate (midge: 0.034 day21; fish: 0.040 day21; pMCMC¼0.008) than did exposure to fish kairomones. Mean age at maturation did not differ between the treatments (midge: 7.12 days; fish: 7.07 days; pMCMC¼0.751). We did not include a control treatment, but both fish and midge cues are known to result in plastic trait induction relative to a control [32]. The vector of multi-trait plasticity was constructed using the full posterior distribution of the scaled and centred trait
5.5 6.5 7.5 8.5
fish midge
age at maturity (days)
(a)
1.4 1.5 1.6 1.7 1.8 1.9 2.0
fish midge
(b)
size at maturity (mm)
(c)
0.01 0.03 0.05 0.07
fish midge
adult gro
wth rate (day
–1)
(d)
0.68
0.75
plasticityfish plasticitymidge
[image:4.595.92.504.40.383.2]137.2°
Figure 1.
Reaction norms, based upon clone means, for predator cue-specific expression of (
a
) age at maturity, (
b
) size at maturity and (
c
) adult growth rate.
(
d
) The angle between the vectors of multi-trait plasticity. Bold lines represent the mean clone response; for posterior modes see results section.
rspb.r
oy
alsocietypublishing.org
Pr
oc.
R.
Soc.
B
282
:
20151651
inductions, and the posterior modes for the traits in the midge treatment vector were 0.048 (age), 0.649 (size) and 20.159 (adult growth), while the corresponding trait modes for the fish treatment vector were 20.062 (age), 20.623 (size) and 0.167 (adult growth). These plasticity vectors differed between the treatments by an angle of 137.28(95% CI: 100.48–172.58,
p,0.001). Surprisingly, among these genotypes, we found no significant genetic variation in plasticity in size at matu-ration (20.026, 95% CI:20.17–0.08) and adult growth rate (20.11, 95% CI:20.37–0.08), the two plastic traits, confirmed by very similar DIC values between models with and without the random slope term (size at maturation: DICintercept¼279,
DICinterceptþslope¼280; adult growth rate: DICintercept¼296,
DICinterceptþslope¼296). By contrast, we found significant
gen-etic variation for plasticity in age at maturation, the not significantly plastic trait (20.49, 95% CI: 21.04 to 20.07,
DICintercept¼389, DICinterceptþslope¼365). In summary, in
classicalGEterms, we haveEeffects on two traits but no
GE (parallel reaction norms with non-zero slopes), andGEin one trait, but noE(crossing reaction norms, but zero slope on average).
(b) The
G
matrix and
g
maxWe found significant broad sense heritability for all traits (age at maturity, size at maturity, adult growth rate) in both predator cue treatments (electronic supplementary material, table S3). Moreover, we found a significant and strong negative genetic covariance between size at maturity and adult growth rate in the fish treatment. The genetic cor-relation between size at maturity and adult growth rate was negative in both treatments, but stronger in the fish cue treat-ment, where we also found a positive genetic correlation between age and size at maturity.
gmax explained the same amount of genetic variation in each treatment (fish: 60.08%; midge: 56.04%; electronic sup-plementary material, table S4). The angle betweengmaxof the two treatments was 66.68(95% CI: 42.38–86.28), indicating a substantial plastic rotation of theGmatrix between the two predator treatments (electronic supplementary material, figure S2). This rotation was true in 94% of the posterior distri-bution samples used to test the angle differences, suggesting
p¼0.06 [52]. We found no difference in the total amount of
clonal genetic variation (fish: 1.16, CI: 0.89–1.80; midge: 1.10, CI: 0.72–1.61) between the treatments.
(c) Selection gradients
In both predator cue treatments, we found that early age at maturity, large size at maturity and high adult growth rate all resulted in high reproductive fitness (electronic supplemen-tary material, tables S5 and S6), resulting in very similarbR between the treatments, as opposed to the divergent selection gradients for size-selective survivalbS(electronic supplemen-tary material, figure S3). From bR andbS, we then created the five composite selection gradients used for predicting the response to selection (electronic supplementary material, table S7).
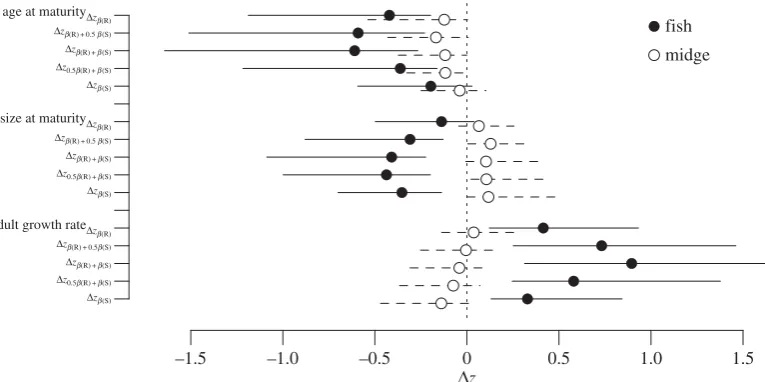
(d) Predicted response to selection
Figure 2 and electronic supplementary material, figure S4, tables S8 and S9 present the range of predicted responses to selection across the combinations of bR and bS. The angles between responses to each predator range from 48.98to 137.838, increas-ing as the importance of selection on survival is weighted more and more heavily. Selection on survival was required to detect a significant difference in the response to selection by each pred-ator, but even weighting this by 50% of its strength results in approximately 308 rotation between responses. Despite the differences in selection gradients for reproduction and survival in the fish treatment (positive selection on size for reproduc-tion, negative for survival, resulting in a difference in angle of 118.88), the predicted response to selection was remarkably similar for all combinations ofbRandbS(figure 2; electronic supplementary material, table S9).
(e) Alignments
(i) Fish-induced plasticity,
g
maxand
D
z
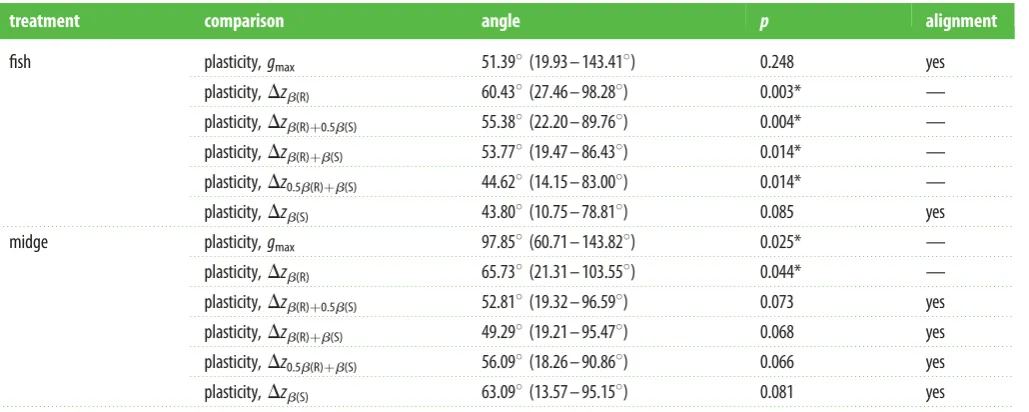
We found strong alignment between the vector of plasticity and gmax. There was no significant difference in the angle between the vector of multi-trait plasticity andgmax(table 1); plasticity aligned with the predicted response to selection,
Dz, when selection was based entirely on survival. It did not
–1.5 –1.0 –0.5 0 0.5 1.0 1.5
Dz
age at maturityDz
b(R)
Dzb(S)
Dzb(R) +b(S)
Dzb(R) + 0.5 b(S)
Dz0.5b(R) +b(S)
Dzb(S)
Dzb(R) +b(S) Dzb(R) + 0.5 b(S)
Dz0.5b(R) +b(S)
Dzb(S)
Dzb(R) +b(S) Dzb(R) + 0.5b(S)
Dz0.5b(R) +b(S) adult growth rateDz
b(R)
size at maturityDz
b(R)
fish
[image:5.595.101.484.44.235.2]midge
Figure 2.
The predicted response to selection (
D
z
) using composite selection on reproduction (
D
z
b(R)), survival (
D
z
b(S)) or reproduction and survival combined to
selection in the fish (black circles, solid lines) and midge (white circles, dashed lines) cue treatment. The horizontal lines correspond to the 95% HPD interval.
rspb.r
oy
alsocietypublishing.org
Pr
oc.
R.
Soc.
B
282
:
20151651
align with plasticity in any combination of selection gradients that involvedbR(table 1).
(ii) Midge-induced plasticity,
g
maxand
D
z
Midge-induced plasticity and Dz and plasticity and gmax were aligned in all instances where the composite selection gradient involved some degree of survival selection (table 1).
(iii) Validation via testing for misalignment
We validated our power to detect misalignment (a significant angle difference) by comparing the treatment-specific gmax and Dz with the wrong plasticity vector. For both predator cue treatments, we detected a significant misalignment for all combinations of b, indicating that we have the power to detect misalignment. However, forgmax,we found alignment with the wrong plasticity vector (no significant angle difference) in both comparisons (electronic supplementary material, table S10).
4. Discussion
The role of phenotypic plasticity in adaptation and diversifica-tion continues to be a central focus in evoludiversifica-tionary ecology. Theory on how plasticity evolves, how it might aid in adaptation to novel, rapidly changing environments and how it might influ-ence diversification is replete. Data, however, are often lacking to evaluate the emerging ideas. Draghi & Whitlock [22] proposed a new addition to this arsenal of theory, suggesting that pheno-typic plasticity evolves to align phenopheno-typic responses with the major axis of genetic variation. This idea, captured in an elegant model of development, provides a theoretical framework for the simple idea that plasticity can ‘pre-adapt’ populations to selec-tion regimes, as long as the novel environment is an extension of the environment inducing the plastic response. Here, we pre-sent a multivariate, experimental evaluation of this idea using a classic system to study phenotypic plasticity: predator-induced defences in the water flea,D. pulex.
(a) Alignment with plasticity of the traits
In a simulation study, Draghi & Whitlock [22] showed that selection on phenotypic plasticity could result in genetic correlations among the traits, such that genetic variance is increased in the direction of the plastic trait expression which, with stable selection gradients, also is the direction favoured by selection.
For perfect alignment between plasticity and the response to selection, the theory assumes a stable G matrix across environments wheregmax and plasticity should be aligned. This would aid adaptation in the direction of plastic trait expression. Moreover, for plasticity to align with the response to selection, the different contributions to the selection gradient (i.e. reproduction and survival) should be in a simi-lar direction. Otherwise, alignment depends upon the relative importance of reproduction and survival selection.
Predator cues in our experiments resulted in major differ-ences in the G matrix between treatments, suggesting that genetic variance can be expressed in an environment-specific fashion [11,16]. However, environmental-specific changes in the G matrix go outside the assumptions of [22], whose model assumes G to be stable across environments, which complicates predictions.
We found a very pronounced difference in plastic trait expression (137.28) between the fish and the midge cue treat-ment, while the difference ingmaxbetween the treatments was substantial but smaller (66.68). This difference in angles separ-ating plasticity andgmaxsuggests a higher degree of shared genetic architecture between environments, possibly constrain-ing adaptation in the directions of plastic trait induction. Therefore, we would not predict alignment betweengmaxand plasticity in both predator cue treatments, and indeed only
[image:6.595.45.560.88.294.2]gmax in the fish cue treatment aligned with the plastic trait induction. Furthermore, asgmaxdiffered much less than plas-ticity, gmax in the midge cue treatment was actually more aligned with the plastic trait induction in the fish cue treatment, rather than in its own treatment. Together this suggests that shared genetic architecture between environments can limit alignment between plasticity andgmax.
Table 1.
Tests for alignment between plasticity (the vector of plastic trait inductions), the direction of maximum genetic variation (
g
max) and the response to
selection on reproduction (
D
z
b(R)), survival (
D
z
b(S)) or reproduction and survival combined. Angle is expressed as the posterior mode with 95% CI. Significant
angle differences are indicated by asterisks. Non-significant angles indicate alignment.
treatment
comparison
angle
p
alignment
fish
plasticity,
g
max51.39
8
(19.93 – 143.41
8
)
0.248
yes
plasticity,
D
z
b(R)60.43
8
(27.46 – 98.28
8
)
0.003*
—
plasticity,
D
z
b(R)þ0.5b(S)55.38
8
(22.20 – 89.76
8
)
0.004*
—
plasticity,
D
z
b(R)þb(S)53.77
8
(19.47 – 86.43
8
)
0.014*
—
plasticity,
D
z
0.5b(R)þb(S)44.62
8
(14.15 – 83.00
8
)
0.014*
—
plasticity,
D
z
b(S)43.80
8
(10.75 – 78.81
8
)
0.085
yes
midge
plasticity,
g
max97.85
8
(60.71 – 143.82
8
)
0.025*
—
plasticity,
D
z
b(R)65.73
8
(21.31 – 103.55
8
)
0.044*
—
plasticity,
D
z
b(R)þ0.5b(S)52.81
8
(19.32 – 96.59
8
)
0.073
yes
plasticity,
D
z
b(R)þb(S)49.29
8
(19.21 – 95.47
8
)
0.068
yes
plasticity,
D
z
0.5b(R)þb(S)56.09
8
(18.26 – 90.86
8
)
0.066
yes
plasticity,
D
z
b(S)63.09
8
(13.57 – 95.15
8
)
0.081
yes
rspb.r
oy
alsocietypublishing.org
Pr
oc.
R.
Soc.
B
282
:
20151651
Given the interest in the role of plasticity for adaptation [3,6], our data show that theGmatrix is environment-specific, potentially aiding adaptation, but that the shared genetic archi-tecture between environments can result in greater plasticity in traits than in their underlying genetic variance and covariance. This potentially constrains adaptation in the direction of a plas-tic response, as divergence often [24] (but not always [26]) followsgmax, at least in the short term. Nevertheless, the fact that the G matrix is environmental-specific is beneficial for adaptation to different environments.
However, adaptation is the response to selection, which also depends upon the environment-specific selection gradi-ent. While similar trait values were important for high reproduction in both environments, survival in the midge cue treatment selects for large size [37,48,49], while small size is beneficial in the fish cue treatment [36,50]. Thus, especially for the fish treatment, the trait combinations selected for by survival or reproduction differ markedly.
Therefore, we predicted that the degree of alignment between the plastic trait induction and the predicted response to selection would depend upon the relative contribution of survival and reproduction to the composite selection gradi-ent. Indeed, the degree of alignment was dependent upon the nature of selection, and increased in both environments with increased contribution of survival selection. This was most marked in the fish cue treatment, where these selection gradients were most dissimilar.
The lack of alignment with predicted selection on repro-duction (but not survival) could indicate that the induced life-history plasticity inD. pulexis mainly a survival benefit, a suggestion that has strong empirical support [28 –30]. This suggests that if predators are the main selective agent affect-ingD. pulex, then the response to selection will be aligned with anti-predator plasticity, despite aG-matrix constrained by shared genetic architecture between the two environ-ments. Therefore, phenotypic plasticity, as predicted by Draghi & Whitlock [22], can move populations towards phe-notypic adaptive peaks that would be generated by selection.
(b) Power to detect alignment
Recalling that alignment is acceptance of the null hypothesis, we followed the approach of [53] to also test alignment with the wrong plasticity vector. We found that the angle between
Dz and the predator-induced plasticity was always smaller than the angle betweenDzand the plasticity vector induced by the wrong predator. Moreover, we were always able to detect significant misalignment between Dzand the wrong plasticity vector, suggesting that we have power to detect misalignment if present. This is important given the low number of surviving individuals of some clones and the resulting variance in their genetic estimates.
Nevertheless, we suggest that alignment should be seen as continuous rather than a categorical observation based on a single significance value. Except for plasticity andgmax in the midge cue treatment, all angles are less than 908, suggesting that they are clearly not in the wrong direction. It may be more important to consider the degree of (mis-) alignment, and the Bayesian MCMC approach to estimating angle changes provides a robust route to this end [19,52]. Additionally, our assessment of (mis-)alignment is also contingent on how survival and reproduction selection gradi-ents combine. Appropriate, empirically derived weighting of
these two portions of selection is necessary for more precise system-specific conclusions about how (mis-)alignment might shape the response to selection.
(c) Environmental-specific changes in the
G
matrix
Novel or stressful environments can release cryptic genetic variation or change the genetic architecture of traits [20,21]. However, the suggestion that environmental cues may induce plastic change in the genetic variance and covariance of traits [54] has only lately attracted attention from experimen-tal biologists [19]. Our data reveal one of very few empirical examples of such inducedGmatrix plasticity (see also [9–11]). We show predator chemical cues can induce changes in the
Gmatrix of life-history traits. This is a necessary response to invoke adaptive arguments associated with plasticity, but has rarely been shown. Environmental-specific change in the G
matrix was, however, not modelled by [22], which makes any direct test of their model predictions complicated in the current study. TheGmatrix is, however, known to evolve over evol-utionary time [24,25], for example following divergence [12–14,26], which together with several findings of environ-ment-specific changes inG[9–11] suggests that it is sensitive to environmental input. We suggest that this sensitivity is not random but can follow the plasticity of the traits.
(d) Predicted response to selection
To predict the response to selection, we used five combi-nations of the two fundamental selection gradients, one based upon reproduction in the presence of predator kairo-mones and one based upon the extensive literature on size-selective survival/mortality in the face of size-size-selective pre-dation [36,37,50].
These composite gradients and several features of our data influenced our calculation of response to selection to each predator. The selection gradients for reproductive fitness were identical, which was in stark contrast to the differentG
matrices in the two predator cue treatments, where the covariance differences drive the response to selection. The selection gradient analysis revealed that in both treatments, highest reproductive fitness would be obtained by maturing early and at a large size, and to continue to grow after matur-ity. As there is a strong correlation between size and number of eggs that fit in the brood pouch [28], it is hardly surprising that these trait combinations result in high reproductive fitness. Therefore, it may be surprising that the predicted response to selection differed between the treatments despite identical selection gradients on reproduction. However, differences in indirect selection caused by plastic changes in genetic covariance structure are responsible for the divergent responses, as there was strong opposing indirect selection in the fish treatment for small size at maturation, and indirect selection in the midge treatment for low adult growth rate.
This should be contrasted to the strikingly different selec-tion gradients on survival in the face of real predators. In midge predation, large size is beneficial because Chaoborus
midge larvae are gape-limited predators [37]. By contrast, when visually hunting fish are present, highest survival is obtained by having a small size [36,50]. Thus, for the fish treatment, the selection gradients for survival and reproduc-tion were markedly different, because large size at maturation, which is adaptive in terms of reproduction, is
rspb.r
oy
alsocietypublishing.org
Pr
oc.
R.
Soc.
B
282
:
20151651
maladaptive in terms of survival in the presence of large size-selective, visually hunting fish.
Despite these differences, the predicted response to selec-tion was qualitatively similar for all composite selecselec-tion gradients within each treatment, but strikingly different for each predator cue treatment, with increased differences with increased contribution of survival selection to the overall selec-tion gradient. The predicted response to selecselec-tion in the fish treatment was to mature early, at a smaller size, and to have high adult growth rate, while the predicted response in the midge treatment was to mature at a larger size. The conclusion here is that the indirect selection, linked to predator-specific covariance among traits, matters.
5. Conclusion
Draghi & Whitlock [22] suggest that phenotypic plasticity may evolve to align phenotypic responses with the major axis of genetic variation, which could result ultimately in alignment of plasticity and the response to selection. We tested this elegant idea in a multivariate, experimental evalu-ation of using a classic system to study phenotypic plasticity: predator-induced defences in the water flea, D. pulex. Our results suggest that a multivariate picture of plasticity, articu-lating variance and covariance changes among environments, and the response to selection to multiple pressures, are vital to understanding the generality of this long-standing idea.
Our focus onDaphnia, which can be locally adapted to the types of predators present in a lake, either by selection by the predators themselves [27,30,55,56] or indirectly through seasonal predation and temperature changes [57], indicates that plastic changes in the genetic variance and covariance of traits may play an unexplored role in diversification of populations, especially if selection is mainly driven by survi-val, but that the response could be somewhat constrained by shared genetic architecture. Plastic changes in genetic archi-tecture goes outside the predictions of the model [22], but could aid adaptation in the direction of the plastic response.
Data accessibility.Data are available from Dryad (http://dx.doi.org/10. 5061/dryad.8t89m); core functions for the Bayesian MCMC based ana-lyses are available from GitHub at https://github.com/andbeck/ mcmc-plus-tensor.
Authors’ contributions.M.I.L. designed the study, carried out the exper-iments, conducted the statistical analyses and drafted the manuscript. K.Y. designed the study and carried out the experiments. J.R. and M.J.C. aided the statistical analyses and the drafting of the manuscript. A.P.B. designed the study, coordinated the analyses and drafted the manuscript together with M.I.L. All authors gave final approval for publication.
Competing interests.The authors declare no competing interest.
Funding. The Swedish Research Council (VR 623-2010-848) funded M.I.L. A.P.B. and K.Y. acknowledge NERC (Studentship). A.P.B. acknowledges NERC (NE/D012244/1) for funding.
Acknowledgements.We thank Matt Robinson for many discussions and insight.
References
1. DeWitt TJ, Scheiner SM. 2004Phenotypic plasticity: functional and conceptual approaches. New York, NY: Oxford University Press.
2. Tollrian R, Harvell CD (eds). 1998The ecology and evolution of inducible defenses. Princeton, NJ: Princeton University Press.
3. West-Eberhard MJ. 2003Developmental plasticity and evolution. New York, NY: Oxford University Press.
4. Lande R. 2009 Adaptation to an extraordinary environment by evolution of phenotypic plasticity and genetic assimilation.J. Evol. Biol.22, 1435 – 1446. (doi:10.1111/j.1420-9101.2009.01754.x) 5. Lande R. 2015 Evolution of phenotypic plasticity in
colonizing species.Mol. Ecol.24, 2038 – 2045. (doi:10.1111/mec.13037)
6. Chevin L-M, Lande R, Mace GM. 2010 Adaptation, plasticity, and extinction in a changing
environment: towards a predictive theory.PLoS Biol.
8, e1000357. (doi:10.1371/journal.pbio.1000357) 7. Price TD, Qvarnstro¨m A, Irwin DE. 2003 The role of
phenotypic plasticity in driving genetic evolution.
Proc. R. Soc. Lond. B270, 1433 – 1440. (doi:10. 1098/rspb.2003.2372)
8. Via S, Lande R. 1987 Evolution of genetic variability in a spatially heterogeneous environment: effects of genotype-environment interaction.Genet. Res. Camb.49, 147 – 156. (doi:10.1017/S00166723 0002694X)
9. Sgro` CM, Hoffmann AA. 2004 Genetic correlations, tradeoffs and environmental variation.Heredity93, 241 – 248. (doi:10.1038/sj.hdy.6800532)
10. Brock MT, Weinig C. 2007 Plasticity and environment-specific covariates: an investigation of floral-vegetative and within flower correlations.
Evolution61, 2913 – 2924. (doi:10.1111/j.1558-5646.2007.00240.x)
11. Robinson MR, Wilson AJ, Pilkington JG, Clutton-Brock TH, Pemberton JM, Kruuk LEB. 2009 The impact of environmental heterogeneity on genetic architecture in a wild population of Soay sheep.
Genetics181, 1639 – 1648. (doi:10.1534/genetics. 108.086801)
12. Cano JM, Laurila A, Palo J, Merila¨ J. 2004 Population differentiation in G matrix structure due to natural selection inRana temporaria.Evolution
58, 2013 – 2020. (doi:10.1111/j.0014-3820.2004. tb00486.x)
13. Doroszuk A, Wojewodzic MW, Gort G, Kammenga JE. 2008 Rapid divergence of genetic variance – covariance matrix within a natural population.Am. Nat.171, 291 – 304. (doi:10.1086/527478) 14. Johansson F, Lind MI, Ingvarsson PK, Bokma F. 2012
Evolution of the G-matrix in life history traits in the common frog during a recent colonisation of an island system.Evol. Ecol.26, 863 – 878. (doi:10. 1007/s10682-011-9542-2)
15. Relyea RA. 2004 Fine-tuned phenotypes: tadpole plasticity under 16 combinations of predators and competitors.Ecology85, 172 – 179. (doi:10.1890/ 03-0169)
16. Husby A, Nussey DH, Visser ME, Wilson AJ, Sheldon BC, Kruuk LEB. 2010 Contrasting patterns of phenotypic plasticity in reproductive traits in two
great tit (Parus major) populations.Evolution64, 2221– 2237. (doi:10.1111/j.1558-5646.2010.00991.x) 17. Dennis SR, Carter MJ, Hentley WT, Beckerman AP.
2011 Phenotypic convergence along a gradient of predation risk.Proc. R. Soc. B278, 1687 – 1696. (doi:10.1098/rspb.2010.1989)
18. Chun YJ, Collyer ML, Moloney KA, Nason JD. 2007 Phenotypic plasticity of native vs. invasive purple loosestrife: a two-state multivariate approach.
Ecology88, 1499 – 1512. (doi:10.1890/06-0856) 19. Robinson MR, Beckerman AP. 2013 Quantifying
multivariate plasticity: genetic variation in resource acquisition drives plasticity in resource allocation to components of life history.Ecol. Lett.16, 281 – 290. (doi:10.1111/ele.12047)
20. Scharloo W. 1991 Canalization: genetic and developmental aspects.Annu. Rev. Ecol. Syst.22, 65 – 93. (doi:10.1146/annurev.es.22.110191.000433) 21. Berger D, Grieshop K, Lind MI, Goenaga J, Maklakov AA, Arnqvist G. 2014 Intralocus sexual conflict and environmental stress.Evolution68, 2184 – 2196. (doi:10.1111/evo.12528)
22. Draghi JA, Whitlock MC. 2012 Phenotypic plasticity facilitates mutational variance, genetic variance, and evolvability along the major axis of environmental variation.Evolution66, 2891 – 2902. (doi:10.1111/j. 1558-5646.2012.01649.x)
23. Schluter D. 1996 Adaptive radiation along genetic lines of least resistance.Evolution50, 1766 – 1774. (doi:10.2307/2410734)
24. Steppan SJ, Phillips PC, Houle D. 2002 Comparative quantitative genetics: evolution of the G matrix.
rspb.r
oy
alsocietypublishing.org
Pr
oc.
R.
Soc.
B
282
:
20151651
Trends Ecol. Evol.17, 320 – 327. (doi:10.1016/ S0169-5347(02)02505-3)
25. Arnold SJ, Bu¨rger R, Hohenlohe PA, Ajie BC, Jones AG. 2008 Understanding the evolution and stability of the G-matrix.Evolution62, 2451 – 2461. (doi:10. 1111/j.1558-5646.2008.00472.x)
26. Eroukhmanoff F, Svensson EI. 2011 Evolution and stability of the G-matrix during the colonization of a novel environment.J. Evol. Biol.24, 1363 – 1373. (doi:10.1111/j.1420-9101.2011.02270.x)
27. Parejko K, Dodson SI. 1991 The evolutionary ecology of an antipredator reaction norm:Daphnia pulex
andChaoborus americanus.Evolution45, 1665 – 1674. (doi:10.2307/2409787)
28. Lynch M. 1980 The evolution of cladoceran life histories.Q. Rev. Biol.55, 23 – 42. (doi:10.1086/ 411614)
29. Riessen HP. 1999 Predator-induced life history shifts inDaphnia: a synthesis of studies using meta-analysis.Can. J. Fish. Aquat. Sci.56, 2487 – 2494. (doi:10.1139/f99-155)
30. Boeing WJ, Ramcharan CW, Riessen HP. 2006 Multiple predator defence strategies inDaphnia pulexand their relation to native habitat.
J. Plankton Res.28, 571 – 584. (doi:10.1093/ plankt/fbi142)
31. Tollrian R. 1995 Predator-induced morphological defenses: costs, life history shifts, and maternal effects inDaphnia pulex.Ecology76, 1691 – 1705. (doi:10.2307/1940703)
32. Beckerman AP, Rodgers GM, Dennis SR. 2010 The reaction norm of size and age at maturity under multiple predator risk.J. Anim. Ecol. 79, 1069 – 1076. (doi:10.1111/j.1365-2656.2010. 01703.x)
33. Taylor BE, Gabriel W. 1992 To grow or not to grow: optimal resource allocation forDaphnia.Am. Nat. 139, 248 – 266. (doi:10.1086/285326)
34. Carpenter SRet al.1987 Regulation of lake primary productivity by food web structure.Ecology68, 1863 – 1876. (doi:10.2307/1939878)
35. Hammill E. 2007 The ecology and evolution of refuges in an aquatic ecosystem: from inducible defences to habitat complexity. PhD thesis, University of Sheffield, Sheffield, UK.
36. Brooks JL, Dodson SI. 1965 Predation, body size, and composition of plankton.Science150, 28 – 35. (doi:10.1126/science.150.3692.28)
37. Spitze K. 1991Chaoboruspredation and life-history evolution inDaphnia pulex: temporal pattern of population diversity, fitness, and mean life history.
Evolution45, 82 – 92. (doi:10.2307/2409484) 38. ASTM. 1989 Standard guide for conducting acute
toxicity tests with fishes, macroinvertebrates and amphibians. InAnnual book of ASTM standards, pp. 379 – 397. West Conshohocken, PA: ASTM International.
39. Beckerman A, Wieski K, Baird D. 2007 Behavioural versus physiological mediation of life history under predation risk.Oecologia152, 335 – 343. (doi:10. 1007/s00442-006-0642-6)
40. Riessen HP, Sprules WG. 1990 Demographic costs of antipredator defenses inDaphnia pulex.Ecology71, 1536 – 1546. (doi:10.2307/1938290)
41. Hammill E, Rogers A, Beckerman AP. 2008 Costs, benefits and the evolution of inducible defences: a case study withDaphnia pulex.J. Evol. Biol.21, 705 – 715. (doi:10.1111/j.1420-9101.2008.01520.x) 42. Stearns SC. 1992The evolution of life histories.
New York, NY: Oxford University Press. 43. Strang G. 2009Introduction to linear algebra.
Wellesley, MA: Wellesley-Cambridge Press. 44. R Core Team. 2013R: a language and environment
for statistical computing. Vienna, Austria: R Foundation for Statistical Computing.
45. Hadfield J. 2010 MCMC methods for multi-response generalized linear mixed models: the MCMCglmm R package.J. Stat. Softw.33, 1 – 22.
46. Lenth RV. 2009 Response-surface methods in R, using rsm.J. Stat. Softw.32, 1 – 17.
47. Brooks R, Hunt J, Blows MW, Smith MJ, Bussie´re LF, Jennions MD. 2005 Experimental evidence for
multivariate stabilizing sexual selection.Evolution
59, 871 – 880. (doi:10.1111/j.0014-3820.2005. tb01760.x)
48. Swift MC, Fedorenko AY. 1975 Some aspects of prey capture byChaoboruslarvae.Limnol. Oceanogr.20, 418 – 425. (doi:10.2307/2835201)
49. Pastorok R. 1981 Prey vulnerability and size selection byChaoboruslarvae.Ecology62, 1311 – 1324. (doi:10.2307/1937295)
50. O’Brien WJ. 1979 The predator-prey interaction of planktivorous fish and zooplankton.Am. Sci.67, 572 – 581. (doi:10.2307/27849438)
51. Lande R, Arnold SJ. 1983 The measurement of selection on correlated characters.Evolution37, 1210 – 1226. (doi:10.2307/2408842)
52. Ovaskainen O, Cano JM, Merila¨ J. 2008 A Bayesian framework for comparative quantitative genetics.
Proc. R. Soc. B275, 669 – 678. (doi:10.1098/rspb. 2007.0949)
53. Berger D, Postma E, Blanckenhorn WU, Walters RJ. 2013 Quantitative genetic divergence and standing genetic (co)variance in thermal reaction norms along latitude.Evolution67, 2385 – 2399. (doi:10. 1111/evo.12138)
54. Stearns S, de Jong G, Newman B. 1991 The effects of phenotypic plasticity on genetic correlations.
Trends Ecol. Evol.6, 122 – 126. (doi:10.1016/0169-5347(91)90090-K)
55. De Meester L. 1993 Genotype, fish-mediated chemical, and phototactic behavior inDaphnia magna.Ecology74, 1467 – 1474. (doi:10.2307/ 1940075)
56. De Meester L. 1996 Evolutionary potential and local genetic differentiation in a phenotypically plastic trait of a cyclical parthenogen,Daphnia magna.Evolution50, 1293 – 1298. (doi:10.2307/ 2410669)
57. Walsh MR, Post DM. 2011 Interpopulation variation in a fish predator drives evolutionary divergence in prey in lakes.Proc. R. Soc. B278, 2628 – 2637. (doi:10.1098/rspb.2010.2634)