Evaluation of selective laser sintering processes by optical
coherence tomography
Guangying Guan
a, Matthias Hirsch
a, Zeng Hai Lu
b, David T.D. Childs
b, Stephen J. Matcher
c, Ruth Goodridge
a,
Kristian M. Groom
b, Adam T. Clare
a,⁎
a
Manufacturing Division, Faculty of Engineering, University of Nottingham, University Park, Nottingham NG7 2RD, United Kingdom b
Department of Electronic and Electrical Engineering, University of Sheffield, Nanoscience & Technology Building, North Campus, Broad Lane, Sheffield S3 7HQ, United Kingdom c
Department of Materials Science & Engineering, The Kroto Building, North Campus, Broad Lane, Sheffield S3 7HQ, United Kingdom
a b s t r a c t
a r t i c l e i n f o
Article history: Received 21 April 2015
Received in revised form 10 September 2015 Accepted 15 September 2015
Available online 18 September 2015
Keywords: OCT
Selective laser sintering AM
In-situ monitoring
Selective laser sintering (SLS) enables the fast,flexible and cost-efficient production of parts directly from 3D CAD data. Unlike more established machine tools, there is a marked lack of process monitoring and feedback control of key process variables. In-situ analysis techniques permit the emergence of repair techniques, in-process optimization of production parameters, and will also serve to save time and material. In this study, optical coherence tomography (OCT) is used for thefirst time to evaluate components produced by SLS. Using a Polyamide-PA2200, surface defects are analyzed and the limiting factors associated with the measurement technique are quantified. OCT is shown to be a useful technique for evaluating surface irregularities alongside sub-surface defects that have resulted from poor sintering or non-homogeneous powder spreading. We demonstrate detection and quantification of surface defects such as cracks, pores and voids on a ~30μm scale. Furthermore, we show that this technique can resolve‘built-in’fine features within a 200 to 400μm depth below the surface, covering typical layer thicknesses used by this process. This capability paves the way for real-time monitoring of the SLS process for assurance, or even dynamic correction of defects during the build.
© 2015 The Authors. Published by Elsevier Ltd. This is an open access article under the CC BY license (http://creativecommons.org/licenses/by/4.0/).
1. Introduction
Additive manufacturing (AM) is an emerging technique that provides an alternative solution to traditional, subtractive manufacturing in many situations where fast and cost-efficient fabrications are required[1]. AM is currently undergoing a transition from application in prototype[2–4]and pilot production technology towards scalable and high-value manufacture of bespoke components. Accelerated up-take will be aided by improved process control and dynamic correction. Selective laser sintering (SLS) is a maturing additive manufacturing technique,first demonstrated in the 1980s[5,6], which enables fast, flexible and cost-effective fabrication of highly complex monolithic polymer parts. The freedom of design afforded by SLS allows significant mass and cost reductions. The rapid set-up and build time enable one of the quickest routes from product design to market launch, which is of benefit to application in the medical sector[7–10], as well as aviation and space industries[11]. However, the SLS process can be affected by a number of factors associated with the properties of the material used and with the sintering process itself[12,13]. For example, temper-ature, gravity and capillary effects make it difficult to achieve 100%
density in the manufactured elements. Common failure modes in SLS-built parts include: pores and cracks inside or at the edge of specimens, irregular surfacefinishing, closed holes or gap fusion, missing or thin walls and loose powders inclusion[13]. Such failures, caused by poor sintering or non-homogeneous spreading in previous layers, will result in a reduction of the part's lifetime.
Manufacturing methods for the high value markets (e.g. aerospace, healthcare) are characterised by the level of process monitoring that govern their operation. These are commonly used to‘feedback’into the process to rectify wayward conditions and also‘feed-forward’to help with the specification of rework. Manufacturing of the future is set to be more data rich than it is today with advent of initiative such as“Industry 4.0”and“cloud manufacturing”. While process control is common in modern machining centres and available often as a low cost add-on, this technology is yet to be developed for AM tools in any meaningful way. The most significant barrier to the uptake of AM pro-cesses is the high cost per part and a lack of confidence in part integrity. Furthermore, where certification of a process is required, assurances must be provided that the product matches specification. Non-destructive evaluation (NDE) methods including X-Ray Computed To-mography (XCT)[14,15]have proven useful for determining the integ-rity of additively manufactured parts, but are expensive and typically only allow 10–100μm spatial resolution. In addition, faults originating ⁎ Corresponding author.
E-mail address:[email protected](A.T. Clare).
http://dx.doi.org/10.1016/j.matdes.2015.09.084
0264-1275/© 2015 The Authors. Published by Elsevier Ltd. This is an open access article under the CC BY license (http://creativecommons.org/licenses/by/4.0/). Contents lists available atScienceDirect
Materials and Design
in the early stages of a lengthy manufacturing run are not recognised until after processing is complete. It is proposed that in-situ analysis techniques will be incorporated into additive manufacturing systems in order to monitor the manufacturing process and identify defects as they occur. This will permit the emergence of repair techniques, closed-loop in-process optimization of production parameters and will also serve to save time and material if a build must be aborted.
Optical coherence tomography (OCT) is a non-contact imaging technique which allows video-rate 3 dimensional (3D) representation of the structure with axial resolutionsb10μm. Now widely employed in ophthalmology[16,17], oncology[18,19]and cardiology[20,21], the main drive is towards cost reduction and system performance enhance-ment to accelerate wider uptake in clinical diagnosis. Fewer reports exist on the use of OCT outside the biophotonics community, but these include the examination of glass-fibre reinforced polymer matrix composites [22], defects in polymer solar cells during roll-to-roll manufacture[23]and the study offine art[24]. The scope of OCT could be extended to the functional imaging of a large number of materials that are transparent to the wavelength of the light source used, such as polymeric parts, which are broadly transparent in the near-IR. Compared with XCT for the assessment of SLS specimens, OCT has three main advantages. First, OCT can provide 3D volume images with spatial resolutionb10μm compared with ~50μm for typical XCT. It therefore has the potential capability of imaging single powder particles, as well as measuring pores or voids typically found inside SLS parts. Second, with development of computer processing and optical sensor technology, the scanning speed of OCT could reach speeds of 100 kHz, which will allow more than 390 frames/s. That is, real-time monitoring of the SLS procedure could be achieved due to the high scanning speed. Third, an OCT system could be easily integrated within an SLS system in order to enable in-situ analysis. Since the only elements of the OCT system that need to be inside the working space consists of a galvo mirror, an opticalfiber and a small optical train. Compared to XCT systems, current class are of the order of 2200 cm3in their most compact form. It is therefore difficult to envisage an entire XCT technology being integrated within the SLS system in this way.
In this study, OCT is used for thefirst time to assess components produced by SLS with commercially available polyamide 12 laser sintering material (PA2200, EOS Ltd). Specimens with different features and failure modes were fabricated and measured using the OCT system in order to test the feasibility of using OCT to examine polymeric parts. OCT is therefore demonstrated as a process control tool for SLS.
2. Methods and materials
2.1. OCT system
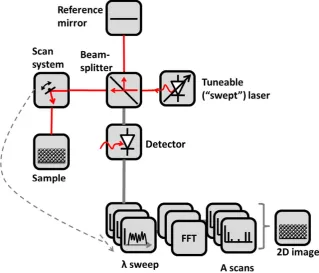
In this work we utilize a commercially available, multi-beam, Fourier-domain, swept source OCT system (EX1301, Michelson Diag-nostics, Kent, UK). The simplified schematic diagram of this system is shown onFig. 1. The OCT system is equipped with a laser with a central wavelength of 1305 ± 15 nm and a sweep range of 150 nm at 10 kHz (HSL-2000, Santec, Japan). The axial optical resolution when applied to polyamide PA2200 isb10μm, while the lateral optical resolution, de-termined by the system optics, is approximately 7.5μm. The maximum scan width is 7 mm with a penetration depth of up to 2 mm when applied to biological tissues. Common commercially available OCT light sources have central wavelength at 800 nm, 1000 nm and 1300 nm respectively. The penetration depth decreases with wave-length and is work piece material dependant. Therefore, the 1300 nm light source was chosen as it could provide the maximum penetration (measured ~ 400μm) of polymeric material (i.e. multiple layers of sintered powder), whilst offering a resolution capable of resolving individual powder particles, typicallyN30μm in size.
[image:2.595.133.453.454.727.2]OCT performs cross-sectional imaging by measuring the magnitude and echo time delay of backscattered light. Cross-sectional images are generated by performing multiple axial measurements of echo time delay (axial scans or A-scans) and scanning the incident optical beam transversely. This produces a two-dimensional data set, which repre-sents the optical backscattering in a cross-sectional plane through the tissue. Images, or B-scans, can be displayed in false color or grey scale to visualize tissue pathology. Two scanning modes may be used for imaging. In the free-run mode, the laser beam is scanned only in one
direction, acquiring B-scans (frame images) which consist of 1667 A-scans. The OCT beam is overlaid with a red tracer beam, allowing the precise location of the scan to be visualized by the operator. This free-run mode is often used to locate regions of interest that can then be scanned in the other scanning mode: multi-scan. The multi-scan mode captures sequences of images (i.e. B-scans) at set positions decid-ed by a motorisdecid-ed stage holding the sample. The operator can set the number of slices in the sequence and the slicing spacing, which pro-duces a three-dimensional scanned volumetric data set.
2.2. Resolution measurement
The axial (depth) resolution of the OCT system is defined as the smallest distance that can be discriminated between two refractive index discontinuities. This resolution is determined by the coherence length of the light source. The coherence length,lc, is the spatial width
of thefield autocorrelation interferogram and can be determined by the Fourier transform of the source power spectrum. The axial resolu-tion,δz, is inversely proportional to the optical bandwidth, and is deter-mined by the following relationship:
δz¼lc¼2 ln 2
π λ
02
Δλ ð2:1Þ
whereΔλis the optical bandwidth, of the light source (assuming a Gaussian spectrum) andλ0is the centre wavelength. The actual axial and lateral resolutions of the EX1301 OCT system were measured before specimen characterization. A planar optical mirror was used as the target for the axial resolution measurement.Fig. 2shows the captured coherence spectrum when the mirror is placed at the best focus plane, which was set to be 0.8 mm below zero path length difference of the delay line. The axial resolution was defined by the full width half maximum (FWHM) which was 8.8μm in air at the plane of best focus.
The lateral resolution in OCT, as in microscopy, is determined by the focusing optics of the light incident on the sample. Assuming an ideal Gaussian beam, the lateral resolution,Δx, is the diffraction limited spot size on the sample and is given by:
Δx¼4λ0 π
fobj
d ð2:2Þ
wherefobjis the focal length of the objective lens anddis the beam
waist of the beam on the objective lens.
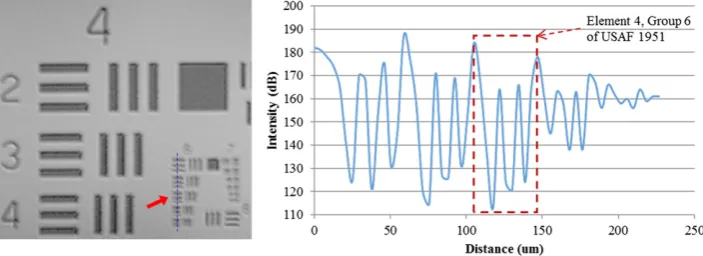
A positive USAF1951 resolution test pattern was used as a test target to obtain a volumetric 3D image at the best focus plane.Fig. 3(left) shows the 90.5 line-pairs-per-mm element resolved (element 4, group 6, each bar is 5.5μm wide). For quantitative analysis, we mea-sured a modulation depth of 15% using element 4 of group 6 in the USAF1951 test target in air (Fig. 3(right)). For a Gaussian beam, this im-plies a FWHM spot size of around 8.4μm.
2.3. Sample preparation
The test parts analysed in this investigation were fabricated using commercially available polyamide 12 laser sintering material (PA2200, EOS Ltd) in a FORMIGA P 100 SLS system (from EOS e-Manufacturing Solutions). Four sets of test parts were designed to mimic the different types of failure modes typical in SLS-produced parts. The composition and purpose of each set of test parts are summarised inTable 1. Group 1 consists of solid parts with smooth surfaces and no internal voids or other features designed in; group 2 includes similar parts from group 1 but with a range of different voids opened on the surface; group 3 contains parts with areas containing loose powder on the surface; group 4 contains specimens with similar voids as those in group 2, however in this case the voids are designed to reside approximately 100μm below the surface.
3. Results
3.1. Surface roughness characterization using OCT
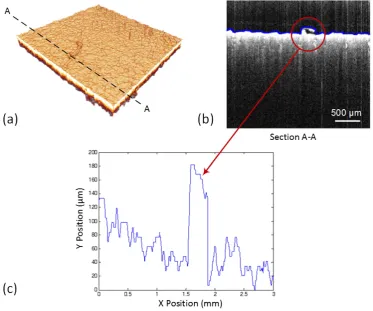
The specimens in group 1 were designed to have a smooth surface. However, protuberances may occur during the fabrication procedure, such as that observed inFig. 4(a). The profile of this protuberance can be observed in the cross-sectional image inFig. 4(b), which shows a slice through the cross-section, A-A, inFig. 4(a). A topographical plot can be constructed from the OCT data set and is shown inFig. 4(c), providing a detailed, scaled representation of the protuberance.
3.2. Surface void detection using OCT
[image:3.595.54.285.52.200.2]A specimen from group 2 incorporating different shapes of voids was analyzed by both scanning electron microscopy (SEM) and OCT. This
Fig. 2.Typical spectrum of an optical mirror captured by OCT.
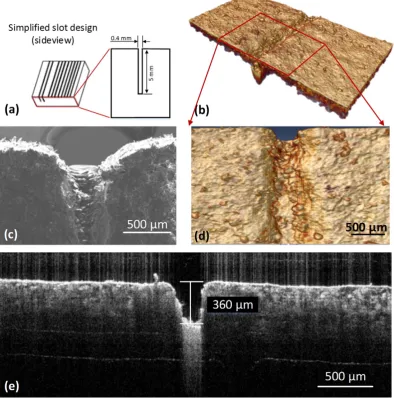
[image:3.595.127.479.589.717.2]specimen was designed to include a regular, square-shaped void. How-ever, the parts fabricated by the SLS system suffered several uninten-tional defects. It can be observed fromFig. 5(c) and (d) that a large number of protuberances, similar to those in 3.1 above, exist at the top surface and at the bottom of each void. We attribute these protuber-ances to poor sintering or non-homogeneous spreading in previous layers.Fig. 5(b) shows the 3D volumetric image of the regular void area, which we display on a zoomed-in scale inFig. 5(d) in order to bet-ter compare with the SEM image inFig. 5(c), which both indicate a shallower than designed void. FromFig. 5(e) we also observe a tapering of the lateral size of the‘square’void, which becomes wider towards the surface, as well as a void depth measured as ~ 360μm instead of the 5 mm depth as per the design intent. This is commensurate with the findings of the SEM examination infigure (c).
Further experiments were performed to measure the size of individ-ual PA2200 powder particles. The manufacturer's technical specification data gives the average grain size as 56μm, however a range of particle sizes can be measured from 28μm to 92.6μm by SEM, shown inFig. 6
(top), in which powder was thinly distributed upon a piece of paper (fibrous background). The EX1301 OCT system with a measured lateral resolution of 8.4μm also demonstrates its capability to detect individual
powder particles as small as 30μm (Fig. 6(bottom)). These results may explain why a large number of protuberances can be detected at the surface of specimens such as inFig. 5(d), through non-uniformities in local melt dynamics.
3.3. Loose powder detection using OCT
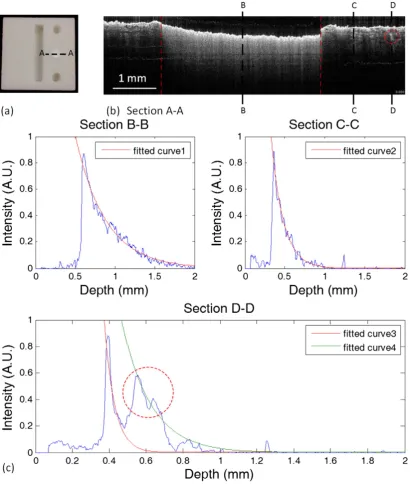
Fig. 7shows the OCT results and analysis for specimens with both solid (i.e. sintered) and loose (non-sintered) areas. The OCT signal is de-rived from the back-scattering of light from this sample, hence higher intensity is as a result of higher back scattering properties.Fig. 7
[image:4.595.106.480.409.720.2](b) shows an OCT cross-sectional image of the section A-A in (a), through a deep cylindrical void,filled with non-sintered powder. It can be observed fromFig. 7(b) that the average intensity level within the loose powder area (within the two red dash lines) is much higher than the intensity of the surrounding solid area. The depth-resolved in-tensity changes from section B-B, C-C and D-D are shown inFig. 7(c). One OCT B-frame image consists of 1667 A-lines with equal spacing of 4.2μm. 10 adjacent A-lines from each section are averaged in order to enhance the signal-to-noise ratio. From section B-B and section C-C, it can be observed that the attenuation of intensity within the loose pow-der area occurs at a much slower rate than the corresponding solid area. An intensity peak, marked by the red dashed circle inFig. 7(c), which is about 200μm below the specimen surface can be observed from section D-D. This peak could be caused by encased loose or semi-sintered powder. The expanded scale on section D-D better demonstrates the appearance of the high intensity feature, attributed to a suspected incorporation of a region of loose powder below the specimen's surface. Quantitative analysis was performed by applying an exponential curvefit to the intensity profile of each section inFig. 7(c). The highest peak from each section represents the location of the surface. The
Fig. 4.Analysis of a solid specimen with smooth surfacefinishing: (a) 3 × 3 × 3 mm 3D OCT structural image. The corresponding cross-sectional profile through the protuberance A-A in (a) is shown in (b) where the blue line shows the surface of specimen; (c) plots the surface profile shown in (b).
Table 1
Summary of structure type investigated.
Specimen name
Description Purpose
Group 1 Solid specimens with smooth surface Surface analysis Group 2 Solid specimens with open voids Surface defects analysis Group 3 Solid specimens loose powder area Powder vs. fused material analysis Group 4 Solid specimens with different shapes
of void below surface
consecutive 15 pixels below the surface were abandoned for thefitting in order to eliminate the high reflection from the air-sample interface. The cut off intensity threshold was set to 15% of the peak value to avoid the artifact signal originating from deeper within the sample. The 1/e values for curve 1 (loose powder) and curve 2 (solid part) are 0.38 and 0.15 mm respectively. If this drop off were purely due to absorption in polyamide, then the ratio of the two implies a loose power density 39% compared to that of the solid part. This value is as expected since the packing density of mono sized random loose powder cannot exceed 64% [25], and ‘rough’ polyamide powder without vibration or shaking, is likely to have a much lower density than this upper limit.
By inspection of the cross section D-D inFig. 7(c), we can see at least two regions of interest. Near the surface, at a position of 0.4 mm, the decay (fitted by curve 3) is in agreement with that of the solid polymer, however, at a position of 0.6 mm an increase in intensity followed by a second decay rate (fitted by curve 4) is seen. This intensity increase corresponds to a large difference in refractive index giving rise to a strong reflection. After this increase, the drop off is significantly lower than that found both near the surface, suggesting an inclusion of loose powder. From curve 4, the attenuation coefficient for the suspected loose powder area is 35% that of the solid part.
3.4. Sub-surface feature detection using OCT
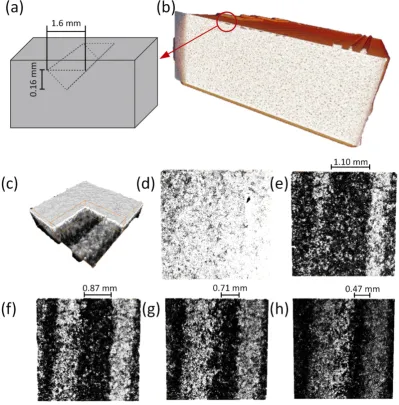
Further experiments were performed in order to determine the capability of OCT for the detection of sub-surface features. Two sets of specimens from group 4 were manufactured with a range of different shapes and sizes (in the 100 to 500μm range) of voids built into the structure at different depths.Fig. 8(b) shows the 3D volumetric struc-tural image measured by XCT with a spatial resolution of 56μm. A number of voids can be observed at the top area of the cross-section image from (b), however they are blurred due to the small size relative to the large spatial resolution of XCT. One of the largest voids, which is located ~ 100μm below the surface and has an inverted triangular shape, is marked inFig. 8(b) by the red circle. The dimensions of this void channel are provided inFig. 8(a).Fig. 8(b) shows the OCT 3D structural image (3 × 3 × 0.4 mm) of the region containing the triangu-lar void, with a section removed from the top quarter of the image to reveal the detailed structure beneath the surface. This triangle is not easily discerned in thisfigure, however, examination of the constituent
en-face images reveals the triangular structure more clearly.
[image:5.595.105.500.64.463.2]Fig. 8(d)–(h) show theen-faceview of this sample at different depths. The brighter regions signify the boundary of the triangle whilst the dark areas signify the void, which is shown to become narrower with
increasing depth below the surface. The void depth measured fromFig. 8(c) is ~140μm, which is a little shallower than the original design, with this apparent inability to fabricate features with great accuracy/resolution consistent with the surface void example described in 3.2.
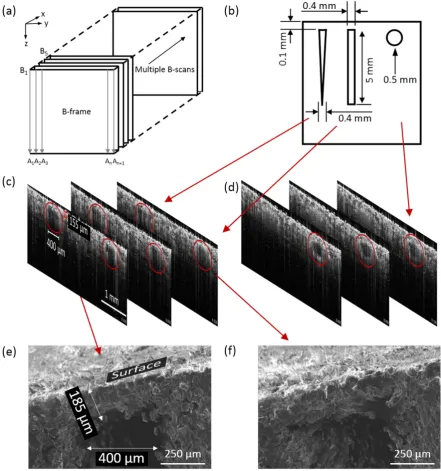
Finally, another set of specimens from group 4 were examined. These comprise 3 × 3 × 1 cm cubes incorporating 12 different shapes of void channels located ~ 100μm below the solid surface. The gap between each void channel is 2 mm. In order to further investigate this series of sub-surface features, a scanning protocol was invoked whereby the scanning area was dissected into a series of 4 × 3 mm sections. A schematic diagram illustrating one such 3D section is shown inFig. 9(a), as described inSection 2.1. A galvo mirror is employed to achieve one B-scan in the y direction; two translation stages are adapted respectively to realize 3D scanning in the x direction and bulk moving in the y direction for the next volume scan.
Fig. 9(b) shows the detailed dimensions and locations of three chosen voids.Fig. 9(c) and (d) show the adjacent B-frame OCT cross-sectional images of these chosen voids (marked by red circles) in one 3D scanning section. The triangular and square shaped voids can be easily observed and their depth-resolved dimension can be measured fromFig. 9(c). In addition, the dimensions of voids in the x direction and the distance to the surface in the z direction can also be measured easily. The dimen-sions of the circular channel can be observed and measured inFig. 9(d).
Fig. 9(e) and (f) show the corresponding SEM images of the edge of the triangular and square voids respectively, which provide cross-validation of the OCT measurement. The designed thickness for the top surface layer is 100 μm, however the results from both SEM and OCT demonstrate that the actual thickness is ~185μm, which can be found inFig. 9(c-f), and is consistent with the previous measurement of
smaller voids than originally designed. This further highlight the poor manufacturing tolerances associated with SLS when compared to established manufacturing techniques.
4. Discussion
XCT is a commonly used post-process NDE tool, employed to evalu-ate the quality and integrity of parts produced by SLS. However, the spa-tial resolution for XCT is presently limited to ~60μm. SEM can achieve resolutions of ~10 nm, making it a powerful tool for defect evaluation of parts after fabrication. However, SEM can only obtain information from the surface of conductive samples, so samples have to be sectioned for internal examination, thereby destroying parts in order to investi-gate their internal composition. Larger sample sizes would also notfit inside the SEM sample chamber. Furthermore, the equipment size, cost, and scan duration of both these methods would preclude their use in real-time in-situ monitoring.
[image:6.595.95.492.53.375.2]OCT is an emerging and rapidly developing non-contact optical imaging method which provides real time, depth resolved cross-sectional images with micron scale resolution. Due to its high resolution and non-destructive nature, OCT has been widely used in clinical diag-nosis and biological research. To the best of our knowledge, this is the first time that OCT has been applied to probe additively manufactured parts. InSection 3.1we demonstrated that OCT can capture high-resolution (~ 9μm) 3D volume images. The EX1301 OCT system we employed for this study can achieve frame rates of 6.25 frames/s with 1600 A-line scans in one B-frame. For real-time monitoring of the SLS printing process for a large sample, this speed will not be sufficient. However, 500 kHz OCT systems [26] are now available, offering 25 times faster scan rate than the EX1301. In addition, we can perform
selective sampling to reduce the scanning area in order to match the ‘write’speed of the SLS system. The rapid development of optical sensor and computing technology makes real-time monitoring and control through dynamic feedback a distinct prospect.
Section 3.3 describes OCT's capability for identifying micro-structural variations in the solid build, such as poorly melted or un-melted PA2200 powders. One drawback, is that, the measurement accu-racy at the highest resolutions will be affected by speckle noise, which is inherent due to the spatial and temporal coherence of the optical waves backscattered from the sample. However, space, time, wavelength or polarization can be dithered to eliminate this noise[27]. This can be done during each sampling interval or, more commonly, in successive scans. The simplest method is to average multiple B-frames, since all these factors will not be identical over the timescale of a frame
acquisition. Alternatively, and perhaps more usefully for this work, the spatially varying nature of the speckle across the image can be used to extract additional information about the sample micro-structure[28].
[image:7.595.99.510.52.540.2]One of the most attractive attributes of OCT is its ability to provide depth-resolved cross-sectional images. This means it has the capability of providing layer-by-layer information for use in defects analysis. In PA2200 for example, the typical penetration depth for quantitative use of OCT images is 200–400μm. Any void, crack or un-melted powder in this range can be identified and its dimensions can be measured. How-ever, the image depth will be different for different materials since it de-pends directly on the optical properties (absorption and scattering) of build materials and the wavelength of the OCT light source. This limita-tion to scanning depth can be overcome by performing real-time
layer-by-layer scanning, and wavelength tunable OCT systems can be built, to affordflexibility in optimizing the wavelength of the light source for application to specific materials, in order to achieve maximum imaging depth.
5. Conclusion
This study has demonstrated the feasibility of using OCT for investigating the surface topography and sub-surface structure of polymeric parts manufactured using SLS. Experiments reported here indicate:
• Typical penetration depths in the range 200–400μm are achievable in PA2200 using a commercially available EX1301 OCT system. • Through OCT it is possible to identify micro-structural variations in
the solid build. These may have resulted from feedstock contamina-tion or indeed the reuse of powder. Currently, in post-build NDE methods these observations could not be made.
• Preliminary comparisons between in-situ OCT and XCT of near surface defects indicate that similar results are achieved. However, unlike XCT, OCT conducted in a discrete layer-by-layer approach is a viable technique for performance monitoring.
• Specifically, investigation of 4 sets of samples designed to mimic defects or features commonly found in parts produced by SLS demonstrated: 1)b9μm lateral resolution of surface defects such as roughness and local protuberances, 2) roughness and dimensions of open voids built into the part's surface, 3) capability to distinguish between loose and sintered powder ~200μm below the surface and resolve individual particles down to 30μm diameter, 4) size and roughness of voids locatedN100μm below the surface.
OCT could therefore present a viable route to real-time, in-situ pro-cess monitoring and control during SLS.
Acknowledgements
[image:8.595.93.493.54.460.2]The authors acknowledge the grants gratefully received from the UK Engineering & Physical Sciences Research Council (EPSRC), references EP/L017016/1 and EP/L01713X/1. A. T. Clare and K. M. Groom also acknowledge the support provided through the EPSRC Early Careers Forum in Manufacturing Research, through which this collaboration was conceived.
References
[1] I. Gibson, D.W. Rosen, B. Stucker, Additive Manufacturing Technologies, Springer, 2010. [2] P.F. Jacobs, Rapid Prototyping & Manufacturing: Fundamentals of Stereolithography,
Society of Manufacturing Engineers, 1992.
[3] J.-P. Kruth, Material incress manufacturing by rapid prototyping techniques, CIRP Ann. Manuf. Technol. 40 (2) (1991) 603–614.
[4] N. Tukuru, et al., Rapid prototype technique in medicalfield, Res. J. Pharm. Technol. 1 (4) (2008) 341–344.
[5] J. J. Beaman, and C. R. Deckard, Selective Laser Sintering With Assisted Powder Handling, Google Patents (1990).
[6] C. R. Deckard, Method and Apparatus for Producing Parts by Selective Sintering, Google Patents (1989).
[7] K. Tan, et al., Scaffold development using selective laser sintering of polyetheretherketone–hydroxyapatite biocomposite blends, Biomaterials 24 (18) (2003) 3115–3123.
[8] K. Tan, et al., Selective laser sintering of biocompatible polymers for applications in tissue engineering, Bio-Med. Mater. Eng. 15 (1) (2005) 113–124.
[9] J.M. Williams, et al., Bone tissue engineering using polycaprolactone scaffolds fabricated via selective laser sintering, Biomaterials 26 (23) (2005) 4817–4827. [10]J.T. Rimell, P.M. Marquis, Selective laser sintering of ultra high molecular weight
polyethylene for clinical applications, J. Biomed. Mater. Res. 53 (4) (2000) 414–420.
[11] N. Hopkinson, R. Hague, P. Dickens, Rapid Manufacturing: An Industrial Revolution for the Digital Age, John Wiley & Sons, 2006.
[12]T. Pereira, et al., Effect of process parameters on the properties of selective laser sintered poly (3-hydroxybutyrate) scaffolds for bone tissue engineering: this paper analyzes how laser scan spacing and powder layer thickness affect the morphology and mechanical properties of SLS-made scaffolds by using a volume energy density function, Virtual Phys. Prototyp. 7 (4) (2012) 275–285.
[13] T. Govett, K. Kim, M. Lundin, D. Pinero, Design Rules For Selective Laser Sintering, https://www.me.utexas.edu/~ppmdlab/files/designers.guide.sls.pdf
[14] G. Ziółkowski, et al., Application of X-ray CT method for discontinuity and porosity detection in 316L stainless steel parts produced with SLM technology, Arch. Civ. Mech. Eng. 14 (4) (2014) 608–614.
[15] F. Léonard et al., "Assessment by X-ray CT of the Effects of Geometry and Build Direction on Defects in Titanium ALM Parts."
[16]K. Grieve, et al., Ocular tissue imaging using ultrahigh-resolution, full-field optical coherence tomography, Invest. Ophthalmol. Vis. Sci. 45 (11) (2004) 4126–4131. [17]K. Grieve, et al., In vivo anterior segment imaging in the rat eye with high speed
white light full-field optical coherence tomography, Opt. Express 13 (16) (2005) 6286–6295.
[image:9.595.80.522.53.525.2][18] C. Li, et al., Detection and characterisation of biopsy tissue using quantitative optical coherence elastography (OCE) in men with suspected prostate cancer, Cancer Lett. 357 (1) (2015) 121–128.
[19] B.J. Vakoc, et al., Cancer imaging by optical coherence tomography: preclinical progress and clinical potential, Nat. Rev. Cancer 12 (5) (2012) 363–368. [20] T. Yonetsu, et al., Optical coherence tomography—15 years in cardiology, Circ. J. 77
(8) (2012) 1933–1940.
[21] S. Uemura, et al., Thin-capfibroatheroma and microchannelfindings in optical coherence tomography correlate with subsequent progression of coronary atheromatous plaques, Eur. Heart J. 33 (1) (2012) 78–85.
[22] J.P. Dunkers, et al., Optical coherence tomography of glass reinforced polymer composites, Compos. A: Appl. Sci. Manuf. 30 (2) (1999) 139–145.
[23] L. Thrane, et al., Application of optical coherence tomography (OCT) as a 3-dimensional imaging technique for roll-to-roll coated polymer solar cells, Sol. Energy Mater. Sol. Cells97(2012) 181–185.
[24] H. Liang, et al., En-face optical coherence tomography—a novel application of non-invasive imaging to art conservation, Opt. Express 13 (16) (2005) 6133–6144. [25]C. Song, P. Wang, H.A. Makse, A phase diagram for jammed matter, Nature 453
(7195) (2008) 629–632.
[26]C. Lu, et al., Handheld high speed 500 kHz swept source OCT device using a micro scanning mirror, Invest. Ophthalmol. Vis. Sci.54(6) (2013) 1489.
[27] J.W. Goodman, Some fundamental properties of speckle, JOSA 66 (11) (1976) 1145–1150.