The Harvard community has made this
article openly available.
Please share
how
this access benefits you. Your story matters
Citation Reinhart, Carmen M., Kenneth S. Rogoff, and Miguel A. Savastano,
2014. "Addicted to Dollars," Annals of Economics and Finance 15, no. 1: 1-50.
Citable link http://nrs.harvard.edu/urn-3:HUL.InstRepos:37907099
Terms of Use This article was downloaded from Harvard University’s DASH
ADDICTED TO DOLLARS
Carmen M. Reinhart Kenneth S. Rogoff Miguel A. Savastano
Working Paper 10015
http://www.nber.org/papers/w10015
NATIONAL BUREAU OF ECONOMIC RESEARCH 1050 Massachusetts Avenue
Cambridge, MA 02138 October 2003
Work on this paper started when the three authors were in the Research Department of the International Monetary Fund. Carmen Reinhart is now at the University of Maryland and the NBER, and Ken Rogoff is at Harvard University and the NBER. The opinions expressed in the paper are exclusively those of the authors and do not represent the views of the IMF. The authors are grateful to Ethan Ilzetzki and Kenichiro Kashiwase for excellent research assistance. The views expressed herein are those of the authors and are not necessarily those of the National Bureau of Economic Research.
JEL No. E42, E52, F40
ABSTRACT
Dollarization, in a broad sense, is increasingly a defining characteristic of many emerging market economies. How important is this trend quantitatively and how important is it for the conduct of monetary policy and the choice of exchange rate regimes? Though these questions have become a hot topic in both the theory and policy literature, most efforts are remarkably uninformed by evidence, in no small part because meaningful data has been lacking, except for a very narrow range of assets. This paper attempts to move the discussion forward and shed light on the critical questions by proposing a measure of dollarization that is broad both conceptually and in terms of country coverage. We use this measure to identify trends in the evolution of dollarization in the developing world in the last two decades, and to ascertain the consequences that dollarization has had on the effectiveness of monetary and exchange rate policy. We find that, contrary to the general presumption in the literature, a high degree of dollarization does not seem to be an obstacle to monetary control or to disinflation. A level of dollarization does, however, appear to increase exchange rate pass-through, reinforcing the claim that "fear of floating" is a greater problem for highly dollarized economies. We also review the developing countries' record in combating their addiction to dollars. Concretely, we try to explain why some countries have been able to avoid certain forms of the addiction, and examine the evidence on successful de-dollarization.
Carmen M. Reinhart
School of Public Affairs and Department of Economics Van Munching Hall University of Maryland College Park, MD 20742 and NBER
Kenneth S. Rogoff
Department of Economics Littauer Center
Harvard University Cambridge, MA 02138 and NBER
I.INTRODUCTION
Dollarization, in a broad sense, is increasingly a defining characteristic of many
emerging market economies. Governments often borrow in dollars, individuals can hold
dollar- denominated bank accounts, firms and households can borrow in dollars both
domestically and from abroad. How important is this trend quantitatively and what are its
implications for the conduct of monetary policy and the choice of exchange rate regimes?
For those countries that wish they weren't so dollarized; how easy is to scale back? These
questions have received a great deal of attention in both the theory and policy literature.
Most of the answers thus far, however, have not been too convincing. Competing definitions
of dollarization and, most importantly, lack of empirical support for the various hypotheses
advanced have conspired against the emergence of anything resembling a consensus.
This paper attempts to move the debate forward and shed light on the critical
questions. We propose a measure of dollarization that is broad both conceptually and in
terms of country coverage. We use this measure to identify trends in the evolution of
dollarization in the developing world in the last two decades, and to ascertain the
consequences that dollarization has had on the effectiveness of monetary and exchange rate
policy. We find that, contrary to the general presumption in the literature, a high degree of
dollarization does not seem to be an obstacle to monetary control or to disinflation.
Dollarization does, however, appear to increase exchange rate pass-through, reinforcing the
We then review the developing countries’ record in combating their addiction to
dollars. We try to explain why some countries have been able to avoid certain forms of the
addiction, and examine the evidence on successful de-dollarization. We find that this record
is not particularly encouraging; concretely, we are able to identify only two countries, out of
a total of 85, that managed to achieve large and lasting declines in domestic dollarization
without having to incur heavy costs in terns of financial disintermediation or capital flight.
II.WHAT IS A DOLLARIZED ECONOMY? The definition of a dollarized economy has become quite elusive in recent years. For
more than two decades up to the late 1990s the defining feature of a dollarized economy was
the fact that domestic residents held foreign currency or financial assets denominated in
foreign currency as part of their asset portfolio. After the Asia crises of the late 1990s,
however, the term dollarization—and dollarized economy—started to be used by many to
refer to the case of countries that did not issue a national currency, or that opted to replace
their national currency for a foreign, more stable, one.2 At about the same time a different
strand of literature developed the concept of liability dollarization, stressing the role that foreign currency borrowing by the private and public sectors had on the vulnerability of
emerging market economies to external shocks and, hence, on key aspects of macroeconomic
management.3
Terminology aside, it is relatively straightforward, both conceptually and empirically,
2 See, for example, Calvo (1999, 2000), Edwards (2001) and the collection of papers in Salvatore et al. (2003).
to establish a meaningful distinction between economies that do not have a national currency
and those where dollarization is only of a partial nature. Distinguishing between the two
other “types” of dollarization, however, is a much harder task. One reason for this is that,
broadly speaking, the two concepts of dollarization focus on different sides of the balance
sheet. Related complications are that the data used in empirical studies to gauge the presence
and/or macroeconomic effects of either concept of partial dollarization have serious
measurement problems, and that studies typically neglect the possible co-existence of both
phenomena.
Figure 1 helps illustrate the severity of these problems. The figure depicts the foreign
currency assets and liabilities of the private and public sector in a partially dollarized
economy. The four boxes in the upper left corner of the figure, the foreign currencyassets of households and firms, are the subject of analysis of the traditional literature on partial
dollarization. The newer literature on liability dollarization, by contrast, is primarily
concerned with entries on the right-side column; concretely, about the external foreign currency liabilities of households, firms, and the government.
Lack of reliable data on the various foreign currency assets and liabilities depicted in
the figure have constrained the measures of dollarization used in the empirical studies related
to both strands of literature. The traditional literature on partial dollarization, for example,
has adopted as a norm the use of foreign currency deposits in domestic banks—typically as a
ratio to some other monetary aggregate—as the “best” indicator of dollarization.4 Severe data
shortcomings have repeatedly thwarted attempts to construct a reliable measure of partial
dollarization that includes estimates of the other three foreign currency assets held by
A. Private Sector
B. Public Sector I. Households I. Households II. Firms II. Firms III. Banks III. Banks
IV. Central Bank
[image:7.612.126.487.217.707.2]V. Government
Figure 1. Foreign Currency Balance Sheet of a Partially Dollarized Economy
Foreign currency (FC) cash holdings
FC assets held abroad (incl. bank deposits)
FC-linked government debt
FC credit to households and firms
FC net credit to the government
Net international reserves
Foreign currency (FC) bank loans
FC deposits (households and firms)
Reserve requirements on FC bank deposits
Net FC bank credit FC-linked domestic debt External FC debt (bonds and loans) FC bank loans Domestic FC bonds
External FC debt (bonds and loans)
Assets (A) Liabilities (L)
FC-linked government debt
FC-linked government debt FC bank deposits
FC assets held abroad (incl. bank deposits)
Dollarization measure used in this study. Dollarization measure
used in previous studies.
Dollarization measure used in this study. Dollarization measure
used in previous studies.
households and firms in partially dollarized economies—including, importantly, cash
holdings of foreign currency.5
The problems with which the nascent empirical literature on liability dollarization is
confronted are at least as serious. Sectoral data on the foreign currency liabilities of different
economic agents, and on the linkages across the balance sheets of those agents, are simply
not available for the large majority of countries (see Allen et al. (2002)). The few empirical
studies on liability dollarization that exist have therefore relied on indirect measures (such as
the “pass-through” from the exchange rate to prices) rather than on quantity-based estimates
of external foreign currency liabilities to gather support for their key hypotheses.6
III. AN ENCOMPASSING MEASURE OF PARTIAL DOLLARIZATION
A key objective of this paper is to take advantage of, and shed light on, the
interconnection between the two competing concepts of partial dollarization. To this effect,
we define a partially dollarized economy as one where households and firms hold a fraction
of their portfolio (inclusive of money balances) in foreign currency assets and/or where the
private and public sector have debts denominated in foreign currency.7 This purposely broad
definition covers the majority of economies in the world, as it excludes a priori only those
5 The reliance on measures of dollarization that exclude cash holdings of foreign currency has created a serious disconnect between the theoretical concept of currency substitution that sparked the early empirical studies on dollarization and the findings of these studies. See Calvo and Végh (1992) and Savastano (1992) for early discussions of this problem.
6 See, for example, Calvo and Reinhart (2000a) and Hausmann, Panizza and Stein (2001).
7 The foreign currency need not be the U.S. dollar. Any economy where private sector assets and/or private or public sector debts are denominated in a currency different from the
countries or territories that are fully—or officially—dollarized.8 Because we are interested in
studying partial dollarization in the developing world, we do not include industrial countries
in our sample.9
To make the above definition operational we employ two devices: (i) we construct a
composite index of dollarization for every country in the sample; and (ii) we classify the
countries into four categories according to the variety—or “type”—of dollarization they
exhibit.
We define the composite index as the (normalized) sum of bank deposits in foreign
currency as a share of broad money, total external debt as a share of GNP, and domestic
government debt denominated in (or linked to) a foreign currency as a share of total domestic
government debt. Each of the three components is previously transformed into an index that
can take a value from 0 to 10. Hence, in the end, the composite index allows us to measure
the degree of partial dollarization of every country in the sample on a scale that goes from 0
to 30 (see Appendix I).
We determine the variety of dollarization prevalent in each country at any point in
time on the basis of two separate criteria: the degree of domestic dollarization and the
amount of foreign borrowing by the private sector. We gauge domestic dollarization by
8 The definition covers those countries that belong to a monetary union which have foreign (or domestic) debts denominated in a currency different from the currency of the union. Only those countries that were fully dollarized before 1980 were altogether excluded from the sample. See Edwards (2001) for a list of those countries.
9 Concretely, our country sample excludes all those defined as “Advanced Economies” in the IMF’s World Economic Outlook, except for Hong Kong, Israel, Korea, Singapore and
looking at the ratios of foreign currency deposits to broad money and of domestic
government debt in foreign currency to total government debt; countries are then divided in
two groups: those where both ratios are below 10 percent, and those where at least one of the
ratios exceeds 10 percent. To gauge the amount of private foreign borrowing we look at the
share of private sector debt in total external debt; here too, countries are divided in two
groups: those where private sector debt accounts for at least 10 percent of total external debt,
and those where the share is below 10 percent.
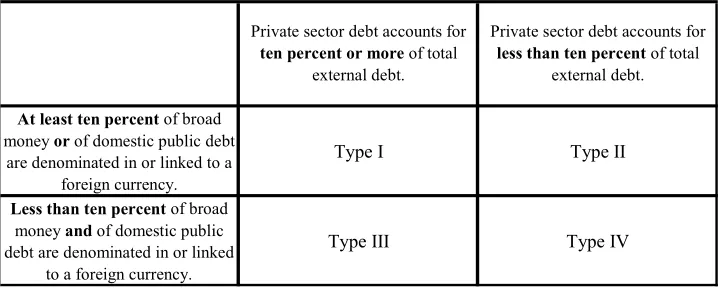
The two criteria put together allow us to classify the dollarized economies into four
categories or “types,” as shown in Table 1. Countries where domestic and external liability
dollarization co-exist are classified as Type I; countries where dollarization is predominantly
of a domestic nature (i.e., where foreign borrowing by the private sector is relatively small)
are classified as Type II; countries where dollarization is predominantly of an external nature
(i.e., where domestic dollarization is negligible) and private foreign borrowing is not small
are classified as Type III; and countries where domestic dollarization is low and where the
[image:10.612.127.486.550.694.2]bulk of the external liabilities are owed by the government are classified as Type IV.
Table 1. Varieties of Dollarization
At least ten percent of broad
money or of domestic public debt are denominated in or linked to a
foreign currency.
Type I Type II
Less than ten percent of broad
money and of domestic public debt are denominated in or linked
to a foreign currency.
Type III Type IV
Private sector debt accounts for
ten percent or more of total
external debt.
Private sector debt accounts for
less than ten percent of total
In our view, using the two-pronged approach just described to investigate the extent
and effects of partial dollarization in the developing world has a number of advantages
compared to the standard empirical study on partial dollarization.
First, it produces a measure of dollarization for every country that encompasses both
holdings of foreign currency assets by the private sector and the external foreign currency
liabilities of the economy.
Second, the inclusion of domestic government debt in foreign currency in the
composite index takes explicitly into account a form of domestic dollarization that has
become increasingly important in many countries and which has thus far been ignored by
studies on dollarization (Figure 2).10
And third, the approach relies on quantitative indicators easily applicable to all
countries to measure the degree and type of dollarization, hence reducing the scope for
introducing bias in empirical analyses of the data caused by arbitrary manipulations of the
sample.
10 This variety of dollarization is of relatively recent vintage. Argentina in the 1980s and Mexico in the early 1990s were probably two of the first instances where governments of developing countries that had a national currency borrowed locally in dollar-indexed
instruments to finance their fiscal deficits. Governments of many countries, in Latin America and elsewhere, have adopted a similar financing strategy since then. In fact, figure 2 shows that, as of end-2001, a total of 22 countries had more than US$ 230 billion of debt
Of course, our methodology also has shortcomings. Three of these are worth
discussing briefly.
First, owing mainly to lack of data, the composite index understates the “true” degree
of dollarization in every economy. On the asset side, it does not account either for the cash
holdings of foreign currency or for the deposits households and firms maintain in banks
abroad (see Figure 1). The downward bias that these omissions impart to the measure of
dollarization may be significant for many countries.11 On the liability side, the composite
index does not include local borrowing in foreign currency by the private sector. The
omission of bank loans in foreign currency is in part deliberate, out of concerns that their
11 For estimates of the amount of US dollars in circulation in emerging economies, and their implications for the measures of dollarization, see Kamin and Ericsson (1993), Feige (1996), Feige et al. (2003), and Oomes (2003).
[image:12.612.154.454.142.337.2]Source: see Appendix I.
Figure 2. Locally Issued Government Debt in Foreign Currency: 1996-2001 10 12 14 16 18 20 22 24
1996 1997 1998 1999 2000 2001
N um be r o f c oun tr ie s 0 50 100 150 200 250 300 T ota l U S$ B illio ns Total Debt US$ Billion (right scale)
Number of countries
inclusion would introduce double-counting.12 The omission of other forms of local borrowing
in foreign currency (e.g., locally issued corporate bonds denominated in foreign currency),
however, is due exclusively to lack of data.
Second, the ratio of external debt to GNP and the share of private sector debt in total
external debt are admittedly coarse measures of external liability dollarization that do not
allow to gauge accurately the size and/or propagation of sectoral balance sheet effects.
And third, the composite index combines variables that are generally not determined
or explained by the same set of economic and/or institutional factors. For example, a past
history of macroeconomic instability and high inflation is likely to be one of the root causes
of a high degree of domestic dollarization, but would probably not be a good predictor of the
size of a country’s external debt.
Of the three shortcomings just mentioned, the last one is probably the least
worrisome. The reason is that, because it measures dollarization along two different
dimensions (degree and variety), our two-pronged methodology has the flexibility to test and
cross-check any given hypothesis using all or part of the sample. Illustrating the usefulness
of the methodology for ascertaining whether the regularities and trends in the data depend on
the degree and/or type of dollarization is, in fact, a key objective of the empirical analyses of
the following two sections.
IV.THE WORLDWIDE SPREAD OF THE ADDICTION The application of the dual classification approach described above reveals a number
of interesting trends in the evolution of dollarization in developing countries over the last two
decades.
One fact that stands out is the notable increase in the degree and incidence of
dollarization that has occurred in the developing world between the early 1980s and the late
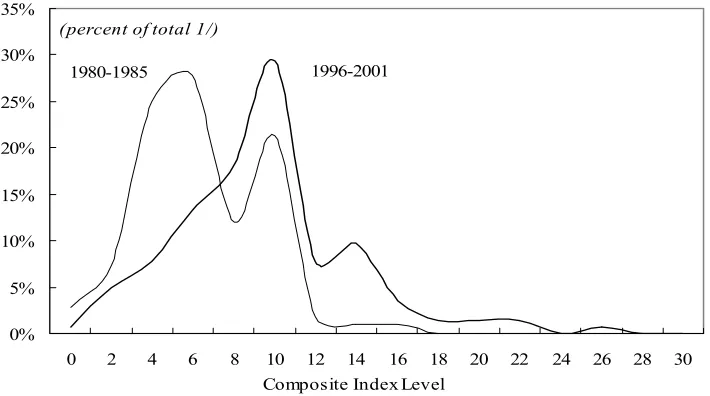
1990s. Indeed, Figure 3 shows that the frequency distribution of the composite dollarization
index (computed using five-year averages for each country) has shifted markedly to the right
between 1980-85 and 1996-2001. What this shift indicates is that the degree of dollarization
in developing countries has risenduring that period. The number of economies with a
composite index higher than 12, for example, was much larger in 1996-2001 than during
1980-85. The rising dollarization of bank deposits in many countries and the increased
reliance on dollar-linked domestic debt by governments account for the bulk of the recorded
increases in the composite index.
0% 5% 10% 15% 20% 25% 30% 35%
0 2 4 6 8 10 12 14 16 18 20 22 24 26 28 30
(percent of total 1/)
[image:14.612.146.501.508.706.2]Composite Index Level 1996-2001 1980-1985
Figure 3. Dollarization in the Developing World: The early 1980s and the late 1990s
Source: See Appendix I.
The higher incidence of dollarization—i.e., the increase in the number of partially
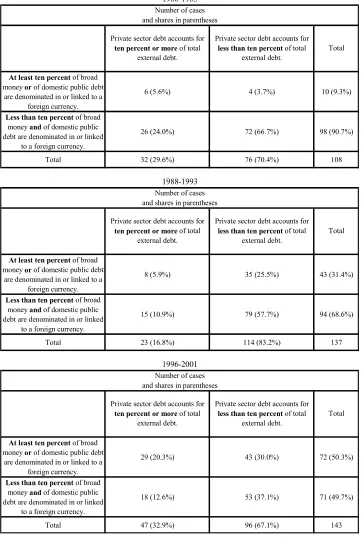
dollarized economies—is captured by Table 2. According to the table, in the early 1980s less
than 10 percent of the countries in our sample exceeded the low thresholds of domestic
dollarization utilized to classify an economy as Type I or Type II; in the late 1990s, however,
more than one-half of the sample exceeded one or both of those thresholds. The table also
shows that two thirds of the countries were classified as Type IV economies in the early
1980s, which implies that, not so long ago, external liability dollarization of government
debts was the predominant variety of dollarization in the developing world. By the late
1990s, however, the share of Type IV economies had fallen to almost one third.
The addition of new countries to the sample in the 1990s, especially the Transition
Economies, and the increased availability of data on the variables used to construct the
composite index, have indeed contributed to the changes in the aggregate indicators of
dollarization reported in Table 2. Nonetheless, it is still the case that by the late 1990s ninety
developing countries (almost two thirds of the sample) exhibited varieties of dollarization
1980-1985
At least ten percent of broad money or of domestic public debt
are denominated in or linked to a foreign currency.
6 (5.6%) 4 (3.7%) 10 (9.3%)
Less than ten percent of broad money and of domestic public debt are denominated in or linked
to a foreign currency.
26 (24.0%) 72 (66.7%) 98 (90.7%)
Total 32 (29.6%) 76 (70.4%) 108
1988-1993
At least ten percent of broad money or of domestic public debt
are denominated in or linked to a foreign currency.
8 (5.9%) 35 (25.5%) 43 (31.4%)
Less than ten percent of broad money and of domestic public debt are denominated in or linked
to a foreign currency.
15 (10.9%) 79 (57.7%) 94 (68.6%)
Total 23 (16.8%) 114 (83.2%) 137
1996-2001
At least ten percent of broad money or of domestic public debt
are denominated in or linked to a foreign currency.
29 (20.3%) 43 (30.0%) 72 (50.3%)
Less than ten percent of broad money and of domestic public debt are denominated in or linked
to a foreign currency.
18 (12.6%) 53 (37.1%) 71 (49.7%)
Total 47 (32.9%) 96 (67.1%) 143
and shares in parentheses Private sector debt accounts for
ten percent or more of total external debt.
Private sector debt accounts for
less than ten percent of total external debt.
Total Private sector debt accounts for
ten percent or more of total external debt.
Private sector debt accounts for
less than ten percent of total external debt.
Total
Number of cases
Total Number of cases
and shares in parentheses Private sector debt accounts for
ten percent or more of total external debt.
Private sector debt accounts for
less than ten percent of total external debt.
Number of cases and shares in parentheses
[image:16.612.127.488.112.651.2]Another important fact unveiled by our dual classification approach is the large
regional variation that has characterized the spread, degree, and varieties of dollarization in
developing countries during the last two decades. Table 3 illustrates this feature of the
process of dollarization. The table shows that the average degree of dollarization in Africa
has been similar to that prevalent in the Western Hemisphere throughout the years. However,
the dollarization experienced by most African countries has been of the type IV variety. In
terms of domestic dollarization—i.e., foreign currency bank deposits and domestic
government debt in foreign currency—Africa has consistently been the least dollarized
region of the world, followed by Asia.
Table 3 also shows that domestic dollarization has been consistently high in the
Middle East since the early 1980s, and in the Transition Economies since the early 1990s.
Moreover, in the latter group the average composite index more than doubled, and reached
levels similar to the average for the Western Hemisphere, in less than a decade. Lastly, the
table shows that dollarization has spread at a fairly steady pace across the three sub-regions
of the Western Hemisphere since the 1980s, and that South America has consistently been
Table 3. Varieties and Degrees of Dollarization, By Region: 1980-20011
1980-1985
Number of countries
Total Types I-III Type IV
(scale: 0-30) (percent) (percent) (percent)
Africa 43 5 38 6 0 67 3
Emerging Asia 23 10 13 4 3 53 8
Middle East 13 6 7 5 11 38 4
Transition Economies 0 0 0 0 0 33 0
Western Hemisphere 29 15 14 6 5 60 10
of which:
Caribbean 12 1 11 4 1 75 1
Central America 6 4 2 7 1 54 8
South America 11 10 1 7 10 58 20
Total 108 36 72
1988-1993
Number of countries
Total Types I-III Type IV
(scale: 0-30) (percent) (percent) (percent)
Africa 46 7 39 8 2 114 2
Emerging Asia 26 14 12 6 8 88 7
Middle East 14 10 4 8 20 66 11
Transition Economies 22 15 7 4 17 37 3
Western Hemisphere 29 12 17 8 13 106 4
of which:
Caribbean 12 2 10 6 4 198 1
Central America 6 2 4 8 11 101 4
South America 11 8 3 9 23 61 8
Total 137 58 79
1996-2001
Number of countries
Total Types I-III
Type IV
(scale: 0-30) (percent) (percent) (percent)
Africa 48 15 33 9 7 126 3
Emerging Asia 26 16 10 7 11 91 13
Middle East 14 12 2 8 21 60 19
Transition Economies 26 26 0 9 29 50 19
Western Hemisphere 29 21 8 10 23 62 11
of which:
Caribbean 12 5 7 6 11 101 1
Central America 6 5 1 10 24 55 4
South America 11 11 0 14 35 47 27
Total 143 90 53
Foreign currency deposits to broad
money
Total External Debt
to GDP
Share of Private debt in total external debt Composite Dollarization Index Composite Dollarization Index Foreign currency deposits to broad
money
Total External Debt
to GDP
Share of Private debt in total external debt
Composite Dollarization Index
Foreign currency deposits to broad
money
Total External Debt
to GDP
Share of Private debt in total external debt
Source: See Appendix I.
As we have said, distinguishing among four varieties of dollarization facilitates the
identification of key empirical regularities in dollarized economies. Hypotheses concerning
the link between monetary policy and dollarization, for example, would seem a priori more applicable to countries that exhibit the first three varieties (types) of dollarization than to
those classified as Type IV economies. The reason is that, conceptually, the relationship
between government foreign borrowing—the primary form of dollarization in Type IV
economies—and monetary policy is generally tenuous and weak, especially in cases where
the public sector borrows mainly from official creditors. Empirical analyses of the links
between monetary policy and dollarization, therefore, should probably exclude Type IV
economies from the sample in order to obtain meaningful results.
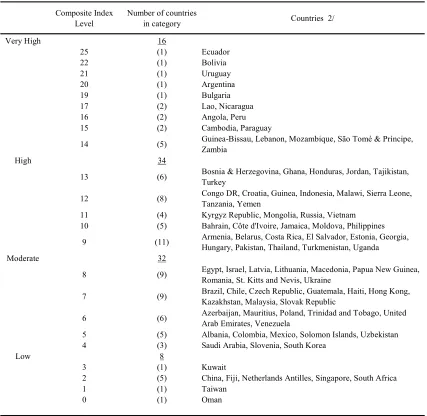
Table 4 lists the ninety economies that comprise the sample of Type I to Type III
economies for the period 1996-2001, ranked by the average value of the composite
dollarization index. (The same economies grouped according to their variety of dollarization
are listed in Appendix II.) 13
The individual averages reported in the table reveal a fair amount of inter-regional
and intra-regional variation in the degree of dollarization. For example, less than 50 percent
of the countries with a composite index of 14 or higher (the group with “very high”
dollarization) are from the Western Hemisphere,14 whereas close to one third of the fifty
13 As noted earlier, the degree and variety of dollarization of each individual country was rarely the same in the early 1980s and in the late 1990s; the problems this presents for conducting empirical analyses are discussed in the following section.
14 Ecuador recorded the highest degree of dollarization during this period (25 out of a maximum of 30) largely because it adopted the U.S. dollar as legal tender in the year 2000 and, hence, scored a 10 in two of the three components of the composite index in the last two
countries with a composite index of 9 or higher (the groups where dollarization was “high”
or “very high”) are Transition Economies, from both Asia and Europe.
[image:20.612.90.517.186.602.2]years used to calculate the average. Contrary to most other countries at the top of Table 4, Ecuador did not exhibit a high degree of dollarization in the early 1990s.
Table 4. Degrees of Dollarization: Composite Scores, 1996-2001 1/
Composite Index Level
Number of countries
in category Countries 2/
Very High 16
25 (1) Ecuador
22 (1) Bolivia
21 (1) Uruguay
20 (1) Argentina
19 (1) Bulgaria
17 (2) Lao, Nicaragua
16 (2) Angola, Peru
15 (2) Cambodia, Paraguay
14 (5) Guinea-Bissau, Lebanon, Mozambique, São Tomé & Príncipe, Zambia
High 34
13 (6) Bosnia & Herzegovina, Ghana, Honduras, Jordan, Tajikistan, Turkey
12 (8) Congo DR, Croatia, Guinea, Indonesia, Malawi, Sierra Leone, Tanzania, Yemen
11 (4) Kyrgyz Republic, Mongolia, Russia, Vietnam 10 (5) Bahrain, Côte d'Ivoire, Jamaica, Moldova, Philippines
9 (11) Armenia, Belarus, Costa Rica, El Salvador, Estonia, Georgia, Hungary, Pakistan, Thailand, Turkmenistan, Uganda
Moderate 32
8 (9) Egypt, Israel, Latvia, Lithuania, Macedonia, Papua New Guinea, Romania, St. Kitts and Nevis, Ukraine
7 (9) Brazil, Chile, Czech Republic, Guatemala, Haiti, Hong Kong, Kazakhstan, Malaysia, Slovak Republic
6 (6) Azerbaijan, Mauritius, Poland, Trinidad and Tobago, United Arab Emirates, Venezuela
5 (5) Albania, Colombia, Mexico, Solomon Islands, Uzbekistan 4 (3) Saudi Arabia, Slovenia, South Korea
Low 8
3 (1) Kuwait
2 (5) China, Fiji, Netherlands Antilles, Singapore, South Africa
1 (1) Taiwan
0 (1) Oman
Source: See Appendices I and II.
V. DOLLARIZATION AND MONETARY POLICY--MUCH ADO ABOUT NOTHING? A view widely held among economists and policymakers is that partial dollarization
makes monetary policy more complex and less effective. A recent IMF Occasional Paper
summarized this view when it stated: “The phenomenon of dollarization poses a challenge to the pursuit of a coherent and independent monetary policy” (Baliño et al., 1999, page 14). Similar assertions can be easily found in numerous surveys and studies on partial
dollarization.
The conventional view is primarily anchored on theoretical results from the early
literature on currency substitution, and on the fact that the first documented cases of partial
dollarization in the developing world occurred in high inflation countries, especially from
Latin America.15 However, a closer look at the currency substitution models and at the
empirical studies based on those models reveals a rather weak support for the view that
dollarization hinders the effectiveness of monetary policy.
The early theoretical models of currency substitution did produce important results concerning the effects that the presence of foreign currency could have on the exchange rate
and monetary policy of an economy that issued its own national currency. Many of those
results have survived the passage of time and the adoption of new modeling techniques.16
Nonetheless, it has been clear at least since Thomas (1985) that currency substitution is not
15 Ortiz (1983) and Ramírez-Rojas (1985) were two of the first studies of the now vast empirical literature on dollarization inspired on currency substitution models.
the same as asset dollarization, and that some of the results obtained from models of currency
substitution hinged critically on the assumption that the demand for foreign currency
represents primarily a demand for a second means of payment rather than for another
financial asset.
The vast empirical literature on dollarization in developing countries inspired by the early models of currency substitution has focused primarily on ascertaining whether the
relative holdings of foreign money to domestic money (the “dollarization ratio”) in one or
many countries can be explained by relative rates of return of the two monies, and several
other variables. These studies generally have found that relative rates of return are indeed an
important determinant of a number of variants of the dollarization ratio. Oftentimes,
however, authors have used those results as a platform for making inferences about issues
related to monetary policy that normally were implicit in the model used to derive the
equations that were estimated in the studies, but that had not been tested directly--see
Savastano (1996).
The new theoretical literature on liability dollarization also has produced results relevant for monetary policy. Of these, one that has attracted considerable attention is the
association between liability dollarization and “fear of floating.” That is, the conjecture that
the presence of liability dollarization—i.e., of private sector debts in foreign currency—will tend to make countries less tolerant to large exchange rate changes, out of concern of the
adverse effects those changes may have on sectoral balance sheets and, ultimately, on
aggregate output.17 This key result has clear implications for monetary policy, in particular
for the relationship between interest rates and exchange rate shocks and for the scope for
countercyclical monetary policy. Nonetheless, these models do not find nor claim that
monetary policy is ineffective to control inflation, or particularly difficult to conduct in
practice.
As in the studies from the earlier strand, the main focus of the empirical work on liability dollarization has not been to test the effectiveness of monetary policy per se, but rather to detect and explain systematic differences in monetary policy responses across
countries. Also as in the earlier literature, the results obtained by these newer (and fewer)
studies are broadly supportive of their main hypotheses, as they tend to find systematic
differences in responses of monetary policy across countries that are generally consistent
with the hypothesis of fear of floating.18 However, these studies have been less prone to
make inferences about aspects of monetary policy that had not been tested directly. And
typically have not interpreted their finding of systematic differences across countries in the
responses of monetary policy as evidence of higher complexity or lower effectiveness of
monetary policy, especially for inflation control.
Surprisingly, growing evidence of the persistence of domestic dollarization in
countries where inflation was successfully abated does not seem to have weakened the
conventional view regarding the presumed ineffectiveness of monetary policy in dollarized
economies. Following the seminal study by Guidotti and Rodriguez (1992) several authors
have documented that large and sustained falls in inflation generally have not been not
followed by a decline in domestic dollarization.19 Moreover, a number of studies have
explored the reasons for this empirical regularity--e.g., Uribe (1997), Ize and Levy-Yeyati
(1998). The starting point for much of this literature has been the premise that high
dollarization can indeed co-exist with low inflation; that is, that dollarization does not
preclude monetary policy from attaining, and maintaining, its primary goal. It is not easy to
reconcile this prima facie evidence of the effectiveness of monetary policy in partially dollarized economies with the notion that monetary policy is more challenging and/or less
effective in the presence of dollarization. Nonetheless, that notion has tended to prevail.
It seems to us that further empirical work focused on the distinctive features of
monetary policy in dollarized economies is needed to elicit a much needed revision of this
entrenched conventional view. The dual classification approach developed in this paper is,
we think, ideally suited for this task.
Another look at the effectiveness of monetary policy
In this sub-section and the next we present new evidence on the effectiveness and
channels of monetary policy in partially dollarized economies. Our goal is to shed further
light on the influences that dollarization exerts on monetary policy, taking advantage of our
proposed broad definition of a dollarized economy and of our criteria for classifying those
economies according to their degree and variety of dollarization.
The methodology we followed is fairly simple, and consists, for the most part, of
using summary indicators for different groups and samples of dollarized economies to
identify similarities and differences regarding key aspects of monetary policy. A strength of
the methodology is that it allows us to assess the evidence in support of any given hypothesis
or conjecture using data from many different sub-samples.20 An obvious shortcoming is that,
with one exception, we do not use formal econometric tests to properly control for the direct
and indirect influences that other variables typically exert on any given indicator of monetary
policy. Overall, we think that the gains we derive from the broad scope and
multi-dimensional nature of our analysis outweigh the loss stemming from its lack of accuracy.
Especially since our main goal is to help place future discussions and research on
dollarization in the right context, rather than provide firm and definitive evidence on the
consequences of dollarization for monetary policy.
The logical place to start any assessment of monetary policy is to examine the
policy’s track record in delivering the main goals it is supposed to attain. There is little
dispute that the overriding goal of monetary policy is to attain and maintain a low and stable
rate of inflation, and that another important goal is to reduce the volatility of aggregate
output--e.g., Fischer (1994). Most theoretical and empirical models of monetary policy of
the last two decades have summarized this wide consensus by expressing the objective
function of the monetary authority in terms of two main goals: the rate of inflation and a
measure of output fluctuations—both expressed relative to some target or trend--e.g., Barro
and Gordon (1983), Rogoff (1985).
It is well known that the track record of developing countries as a whole in complying
with those two main objectives of monetary policy is fairly unimpressive, especially until the
mid-1990s. Overall, the evidence for the sample of dollarized economies used in this study
corroborates this well known fact. The evidence, however, also unveils a number of
important patterns associated with particular degrees and/or varieties of dollarization.
With regard to the primary goal of monetary policy, the evidence in Tables 5 and 6
shows that the average inflation rate is consistently higher and more variable in countries
with a high degree of dollarization than in countries where the degree of dollarization is low
or moderate, in both the long and the short samples. The evidence also shows that, excluding
Brazil, average inflation is the lowest in countries where dollarization is predominantly of the
external variety (Type III economies). A third regularity captured in these tables is that
average inflation tends to be much lower and less volatile in the years 1996-2001 than in the
sample covering the earlier period, reflecting the generalized fall in inflation in the
developing world since the mid-1990s.
Clear patterns for output volatility and output growth are more difficult to detect. The
one consistent regularity is that output growth is highly volatile in economies with external
liability dollarization (Type III economies). The relation between output behavior and the
degree of dollarization, however, is different in the two samples. In the long sample, average
Table 6. Dollarization, Inflation and Output: Short Sample 1/
Very high High Moderate Low Type I Type II Type III Inflation
average 91.5 35.5 14.6 3.1 14.3 54.1 7.4
excluding Angola 31.7
standard deviation 157.2 33.8 10.4 1.6 12.2 73.9 4.2
excluding Angola 45.7
GDP growth
average 3.1 3.7 3.5 3.6 3.5 3.8 3.0
standard deviation 3.8 4.6 3.1 2.9 3.2 4.0 3.8
Number of countries 15 30 36 10 29 43 18
1/ All countries classified as Types I, II and III with an index of composite dollarization during the period 1996-2001
By degree of By type of
dollarization dollarization
High-to-
Low-to-very high moderate Type I Type II Type III
Inflation
average 134.3 33.7 147.1 35.5 42.9
excluding Brazil 16.4 8.8
standard deviation 366.1 40.6 405.0 54.5 58.8
excluding Brazil 14.1 7.0
GDP growth
average 2.7 3.7 3.1 3.1 3.9
standard deviation 4.2 4.7 4.7 5.3 5.3
Number of countries 15 30 13 12 17
[image:27.612.91.539.426.636.2]1/ All countries classified as Types I, II and III for which the series of the composite dollarization index exists for most of the period 1980-2001—see Appendix I.
Table 5. Dollarization, Inflation and Output: Long Sample 1/
dollarization
By degree of By type of
However, in the short sample output growth is markedly more volatile in economies where
dollarization is high, while the average growth performance is broadly similar in countries
with high and low degrees of dollarization.
The ability to raise revenues from seigniorage is another benchmark commonly used
in the literature to assess the effectiveness of monetary policy, or the value of monetary
autonomy, in developing countries.21 The theoretical foundations of this common practice
are not nearly as solid as those that justify treating the inflation rate and output stability as the
main goals of monetary policy. 22 Consider, for example, the optimal inflation tax models.
Those models implicitly assume that the central bank is little more than a tax collection
agency for the government. Such assumption may be reasonable in countries or situations of
extreme fiscal dominance (e.g., during periods of very high inflation) but not in general, as it
precludes making any meaningful distinction between monetary policy and fiscal policy.
It turns out that the revenues from seigniorage do not differ much across the various
categories of dollarized economies, especially in the late 1990s. In fact, Table 7 shows that
from 1996 to 2001 the average revenue from money creation across the various groups of
dollarized economies ranged from 1½ to 2 percent of GDP and that the variability of those
revenues across groups was also fairly similar. There are, however, a couple of differences
among the groups that are worth noting. First, reflecting their different inflation performance,
21 For example, see Cukierman (1992), Fry, et al. (1996) and Berg and Borensztein (2000).
revenues from seigniorage are systematically higher in countries with a high degree of
dollarization than in countries with low or moderate dollarization. And second, average
seigniorage revenues are higher in countries where dollarization is predominantly of the
domestic variety (Type II economies) than in countries with the other two types of
dollarization.
Table 7. Dollarization and Revenues from Seigniorage 1/ (in percent of GDP)
By degree of By type of dollarization dollarization
high-to-
low-to-very high moderate Type I Type II Type III Long sample 2/
Seigniorage (average) 2.60 1.40 1.98 2.98 1.06
standard deviation 2.37 2.08 1.96 3.15 1.86
Short sample 3/
Seigniorage (average) 2.13 1.41 1.40 2.09 1.73
standard deviation 1.68 1.38 1.25 1.59 1.68
1/ Seigniorage calculated as the annual change in base money divided by nominal GDP, except in Argentina, Chile, Israel and Uruguay--see Appendix I.
2/ All countries classified as Types I, II and III for which the series of the composite dollarization index exists for most of the period 1980-2001--see Appendix I.
3/ All countries classified as Types I, II and III with an index of composite dollarization during the period 1996-2001--see Appendix II.
Successful disinflations provide another yardstick against which to assess the relation
between dollarization and the effectiveness of monetary policy. Our sample of dollarized
per year or more to single digits during the period 1980-2001.23 Three salient features stand
out from the examination of these episodes.
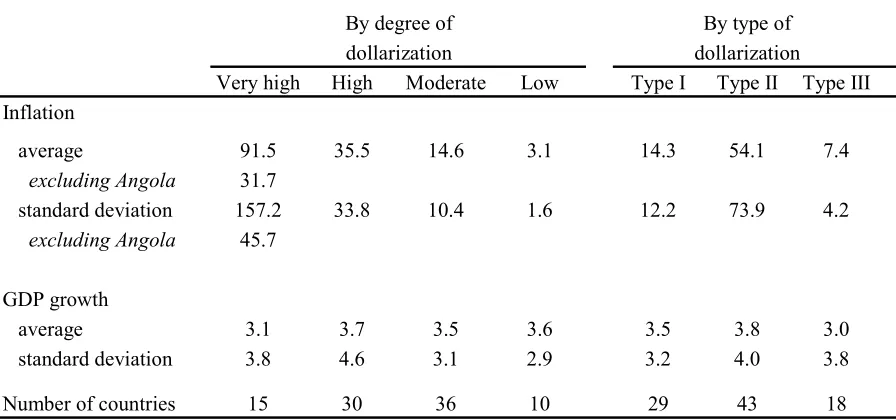
First, the degree of dollarization had no discernible effects on the duration of the
disinflation. Specifically, the time it took these 17 countries to bring inflation down to single
digits does not seem to have been influenced by whether dollarization was high or low at the
time of the inflation peak (Figure 4, top chart). Except for Israel, which took almost 13 years
to bring annual inflation below 10 percent, countries that had a high degree of dollarization
when inflation was high did not take a much longer time to disinflate than countries with a
lower degree of dollarization.
Second, the degree of dollarization at the time of the inflation peak does not appear to
have influenced the growth performance during the disinflation. In fact, average output
growth during the disinflation period in those countries where dollarization was relatively
low at the time of the inflation peak is not vastly different from the average growth
performance during the disinflation in countries that had a high degree of dollarization
(Figure 4, bottom chart).
And third, successful disinflations generally have not been accompanied by large
declines in the degree of dollarization. In fact, the top panel of Figure 5 shows that the degree
of dollarization at the end of the disinflation was the same or higher than at the time of the
inflation peak in more than half of the episodes. Moreover, the fall in the degree of
dollarization in many of the other episodes was generally small. This persistence of the
23 The seventeen countries are: Argentina, Bolivia, Brazil, Bulgaria, Costa Rica, Dominican Republic, Guatemala, Indonesia, Israel, Kenya, Mauritius, Mexico, Nigeria, Peru,
0 5 10 15 20 25
0 2 4 6 8 10 12 14
Number of Years Between Peak Inflation and Single Digit Inflation Rates
C om pos ite D olla ri za tion I nde x a t I nf la tion Pe ak
Dollarization has had no clear effects on the duration of disinflations,
0 5 10 15 20 25
-6.0% -4.0% -2.0% 0.0% 2.0% 4.0% 6.0% 8.0%
Percent Growth in Real GDP During Disinflation Period 1/
C om pos ite D olla ri za tion I nde x a t I nf la tion Pe ak
or on GDP growth during disinflation.
[image:31.612.110.504.172.381.2]dollarization process is consistent with the evidence on “hysteresis” found by the studies
mentioned earlier—which were based on a narrower measure of domestic dollarization.
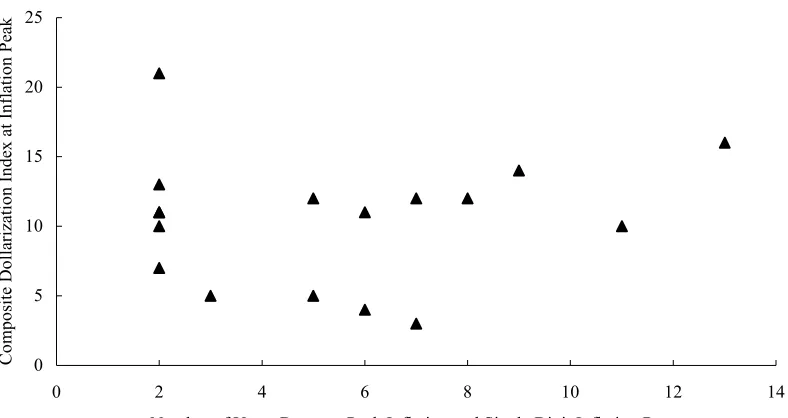
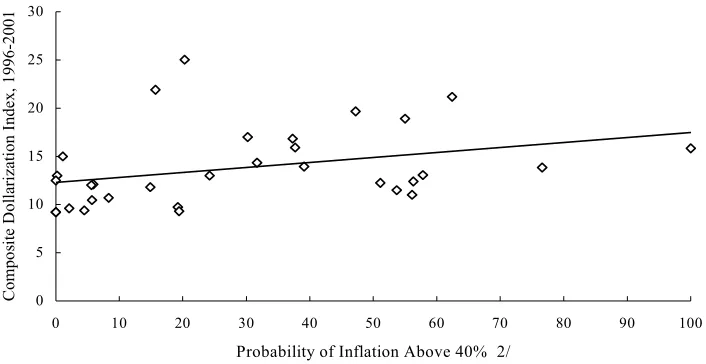
The persistence of dollarization is a regularity that is also present in the larger sample
of dollarized economies, and tends to be associated with the countries’ inflation history. In
fact, countries that had repeated bouts of high inflation over the last few decades generally
exhibited a higher degree of dollarization in the late 1990s than countries with a better
inflationary history (Figure 5, lower panel). Interpreting the (unconditional) probability of
high inflation used in Figure 5 as a rough measure of monetary policy credibility gives some
insights as to why achieving low inflation is generally not a sufficient condition for a rapid
fall in the degree of dollarization; namely, a country with a poor inflationary history will
need to maintain inflation at low levels for a long period before it can significantly reduce the
probability of another inflation bout.24
The lower panel of Figure 5 also sheds light on the relationship between current
levels of dollarization and the countries’ exchange rate history. Parallel market exchange
rates and pervasive exchange controls have been the norm rather than the exception in
countries with a history of high inflation. Conversely, very few countries with hard pegs and
unified exchange rates have experienced bouts of high inflation.25 The evidence thus suggests
24 The following section examines in detail the experience of countries that have recorded large declines in their degree of domestic dollarization, including in the context of
disinflations.
a link between current levels of dollarization and countries’ past reliance on exchange
[image:33.612.132.485.483.665.2]controls and multiple currency practices.
Figure 5. The Persistence of Dollarization
1/ End of disinflation period is defined as the year when the inflation rate fell below 10 percent. 2/ Unconditional probability computed with monthly data on inflation for the period 1958-2001.
0 5 10 15 20 25 30
0 10 20 30 40 50 60 70 80 90 100
Probability of Inflation Above 40% 2/
Com po si te D ol lari zat ion I nde x, 1 996 -2 001
Current levels of dollarization are related to the country's history of high inflation.
0 5 10 15 20 25
0 5 10 15 20 25
Composite Dollarization Index at End of Disinflation Period 1/
C om pos it e Dol la riz at ion I nde x a t I nf la tion P ea k
Disinflation has had no clear effects on the degree of dollarization.
A look at the channels of monetary policy
Interest rates, monetary aggregates and the exchange rate are widely regarded as the
three main channels through which monetary policy affects the economy. Even for industrial
countries, however, there is considerably less consensus about the relative importance and
role of those three channels in the monetary transmission process than there is about the main
goals of monetary policy (Mishkin (1995)). For developing countries, where research on the
monetary transmission process is much thinner, consensus is far more elusive. In fact, the
wide disparities in financial deepening, fiscal dominance and integration to capital markets,
and the uneven pace at which reform in those areas has proceeded in different countries and
regions have held back progress in identifying the distinctive features of the monetary
transmission mechanism in developing economies.26
There is particularly little analysis on the interest rate channel. Heavy reliance on
interest rate controls, capital controls and monetary financing of fiscal deficits until the late
1980s (and, in some cases, until much later) rendered the interest rate channel of monetary
transmission largely inoperative for many countries. Empirical research on this channel,
including the one sparked by the recent literature on liability dollarization, has therefore been
largely limited to the experience of the most advanced developing economies in the 1990s.
The problems surrounding empirical assessments of the other two channels are
somewhat less severe. Money aggregates have gradually lost prominence in the monetary
policy frameworks of many advanced developing economies that have attained low inflation,
but in most non-industrial countries remain a core channel of transmission and continue to be
used in the formulation of monetary policy. Furthermore, it is not too difficult to obtain
reliable data on these aggregates for the majority of countries. Empirical analyses of the
exchange rate channel, on the other hand, are constrained by some of the factors that hinder
assessments of the interest rate channel, such as the high inflation and capital controls
prevalent in many developing economies until the late 1980s. Nonetheless, those obstacles
have become much less serious in recent years, and problems of data availability are not
nearly as limiting as those affecting interest rate series.27
Reflecting this state of affairs, our analyses of the effects of dollarization on the
monetary transmission process in dollarized economies focused primarily on the money
aggregate channel. This allowed us to empirically assess whether the changes in this channel
that were central to many theoretical predictions of the early literature on dollarization—
namely, that dollarization affects the level and variability of money velocity, as well as the
link between money and national income—were borne out by the data. In addition, we used
data for the late 1990s to obtain estimates of the exchange rate “pass-through” and to
examine the links between dollarization and exchange rate regimes, two aspects of the
exchange rate channel important for both strands of the literature on partial dollarization.
Overall, the evidence on money velocity is fairly inconclusive. For a start,
dollarization does not seem to have had much influence on the volatility of base money
velocity. The standard deviation of the growth rate of base money velocity is broadly
similar, and quite high, in groups comprising countries with different degrees of dollarization
and different varieties of dollarization, in both the long and the short samples (Table 8). The
pattern is largely the same for velocity measures constructed with M1 (see Appendix III).
The volatility of broad money velocity, however, does differ across groups. In particular, the
velocity of broad money seems to be somewhat less volatile in economies with a low-to-
moderate degree of dollarization, as well as in countries where dollarization is predominantly
of the external variety (Type III economies). Taken together, these patterns suggest that
dollarization tends to increase the instability of broad money velocity (and, hence, of broad
money demand), but does not seem to increase the instability of velocity measures of narrow
monetary aggregates—i.e., of the aggregates often used in the formulation of monetary
policy in developing countries.
High-to-
Low-to-very high moderate Type I Type II Type III
Panel A. Long Sample 2/ Annual growth in velocity
base money 2.4 2.3 2.3 3.1 3.1
broad money 3/ -1.0 -0.4 -1.0 0.2 -0.3
Standard deviation
base money 19.4 20.2 23.9 21.5 19.9
broad money 3/ 15.3 13.2 16.8 15.3 10.3
Panel B. Short Sample 4/ Annual growth in velocity
base money -1.6 0.7 -0.8 -0.8 0.4
broad money 3/ -3.1 -1.6 -2.3 -1.5 -1.4
Standard deviation
base money 14.3 16.7 14.5 16.7 17.3
broad money 3/ 11.9 7.4 10.8 16.3 8.2
1/ Estimates of money velocity for two other monetary aggregates are reported in Appendix III. 2/ All countries classified as Types I, II and III for which the series of the composite dollarization index exists for most of the period 1980-2001—see Appendix I.
3/ Including foreign currency deposits, except in Type III countries.
[image:36.612.90.435.389.638.2]4/ All countries classified as Types I, II and III with an index of composite dollarization during the period 1996-2001—see Appendix II.
Table 8. Dollarization and Money Velocity 1/
By degree of By type of
The growth rates of money velocity for different monetary aggregates also exhibit
dissimilar patterns. The average velocity of broad money shows a steady decline in all
dollarized economies, in both the long and the short samples. The decline is most pronounced
in countries with a high degree of dollarization, and in those where both domestic and
external liability dollarization co-exist (Type I economies). In contrast, the average velocity
of base money shows an increase in the long sample, and a smaller decline than that of broad
money in the short sample. Two inferences can be made from this dissimilar behavior of
money velocity: first, the fall in the demand for domestic currency fueled by the high
inflation of the 1980s seems to have largely abated by the late 1990s; and second, the joint
existence of domestic and liability dollarization appears to have a positive effect on the
financial deepening of dollarized economies.
Clear differences in the effects of dollarization on the monetary channel across
dollarized economies are also difficult to detect on a wide range of money-growth
correlations.
Monetary aggregates are strongly correlated with the rate of inflation in all dollarized
economies (Tables 9-10). With a few exceptions—e.g., base money in economies with a low
degree of dollarization, and a couple of other cases (see Appendix III)—the correlations
between money and prices are uniformly high and statistically significant across all groups of
dollarized economies, in the two samples. This evidence, while admittedly rough and
tentative, is broadly consistent with the observed patterns on money velocity, and does not
give much support to the view that reining in monetary growth is not an effective
Table 9. Money Growth Correlations: Long sample 1/
By degree of By type of dollarization dollarization
high-to-
low-to-very high moderate Type I Type II Type III Pairwise correlations, 2/ Money growth with
Inflation
base money 0.61 0.23 0.44 0.41 0.26
broad money 3/ 0.73 0.48 0.61 0.44 0.43
GDP growth
base money -0.21 -0.02 -0.33 -0.14 0.16
broad money 3/ -0.13 0.00 -0.23 -0.13 0.33
Consumption growth
base money -0.31 -0.02 -0.25 -0.14 0.11
broad money 3/ -0.28 0.03 -0.17 -0.10 0.17
1/ All countries classified as Types I, II and III for which the series of the composite dollarization index exists for most of the period 1980-2001--see Appendix I.
2/ Contemporaneous correlations, average for the group. Number in bold indicates that correlations were statistically significant in more than one-half of the group. Correlations with other two monetary aggregates are reported in Appendix III.
3/ Including foreign currency deposits, except in Type III countries.
Table 10. Money Growth Correlations: Short sample 1/
By degree of By type of dollarization dollarization
very high high moderate low Type I Type II Type III Pairwise correlations, 2/ Money growth with
Inflation
base money 0.93 0.68 0.61 0.21 0.59 0.88 0.44
broad money 3/ 0.94 0.79 0.72 0.72 0.67 0.88 0.70
GDP growth
base money 0.10 -0.07 0.09 0.27 -0.04 0.02 0.30
broad money 3/ 0.14 -0.16 0.13 0.65 0.02 -0.03 0.28
Consumption growth
base money -0.11 -0.07 0.09 0.27 0.01 -0.09 0.17
broad money 3/ -0.08 -0.01 0.08 -0.32 -0.01 -0.06 0.13
1/ All countries classified as Types I, II and III with an index of composite dollarization for the period 1996-2001--see Appendix I.
2/ Panel correlations, contemporaneous. Statistically significant coefficients in bold. Correlations with other two monetary aggregates are reported in Appendix III.
The correlation between monetary aggregates and real variables in dollarized
economies, on the other hand, is either weak or non-existent. There is some evidence of a
positive and significant correlation between monetary aggregates and output growth in
economies with a low degree of dollarization and in those where dollarization is
predominantly external in the short sample (Table 10; Appendix III, Table 18). In all other
cases, however, and particularly in the long sample, the correlations between money and
aggregate output, and between money and real private consumption are not statistically
significant, and are oftentimes negative. Based on these results, we would conjecture that
factors different from dollarization are those that explain the low correlation between money
and real variables, and hence the limited scope for countercyclical monetary policy, in
developing countries.
We were able to find more conclusive evidence of systematic differences among the
various categories of dollarized when we analyzed the pass-through from exchange rate to
prices. Table 11 shows the results from panel regressions covering the period 1996-2001.
The results suggest that the inflationary impact of exchange rate changes was indeed
different across dollarized economies. Specifically, the pass-through from exchange rate to
prices was the largest in economies where the degree of dollarization was very high and in
those where there was little private liability dollarization (Type II economies), and was the
lowest in economies where the degree of dollarization was low and in those where there was
The regression results also suggest that in the large majority of dollarized
economies—i.e., in the 66 countries where the degree of dollarization was either high or
moderate during 1996-2001—the pass-through coefficient is about 0.5, which is comparable
to estimates found in other cross-country studies for developing countries.28 These results
are broadly supportive of one central premise of the hypothesis of “fear of floating,” namely,
that a high pass-through coefficient is one of the reasons why central banks have little
tolerance for large exchange rate changes.
28 Honohan and Shi (2002) obtain an average pass-through coefficient of about 0.3 using a similar specification and country sample, but longer time series, than those used in the
regressions reported in Table 11. Kamin (1998) also estimates a similar equation using longer time series, and reports several regressions with a pass-through coefficient of 0.5 or higher.
Lagged Real exchange Exchange Time Constant Adjusted No. of
inflation rate (level) rate change high moderate low openness 2/ trend R2 obs. dollarization dollarization dollarization
Coefficient 0.20 -0.01 0.67 -0.20 -0.17 -0.50 -0.08 -0.01 0.02 0.89 424
t-statistic (10.91) (-2.15) (16.24) (-5.99) (-4.71) (-4.28) (-2.57) (-1.52) (1.20)
Lagged Real exchange Exchange Time Constant Adjusted No. of
inflation rate (level) rate change Type II Type III openness 2/ trend R2 obs. dollarization dollarization
Coefficient 0.19 -0.01 0.49 0.17 -0.18 -0.01 -0.01 0.03 0.89 424
t-statistic (10.21) (-2.70) (10.17) (4.86) (-2.13) (-0.32) (-2.21) (2.02)
By degree of dollarization
very high high moderate low Type I Type II Type III
0.67 0.47 0.50 0.22 0.49 0.66 0.31
1/ Pooled estimation for 89 countries. Annual data.
2/ Openness defined as the average share of imports to GDP during 1996-2001.
Table 11. Dollarization and Exchange-rate Pass-through: 1996-2001
By type of dollarization Interactive coefficients
Interactive coefficients
Panel A. Regression Results (dependent variable: inflation) 1/
Panel B. Implied pass-through coefficients A.2 By type of dollarization
[image:40.612.91.567.345.539.2]The exchange rate regimes prevalent in our sample of dollarized economies during
the period 1996-2001 also suggest a link between “fear of floating” and the degree of
dollarization. As Table 12 shows, all groups of dollarized economies exhibited, de facto, remarkably similar degrees of exchange rate flexibility that corresponded broadly to regimes
where the exchange rate fluctuated within relatively narrow bands.29 In line with the results
from the pass-through regressions, however, countries with a very high degree of
dollarization exhibited a significantly lower degree of exchange rate flexibility—i.e., more
acute “fear of floating”—than the other dollarized economies.
29 The exchange regimes associated with the scores of 7, 8 and 9 obtained in the exercise reported in Table 12 are, respectively, “de facto crawling pegs,” “de facto crawling bands narrower than or equal to 2 percent” and “pre-announced crawling bands wider than or equal to 5 percent;” see Reinhart and Rogoff (2002), Table 4.
Very high High Moderate Low Type I Type II Type III Exchange rate flexibility 1/
average score 6.8 9.0 8.4 8.9 7.7 8.8 8.7
standard deviation 3.1 3.8 3.7 3.2 3.7 3.7 3.3
number of countries 10 26 31 6 26 34 13
Test of equality of means very high vs. rest of sample Type I vs. rest of sample
t-statistic 2/ -1.71 -1.23
(degrees of freedom) 14 52
Sources: Reinhart and Rogoff (2002) and Appendices I and II.
1/ Degree of exchange rate flexibility measured on a scale going from 1 (least flexible) to 15 (most flexible)—see Reinhart and Rogoff (2002), Table 4.
[image:41.612.88.543.364.529.2]2/ Critical t-values at 90% confidence level are 1.35 for the first test and 1.30 for the second test.
Table 12. Dollarization and Exchange Rate Flexibility: 1996-2001
Degree of
VI. COMBATING THE ADDICTION
The evidence reported in the previous section suggests that partial dollarization does
not have first-order adverse effects on monetary policy, especially for the purpose of inflation
control. This is not the same as saying that partial dollarization carries no costs. Partial
dollarization indeed can create large currency mismatches in developing countries. Those
mismatches tend to remain hidden during tranquil times but can wreak havoc in all sectors of
the economy, and particularly in the banking system, pretty quickly after a large depreciation
(Goldstein and Turner 2003). The dynamics of bank runs, and the scope for arresting them,
including through the provision of central bank liquidity, also are quite different, and more
complex, in economies with a high degree of domestic dollarization--e.g., de Nicoló et al.
(2003); Gulde et al. (2003).
The financial fragility of dollarized economies was brought to the fore in the late
1990s by the Asian crises and, more recently, by the banking crises in Argentina and
Uruguay. The evidence from these crises makes it clear that an attitude of “benign neglect”
towards partial dollarization in general, and towards domestic dollarization in particular,
carries considerable risks. In fact, we would tend to agree that containing partial
dollarization, and particularly domestic dollarization, is a worthy goal of economic policy in
developing countries.
That being said, we are highly skeptical of recent proposals that outline the “road
towards successful de-dollarization” without bothering to see what the evidence has to say
about the origins of the addiction and about past attempts at combating it --e.g., Hausmann
(2001), Levy-Yeyati (2003). We do not think that any “de-dollarization blueprint” that