queueing delay and colony ergonomic efficiency
.
White Rose Research Online URL for this paper:
http://eprints.whiterose.ac.uk/1304/
Article:
Anderson, C. and Ratnieks, F.L.W. (1999) Task partitioning in insect societies. I. Effect of
colony size on queueing delay and colony ergonomic efficiency. American Naturalist, 154
(5). pp. 521-535. ISSN 0003-0147
[email protected] https://eprints.whiterose.ac.uk/ Reuse
Unless indicated otherwise, fulltext items are protected by copyright with all rights reserved. The copyright exception in section 29 of the Copyright, Designs and Patents Act 1988 allows the making of a single copy solely for the purpose of non-commercial research or private study within the limits of fair dealing. The publisher or other rights-holder may allow further reproduction and re-use of this version - refer to the White Rose Research Online record for this item. Where records identify the publisher as the copyright holder, users can verify any specific terms of use on the publisher’s website.
Takedown
If you consider content in White Rose Research Online to be in breach of UK law, please notify us by
Task Partitioning in Insect Societies. I. Effect of Colony Size on
Queueing Delay and Colony Ergonomic Efficiency
Carl Anderson1,*and Francis L. W. Ratnieks2
1. Probability and Statistics Section, School of Mathematics and Statistics, University of Sheffield, Sheffield S3 7RH, United Kingdom;
2. Department of Animal and Plant Sciences, University of Sheffield, Sheffield S10 2TN, United Kingdom
Submitted December 1, 1997; Accepted June 17, 1999
abstract:The collection and handling of colony resources such as
food, water, and nest construction material is often divided into subtasks in which the material is passed from one worker to another. This is known as task partitioning. When material is transferred directly from one individual to another, queueing delays frequently occur because individuals must sometimes wait for a transfer partner. A stochastic simulation model was written to study the effect of colony size on these delays. Queueing delay decreases roughly ex-ponentially with colony size because stochastic fluctuations in the arrival of individuals are lower in larger colonies. These results sup-port empirical studies ofPolybia occidentalisand other theoretical studies of honeybees. The effect of the relative number of individuals in the two subtask groups was also studied. There is a unique optimal ratio of the number of workers associated with each of the subtasks that simultaneously minimizes mean queueing delay and maximizes colony nectar-processing rate. Deviations from this optimal ratio, for example, as a result of forager mortality or changes in nectar pro-ductivity that affect foraging trip duration, increase mean queueing delays greatly, especially in smaller colonies.
Keywords:social insects, task partitioning, ergonomics, colony size, queueing delays, honeybee.
Insect societies have sophisticated ways of organizing their work. One apparently universal organizational feature is division of labor, in which individuals consistently perform a subset of tasks for relatively long periods of time, typically from a few days to their whole life (Oster and Wilson
*To whom correspondence should be addressed; present address: Department
of Zoology, Duke University, Box 90325, Durham, North Carolina 27708-0325; e-mail: [email protected].
Am. Nat. 1999. Vol. 154, pp. 521–535.q1999 by The University of Chicago. 0003-0147/1999/15405-0003$03.00. All rights reserved.
1978; Robinson 1992; Bourke and Franks 1995; Seeley 1995). A division-of-labor perspective focuses attention on individuals and the tasks they perform over a period of
time (Oster and Wilson 1978; Jeanne 1986a). A second
feature of the organization of work is task partitioning
(Jeanne 1986a, 1991; Anderson and Ratnieks 1999a;
re-viewed in Ratnieks and Anderson 1999a). Task
partition-ing focuses on a particular task and the individuals that perform it. One area of work in which task partitioning is important is the collection of food and building ma-terials, which is frequently partitioned between the workers that collect the material and those that use or store it
(Jeanne 1986a, 1991; reviewed in Ratnieks and Anderson
1999a).
Task partitioning and division of labor frequently go
together in the organization of work (Jeanne 1986a, 1991).
For example, foragers may collect food that they transfer to receiver workers at the nest (task partitioning), and the foragers and receivers may also be different groups of workers (division of labor). An example of this is nectar
collection in the honeybee Apis mellifera (Seeley 1995,
1997). Honeybee nectar foragers transfer their nectar to receiver bees, who then store it in cells (von Frisch 1967; Kirchner and Lindauer 1994; Seeley 1995, 1997). Nectar transfer typically occurs inside the nest near the entrance. Transfer is direct, with the receiver drinking nectar re-gurgitated by the forager.
Both task partitioning (Jeanne 1986a, 1991) and
divi-sion of labor (Oster and Wilson 1978; Robinson 1992) have many hypothesized and demonstrated advantages and disadvantages to the colony (reviewed in Ratnieks and
Anderson 1999a). In the case of task partitioning, in which
two or more individuals handle each load of forage, costs include any loss of material and time costs, including the time taken to transfer material and, when transfer is direct, the time taken to meet a transfer partner (Fowler and
Robinson 1979; Ratnieks and Anderson 1999a). The time
colonies because of proportionately greater stochastic fluc-tuations in the arrival rates of foragers and receivers at
the transfer area (Jeanne 1986b). As we show in our
sim-ulations, these “queueing” delays occur even when the
proportions of foragers and receivers are
opti-mal—meaning that the work capacities of these two groups are equal.
Queueing cost may, potentially, act to select against task partitioning in small-colony species, thereby restricting task partitioning with direct transfer to species with large
colonies, unless the benefits are high, as in Polybia
occi-dentalis (Jeanne 1986b; Ratnieks and Anderson 1999a). The importance of colony size in task partitioning is fur-ther suggested by comparisons among species. Queueing costs are expected to be low in nectar collection in the honeybee, in which colonies typically consist of around 25,000 workers, approximately one-quarter being engaged in food collection (Seeley 1995). In contrast, nectar col-lection and storage are not partitioned in bumblebees,
Bombus(Michener 1977), which have much smaller col-onies, typically 100–400 workers (Free and Butler 1959). A second difference between bumblebees and honeybees is that honeybee colonies are founded by swarms of at least several thousand workers plus a queen (Fell et al. 1977), whereas bumblebee colonies are founded by a single queen (Wilson 1971). Thus, honeybee colonies never pass through a small-population stage. A similar contrast be-tween swarm-founded versus single-queen-founded nest
species occurs in pulp foraging in wasps.Vespulanests are
founded by single queens, whereasP. occidentalisnests are
founded by swarms of 69–350 females (Forsyth 1981). In
Vespula, wood pulp is not transferred to builders (Jeanne
1991), as in P. occidentalis, even though the maximum
colony size reported for annualVespulanests is 5,207
in-dividuals for Vespula vulgaris (Crawshay 1905, cited in
Wilson 1971). Two further indications of the role of colony size in task partitioning are found by comparison within
species. Nectar collection in Vespulabecomes partitioned
between foragers and receivers in larger colonies (Akre et
al. 1976; Jeanne 1991), and in colonies of!16 workers in
the ponerine ant Ectatomma ruidum, “hunters” always
hunt for insects and transport the prey back to the nest themselves. However, in colonies of 21 workers or more, the task becomes partitioned between “stingers,” who cap-ture the prey, and “transporters,” who carry it to the nest (Schatz et al. 1996). Dominance interactions, which are related to colony size and mode of colony founding, are an additional factor affecting task partitioning (O’Donnell 1998). For instance, dominant individuals of the eusocial waspMischocyttarus mastigophorusat the nest were more likely to take food from arriving foragers than subordinate workers.
Despite the importance of task partitioning in the
or-ganization of work in insect societies and the probable importance of colony size on colony ergonomic efficiency when task partitioning occurs, the relationship between queueing delay and colony size has not been studied quan-titatively. The primary aim of this study was to determine the effect of colony size, specifically the number of foragers plus receivers, on the amount of time lost because of queueing delays in direct transfer from foragers to receiv-ers. We also investigated the effects of the relative work capacities of foragers and receivers on the delays in order to address situations in which the proportions of foragers and receivers are suboptimal. We investigated this using computer simulation.
The Simulation Model
Introduction
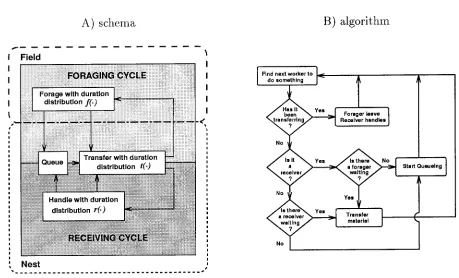
A stochastic simulation program was written in the pro-gramming language C to implement a model of task par-titioning (fig. 1A) and its associated algorithm (fig. 1B), using a continuous-time, event-based queueing paradigm. The simulation is general for any situation in which direct transfer between two groups occurs, such as nectar col-lection and storage in the honeybee, a scenario that we frequently used as an illustrative example. For termino-logical simplicity, we refer to collectors throughout as “for-agers,” to users as “receivers,” and to colony size as the combined number of foragers and receivers. “Foraging cycle” refers only to the first subtask, that is, the collection and transfer of the nectar to receivers, and does not include storage (see fig. 1A). Similarly, “Receiving cycle” refers only to the second subtask, namely, the receiving of the material during transfer and its utilization or storage. Terminology and notation are listed in appendix A.
Simulation Assumptions
Figure 1:A, Foraging-receiving cycle schema used in the simulation model and (B) its associated algorithm
SIRO is the more biologically reasonable of the two dis-ciplines for nectar foraging in the honeybee and is virtually identical to Seeley and Tovey’s (1994) “urn model.”
Assumptions for foragers include the following. First, that all foraging trips are successful; that is, a forager always returns with a full load of nectar. Second, a forager collects one unit of nectar and transfers it all to a single receiver. (This assumption is relaxed in our companion article,
Rat-nieks and Anderson 1999b.) And third, the durations of
all foraging trips come from a distributionf(7), with mean
mf and variance .
2 jf
Assumptions for receivers include the following. All re-ceiving trips are successful; that is, there are sufficient empty cells in which to store the nectar. Second, that a receiver receives one unit of nectar from a forager before leaving the transfer area. (This assumption is also relaxed
in our companion article, Ratnieks and Anderson 1999b.)
Finally, it is assumed that the durations of all receiving
trips come from a distribution r(7), with mean mr and
variancej2.
r
Assumptions for nectar transfer include the following.
All transfer durations come from a distributiont(7), with
meanmtand variance , during which a full load of nectar
2 jt
is transferred to the receiver (this assumption is relaxed
in our companion article, Ratnieks and Anderson 1999b),
and that individuals arriving at the transfer area start trans-ferring nectar immediately if there is a suitable transfer partner available, otherwise they start queueing. There is no “search” delay.
This set of assumptions generates a situation in which there may be none, several, or many pairs of workers transferring material simultaneously. In addition, there may be no workers queueing, or there will be a queue of a single worker type. That is, there will be a queue of foragers or a queue of receivers but never both. Simul-taneous queueing of foragers and receivers will never occur because as soon as there is a forager waiting to be unloaded and a receiver waiting to receive they will pair up and this would happen repeatedly until the shorter queue had been eliminated.
Table 1 was used as the “standard” parameter set for the simulations. The values were not chosen to model any specific species, although they are not unreasonable for the honeybee except that the receiving and foraging trip durations are equal. In the honeybee, actual foraging du-rations are generally more than 10 times that of transfer
duration (Anderson 1998a; Seeley [1989] found foraging
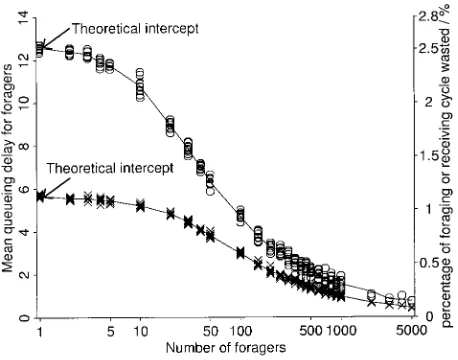
Figure 2:Mean queueing delay for foragers against log number of for-agers (=number of receivers) for two levels of variance in foraging and receiving trip duration,j2=j2= 500(open circles) andj2=j2= 100(x
f r f r
pattern). Because this is a symmetric case, the results are the same for receivers. The arrows indicate the theoretical mean queueing delays for the limiting case of one forager and one receiver (see app. C). The right-hand axis shows the amount of time wasted (i.e., queueing delay) as a proportion of the mean trip duration (500). Each datum is the mean of at least 6,000 queueing delays derived from 500 foragers or 500 receivers, and so each worker contributes an average of 12 queueing delays to the estimation of the mean. For each colony size there are 10 replicates, except for colonies of 2,000 or more foragers, where there are only two because of computational time constraints.
cycle time,” but this includes search time and (possibly multiple) transfer time(s). The time units are general, meaning that the relevance of the results depends not on the actual durations of the parts of the cycle but on their ratios. The simulations are run over a wide range of colony sizes (2–10,000) and thus can be considered to explore a broad range of species. Last, it is shown that the actual distribution types off(7),r(7), andt(7) are irrelevant (see app. B), with only the mean and variance of the distri-butions being important.
At the start of each simulation, all workers are in the nest. Foraging begins, and the system is allowed to settle to equilibrium, at least 30,000 iterations of the main
al-gorithm in figure 1B, before data, such as individual
queueing delays, number of workers queueing, or number of pairs transferring, are collected. The data are collected from at least 20,000, but typically 50,000, further iterations of the simulation algorithm. Because of the nature of the
simulation, one iteration of the algorithm in figure 1B
represents one “event,” such as an arrival of a worker at the transfer area or the uncoupling of a transfer pair, and not necessarily a single data point of interest, such as a queueing delay. In short, the number of data points is always less than the number of iterations. However, in “Results,” mean values reported are based on at least sev-eral thousand, and as many as 16,000, data points and thus should closely reflect the true means.
Results
Our basic result is that delay decreases with numbers of foragers plus receivers and with decreasing variance in duration of foraging and receiving trips and that there is an interaction between numbers and variance. It can be shown analytically (see app. C) that, at least for this system, minimizing the mean queueing delay for all the individuals is equivalent to maximizing the colony’s forage-processing rate, a measure that is of probable selective importance in social insects (Oster and Wilson 1978). Hence, the results presented in this article concentrate on the mean queueing delay.
Effect of Colony Size on Mean Queueing Delay
Figure 2 shows the effect of colony size on the mean queueing delay of workers returning to the transfer area when the number of receivers and foragers are equal for two levels of variance in trip duration. (This delay is equal for both foragers and receivers because of symmetry and because the colony is at optimal conditions.) In both cases, there is a roughly exponential decrease in queueing delay as colony size increases. At small colony sizes there is a considerable difference between the delays for the two
lev-els of variance, but this decreases with colony size. In other words, the efficiency gain through increased colony size is most important for smaller colonies and for colonies with more variable foraging and receiving trip durations. The intercepts were calculated analytically (app. C).
Figure 3 shows the mean queueing delay as the variance of the foraging and receiving trip durations increases (j2=j2) for three colony sizes. Queueing delays increase
f r
with variance for all three colony sizes. However, the in-crease is greater in smaller colonies. In the largest colony, the increase almost levels off at the standard parameter set.
Figure 3:Mean queueing delay against variance of foraging and receiving trip duration (j2=j2) for three colony sizes. Dashed lines indicate results
f r
[image:6.612.69.297.96.277.2]from the standard parameter set. Each datum is the mean of several thousand queueing delays arising from a single simulation.
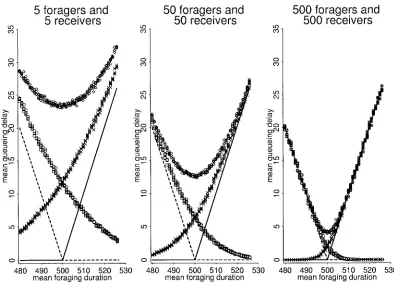
Figure 4:System dynamics at the optimal proportion of foragers, showing number and percentage of foragers and receivers that are queueing and number of pairs transferring.A, Five foragers and five receivers;B, 50 foragers and 50 receivers;C, 500 foragers and 500 receivers.
In the deterministic case, both forager and receiver var-iances are 0 and the queueing delay is also 0, irrespective of colony size. Because their trips are of equal duration, foragers and receivers are perfectly synchronized and arrive at the transfer area simultaneously.
Queue Dynamics
Figure 4 shows the dynamics of the system at colony sizes
of 10, 100, and 1,000 under optimal conditions (p =0.5,
). At all three colony sizes, few workers are queueing mf=mr
at any one time. The numbers queueing, transferring, for-aging, and storing fluctuate. At a colony size of 1,000, 6%–12% are transferring and a maximum of 2.6% are queueing, with 87%–94% actually foraging or receiving. The number queueing varies from 0 to 14. In smaller colonies, the number of foragers or receivers queueing decreases but the proportion increases to a maximum of 8% and 20% in colonies of 100 and 10, respectively. These results show in more detail why smaller colonies have a greater mean queueing delay. At a colony size of 10, for example, there is never more than one worker queueing, but a queue of one represents 10% of all workers.
[image:6.612.73.539.441.679.2]Figure 5: Mean queueing delay for foragers (solid line) and receivers (dotted line) against proportion of foragers,p, in a colony of 100. The enlarged section from the figure shows that there is still a large penalty, in terms of increased queueing delay, for even small deviations from . Each datum is the mean of several thousand queueing delays arising ∗
p
[image:7.612.313.544.91.266.2]from a single simulation.
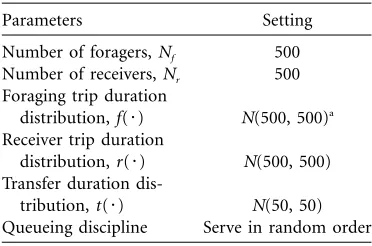
Table 1:Standard parameter set as used in the sim-ulations unless indicated otherwise
Parameters Setting
Number of foragers,Nf 500
Number of receivers,Nr 500
Foraging trip duration
distribution,f(7) N(500, 500)a
Receiver trip duration
distribution,r(7) N(500, 500)
Transfer duration
dis-tribution,t(7) N(50, 50)
Queueing discipline Serve in random order
aThat is, normally (Gaussian) distributed with mean and variance of 500 units.
then to only a few times per 1,000 time units in colonies of 100 and 10.
Proportion of Foragers,p∗
Figure 5 shows the effect of varying the proportion of foragers on mean queueing delay. Since the mean foraging and receiving trip durations were equal, the two lines cross atp =0.5, which isp∗. Atp∗, the queueing delay averaged over all workers is minimized and nectar-processing rate
is maximized. Even small deviations fromp∗ cause large
penalties via increased queueing delays. However, even with a coefficient of variation of 0.044 (the situation in fig. 5), the queueing delays are very close to the deter-ministic case. If the system is deterdeter-ministic, queueing de-lays are independent of colony size (see app. C), but in
general, queueing delays do depend onNf andNr. From
other simulation results (not shown), the variance of the three distributions also has an effect but is only close to
because the stronger effect of nonoptimal p swamps
∗
p
variance effects away from the vicinity ofp∗.
Mean Duration of Foraging and Receiving Trips
Figure 6 shows the change in queueing delay as mean foraging duration varies, for example, if nectar becomes more or less difficult to collect (Lindauer 1961; Seeley 1995), but with the mean receiving duration constant at 500. In the deterministic case, pairs of individuals can synchronize their activities and arrive at the transfer area simultaneously if the durations are equal. In this situation, there would be no queueing. However, when the foraging and receiving trip durations differ, the group with the longer duration never waits and the group with the shorter duration always waits, with a delay equal to the difference between the durations. The expected delays for the
deter-ministic case are also shown in figure 6 (solidanddashed
lines). When variance in foraging and receiving durations
are introduced, workers are no longer able to synchronize their activities. However, in a colony of 1,000 (or more), the results are fairly close to the deterministic case as
shown in figure 6C. This is because of the large number
of individuals in the system, which leads to a small in-terarrival time of transfer partners.
When foraging and receiving durations are equal, delays arise because of stochastic variation in the arrival of in-dividuals and both foragers and receivers can be limiting with equal probability (see “Queue Dynamics”), resulting in queues. However, as the mean foraging duration in-creases, the probability of foragers experiencing a delay decreases from 0.5 to 0 at some higher mean duration (510 time units for a colony of size 1,000). Above this value, foragers never wait and receivers always wait with a mean delay equal to the difference in mean trip durations as in the deterministic case. However, the actual delay experienced is still subject to some fluctuation. (By sym-metry, a similar situation exists for receivers when mean foraging duration decreases below 500.) Smaller colonies are affected both by longer queueing delays (fig. 2) and also by a slower decrease in the probability of foragers not queueing with increasing foraging duration. That is, the foraging duration at which the deterministic case is ap-proximated increases.
[image:7.612.89.275.573.696.2]Figure 6:Mean queueing delay for foragers (open circles) and receivers (x pattern) and total queueing delay (foragers1receivers,diamond pattern) against mean foraging trip duration for three colony sizes. Mean receiving duration was fixed at 500. The solid line in each figure represents the receivers’, and the dashed line represents the foragers’, mean queueing delay for the deterministic case in which the foraging, receiving, and transfer duration distributions are constants (i.e.,j2=j2=j2= 0). Each datum is the mean of several thousand queueing delays, and there are 10 replicates.
f r t
toward the deterministic case. Thus, an increase in for-aging duration causes a larger absolute increase in the combined queueing delay at larger colony sizes. For ex-ample, at a mean foraging duration of 510, the absolute increases in mean queueing delay of all workers from that at 500 for the three colony sizes are 0.7 (10), 1.26 (100), and 3.0 (1,000) time units. The reason is that individuals arrive at the transfer area at a faster rate in larger colonies. So, any difference in work capacities of the two groups leads to a faster build up of work, that is, individuals queueing, in larger colonies. This means that smaller col-onies have less to lose by being suboptimally organized, as they are already relatively more disadvantaged by the stochastic variation in arrival rate.
Discussion
The main result of this study is the relationship between colony size and the amount of time spent queueing when task partitioning with direct transfer occurs. For the con-ditions of our model, the percentage of time wasted drops from 2.3 to 1.25 to 0.42 to 0.15 as colony size increases
from 10 to 100 to 1,000 to 10,000, respectively. The cause of this relationship is the relatively greater importance of random variation in the arrival rates of receivers and for-agers at the transfer area in small colonies than that in large colonies.
This result is essentially independent of the distributions of the foraging and receiving trip durations but is affected by the variance. Higher variance leads to greater variation in the arrival rates at the transfer area, causing a greater proportion of available time to be wasted. Importantly, the result is independent of the queueing discipline, whether first come first served or serve in random order, although it does have an effect on the information quality
of queueing delays (Ratnieks and Anderson 1999b).
collecting the material, who were underutilized. The re-lationship between individual and colony-level efficiency depends on the particular details of the system in question, specifically the set of feedbacks and interdependencies that operate within the system. Transfer durations were variable in these simulations. This is reasonable for the honeybee.
Mean honeybee nectar-transfer duration (51 SD) was
s in one study (Anderson 1998a). However,
36.6522.3
in many natural situations, transfer duration will be es-sentially deterministic. Longer transfer durations will de-crease the colonies’ nectar-processing rate, as the foraging and receiving cycles are longer, but will not affect the relationship between individual and colony-level effi-ciency, at least in the system modeled here.
Our results provide insight into the likely effects of col-ony size on the queueing cost of direct transfer in task partitioning. In the honeybee, each colony has thousands of workers collecting and receiving nectar. Colonies are at their smallest in early spring and after swarming but even then have at least several thousand workers. Given an av-erage colony size of around 25,000 honeybees (Seeley
1995), colonies probably have from 1,000 to110,000
work-ers engaged in collecting and storing nectar. One thousand is a size at which the amount of time wasted queueing is low (fig. 2), and 10,000 results in negligible time wasted. These results apply to our simulation, which is in some respect a simplification of the actual process of pairing up in the transfer area. In the simulation, there is no delay if there is a partner available. In nature, unless the transfer area is small, workers may need to actively search for a
transfer partner, even if a partner is available. In Polybia
occidentalis, the transfer area is relatively small and has few other wasps in it (R. L. Jeanne, personal communi-cation), conforming to the simulation model. In the hon-eybee, the transfer area is relatively large (Seeley 1995) and contains other bees, so that receivers and foragers need to search for a partner, usually antennating several other bees before a partner is found (Seeley 1995; Winston 1987). Thus, in the honeybee there is an additional search delay, which will add to the time cost of task partitioning. This search delay was not modeled because there was no way of doing this in a realistic way and because it is unlikely to be a function of colony size.
At the other extreme in population size are the P.
oc-cidentalis colonies studied by Jeanne (1986b, 1996b). In
larger colonies (1350 workers), the mean delay
experi-enced by wood pulp foragers in finding a receiver (builder) and in transferring was considerably less, 6.7 s, than in
small colonies (!50 workers; 16.1 s). Jeanne (1986b,
1996b) attributes this difference to the damping effect of
large colony size on the variation in arrival times of for-agers and builders at the transfer area. Our results confirm this idea in general terms and also show that the observed
queueing delay difference between large and small colonies is of approximately the correct magnitude given their pop-ulations (fig. 2). An exact comparison of Jeanne’s empirical data with the results of our model is not possible. This is because data such as the actual numbers of foragers and builders are not reported by Jeanne and because the queue duration he measured was the sum of the queueing delay plus the unloading time. Some other qualitative
compar-isons can be made, however. Jeanne (1996b) reports that
experimentally supplementing the supply of pulp to the nest construction workers increased the queueing delays of pulp foragers, who responded by decreasing their rate of foraging, as would be predicted from our model. How-ever, this decrease could come about by increasing the mean foraging duration or decreasing the number of work-ers involved in pulp foraging. An increase in available pulp is effectively equivalent to an increase in the proportion of pulp foragers within the colony or a decrease in trip duration. Note that queueing delay is not necessarily the only cue that workers may rely on to estimate relative
work capacities. Jeanne (1996b) showed that the number
of rejections that pulp foragers experienced by builders was another important cue about the relative allocation of workers between the three different tasks involved in building.
Other differences between our model and the situation in P. occidentalis are that one forager collects sufficient pulp for several builders and that water to use in building is collected by a third group of workers. Nevertheless, there is no reason why our simulation model could not be mod-ified for theP. occidentalissituation and the necessary em-pirical data collected to compare the simulation predic-tions with the delays that actually occur. We expect the
results to apply to the Polybia situation, but no definite
conclusion can be made at present. The size range ofP.
occidentalis colonies is ideal for such a study because it covers the range of colony sizes across which queueing
delay variation is greatest (fig. 2). Jeanne (1986b) noted
that, in his smallest study colonies, there were just a few pulp foragers. The smallest colony he studied had just eight
workers, and the largest 598. Another study (Jeanne 1996a)
reports colony sizes of 24–1,562. An additional reason why
Polybia is a good model system for empirical research is that changes in mean foraging duration for pulp or water collectors are unlikely, as the two resources are usually in
excess (Anderson and Ratnieks 1999b). In addition, the
amount of work required at the nest can easily be
ma-nipulated experimentally (Jeanne 1996b).
Jeanne (1986b) suggests that the major advantage of task
partitioning inP. occidentalis is that the overall building
so only very weakly, for nectar transfer in the honeybee. Interestingly, inP. occidentalis, pulp foragers in small col-onies frequently transfer only part of their load to builders
and build with part of it themselves (Jeanne 1986b). This
suggests that the queueing cost is considerable in these small colonies, in agreement with the results of our
sim-ulation and Jeanne’s empirical data (Jeanne 1986b). This
may also explain whyVespulawasps do not partition nectar
transfer (Akre et al. 1976; Jeanne 1991), and Ectatomma
ruidumdo not transport insect prey (Schatz et al. 1996), in small colonies. Queueing costs may not wholly explain whether material is transferred, as dominance interactions also play a part in some species (O’Donnell 1998). Costs and benefits of task partitioning are reviewed in Ratnieks
and Anderson (1999a).
Figures 5 and 6 demonstrate the increase in queueing delays experienced by the group in excess when the work capacities of the two groups are not equal. One way that the colony could reallocate its workers to balance these
work capacities is by task switching (e.g., Jeanne 1986b).
Conceivably, workers could use a threshold rule in which they switch tasks if their queueing delays exceeded some specified value. This would reduce the work capacity of the excess group and increase the work capacity of the group in shortage. The reduced excess group would now experience lower mean queueing delays, less than the
threshold, and switching would cease. Anderson (1998b)
implemented such a threshold switching rule in the context
of the current model and showed that this enabled the colony to maintain an appropriate worker allocation in spite of a fluctuating environment. Moreover, these results are very robust, as the group-level behavior is fairly in-sensitive to the exact values of the thresholds.
Task partitioning in foraging provides an attractive av-enue for further research on the ergonomics of insect so-cieties. Ergonomic studies have traditionally focused on caste and division of labor (Oster and Wilson 1978), which has generated important basic ideas, such as the existence of optimal caste ratios, that have proved hard to test em-pirically (Wilson 1980a, 1980b, 1983a, 1983b). Task par-titioning offers numerous model systems in many species of ants, bees, wasps, and termites (Ratnieks and Anderson
1999a) suitable for experimental study and hypothesis
test-ing. Importantly, the basic results of this study, the effects of colony size on queueing delay, are testable. Similarly, comparative studies may confirm a trend we hint at: that large colony or swarm founding species are more likely to have task partitioning in foraging. Finally, task partitioning has effects on colony life that go beyond the total amount of time wasted in queueing delays. The duration of the queueing delays experienced by individuals can provide information for use in recruitment of additional foragers or receivers in response to changing conditions (Seeley 1995). This topic, the information content of queueing delays, is the subject of our companion article (Ratnieks
APPENDIX A
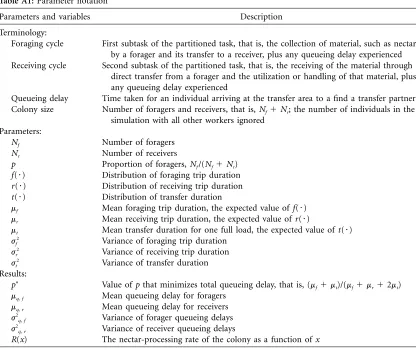
Table A1:Parameter notation
Parameters and variables Description
Terminology:
Foraging cycle First subtask of the partitioned task, that is, the collection of material, such as nectar,
by a forager and its transfer to a receiver, plus any queueing delay experienced
Receiving cycle Second subtask of the partitioned task, that is, the receiving of the material through
direct transfer from a forager and the utilization or handling of that material, plus any queueing delay experienced
Queueing delay Time taken for an individual arriving at the transfer area to a find a transfer partner
Colony size Number of foragers and receivers, that is,Nf1Nr; the number of individuals in the
simulation with all other workers ignored Parameters:
Nf Number of foragers
Nr Number of receivers
p Proportion of foragers,Nf/(Nf1Nr)
f(7) Distribution of foraging trip duration
r(7) Distribution of receiving trip duration
t(7) Distribution of transfer duration
mf Mean foraging trip duration, the expected value off(7)
mr Mean receiving trip duration, the expected value ofr(7)
mt Mean transfer duration for one full load, the expected value oft(7)
2
jf Variance of foraging trip duration
2
jr Variance of receiving trip duration
2
jt Variance of transfer duration
Results:
∗
p Value ofpthat minimizes total queueing delay, that is, (mf1mt)/(mf1mr12mt)
mq,f Mean queueing delay for foragers
mq,r Mean queueing delay for receivers
j2
q,f Variance of forager queueing delays
j2
q,r Variance of receiver queueing delays
R(x) The nectar-processing rate of the colony as a function ofx
APPENDIX B
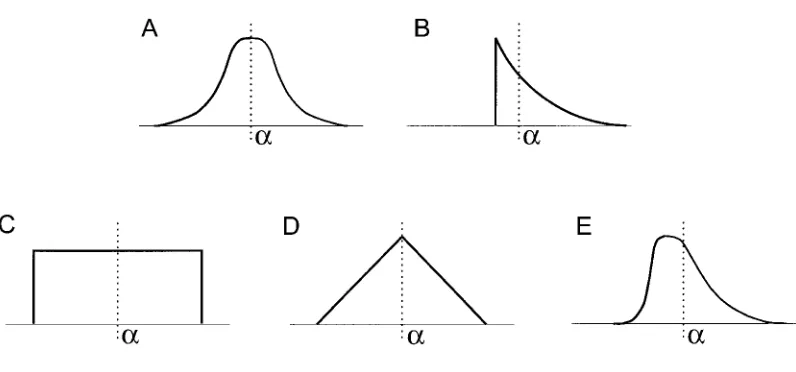
Foraging, Storing, and Transfer Distributions
The sensitivity of the model to the effects of a variety off(7), r(7), andt(7) distributions was tested. Many tens of simulations were run, with different distributions forf(7),r(7), andt(7), but with each distribution having the same mean and variance. This involves some translation and scaling of the distributions. The mean and variance of the
queueing delays for foragers and receivers were compared using box plots andt-tests. It was found that the particular
distribution type had no effect on the mean queueing delay or mean interarrival time, which only depended on the mean of the distribution and to a lesser extent its variance. That is, mean and variance are the two factors that are of greatest importance in affecting the rate of arrival of the workers to the transfer area and the formation and clearance of queues.
Figure B1:A, Normal distribution:N(a,b).B, Exponential distribution:a2Îb1Ex
(
Î1/b)
.C, Uniform distribution:U(a2Î3b,a1Î3b).D, Triangular distribution (scaled isosceles triangle of unit height and width2 6Îb):Tr(a, 6Îb).E, Gamma distribution (with shape parameterS. The largerSis, the less the distribution is skewed):a2ÎSb1Ga(
S,Îb/S)
.APPENDIX C
Analytical Results
Mean Queueing Delay ifN = N =f r 1
LetD 2 and 2 represent the queueing delays from the two individuals, then, from the truncated
∼N(m,j ) D ∼N(m,j )
1 1 2 2
normal distribution,
2 2
Î
E(FD12D2F)=0.798 j11j2 (C1)
and
2 2
Î
SD(FD12D2F)=0.603 j11j2. (C2)
(Eqq. [C1] and [C2] have been derived from Johnson et al. 1995, table 13.10, p. 159.)
However, when arriving at the transfer area, on average, on half the occasions (as Pr[D 1D]=0.5) a worker
1 2
experiences a queueing delay with mean as in equation (C1), and on the other occasions it experiences a 0 queueing delay. So, when considering 0 queueing delays,
2 2
Î
0.798 j1 1j2
2 2
Î
E(mq,f) = E(mq,r) = = 0.399 j11j2, (C3)
2
and using statistical theory it can be shown that
2
Var (FD12D2F) E(FD12D2F)
2 2
E(jq,f) = E(jq,r) = 1 , (C4)
2 4
2 2 2 2
E(jq,f) = E(jq,r) = 0.341(j11j2). (C5)
So, for figure 2, from equations (C3) and (C5), the expected queueing delay is0.399 500
Î
1500 = 12.62, with variance.
0.341(5001500) = 341
Optimal Proportion of Foragers,p∗
At the optimal proportion of foragers,p∗, the arrival rates of the foragers and receivers will be matched, minimizing
queueing delays. Thus,
number of foragers number of receivers
= . (C6)
mean duration of a forage cycle mean duration of a storage cycle
In the deterministic case, that is,j2=j2=j2= 0, in which there will no queueing delays atp∗, for anym m, , and
f r t f r
, mt
∗ ∗
p(Nf1Nr) (12p)(Nf1Nr)
= , (C7)
mf1mt mr1mt
which can be arranged to give
mf1mt
∗
p = . (C8)
mf1mr12mt
Thus,
optimal proportion of foragers
mean foraging cycle duration
= . (C9)
mean foraging cycle duration 1 mean receiving cycle duration
Mean Queueing Delays (Deterministic Case)
Clearly, the total amount of transfer time for foragers and receivers must match. Thus, the proportion of a cycle spent transferring multiplied by the number of workers within that cycle must be equivalent for the two cycles. That is,
number of foragers#(proportion of foraging cycle spent transferring)
= number of receivers#(proportion of receiving cycle spent transferring). (C10)
If we assume that only receivers queue and , then for anymf,mr, and mt,
2 2 2
jf =jr =jt = 0
mt mt
Nf
(
)
= Nr(
)
, (C11)mf1mt mr1mt1mq,r
which can be rearranged to give
Nr
mq,r= max 0,
{
(mf1mt)2(mr1mt) .}
(C12)Nf
mq,r= max {0, (ratio of receivers to foragers)
#(mean foraging cycle duration) (C13)
2(mean receiving cycle duration)}.
Similar logic can be applied to obtain the foragers’ mean queueing delay. That is,
Nf
mq,f= max 0,
{
(mr1mt)2(mf1mt)}
(C14)Nr
and
mq,f= max {0, (ratio of foragers to receivers)
#(mean receiving cycle duration) (C15)
2(mean foraging cycle duration)}
Note that equations (C12) and (C14) are independent of colony size. However, it can be shown from simulations that the general case (nondeterministic) does depend on the colony size and variance off(7),r(7), andt(7), as well asp,mf, mt, and mr, but only “close” to p∗. The logic applied in the deterministic case is similar to that of Little’s result in
queueing theory (L =lW, whereLis the number in the queue,l is the average arrival rate of “jobs,” and Wis the
average time a job spends in the queue; Little 1961) but does not hold here as there is a correlation between the arrival rate of workers and the number in the queue.
Colony Nectar-Processing Rate (Deterministic Case)
To process one nectar load takesmf1mq,f1mt1mr. Therefore, processing rate of an individual load (substituting from eq. [C14]) is
1 1
= , (C16)
mf1mq,f1mt1mr mf1mt1mr1max{0, (Nr/Nf)(mr1mt)2(mf1mt)}
and so the processing rate of the colony is
Nf
R(Nf)= . (C17)
mf1mt1mr1max{0, (Nr/Nf)(mr1mt)1mr}
If we letNf1N = Nr , that is, Nis colony size, thenpN = Nfand(12p)N = Nr. Substituting into equation (C17) and rearranging gives
1
R(pN)= (m , (C18)
1m) (m1m)
f t r t
max
{
pN ,(1}
2p)N
which can be shown to be maximized whenp isp∗, that is, when
p mf1mt
=
12p mr1mt
Literature Cited
Akre, R. D., W. B. Garnett, J. F. MacDonald, A. Greene, and P. Landolt. 1976. Behavior and colony development ofVespula penyslvanicaandV. atropilosa(Hymenoptera: Vespidae). Journal of the Kansas Entomological Society 49:63–84.
Anderson, C. 1998a. The organisation of foraging in insect
societies. Unpublished Ph.D. thesis. School of Mathe-matics, University of Sheffield, Sheffield.
———. 1998b. Simulation of the feedbacks and regulation
of recruitment dancing in honey bees. Advances in Complex Systems 1:267–282.
Anderson, C., and F. L. W. Ratnieks. 1999a. Task
parti-tioning in foraging: general principles, examples, effi-ciency and information reliability of queueing delays.
Pages 31–50inC. Detrain, J. L. Deneubourg, and J. M.
Pasteels, eds. Information processing in social insects. Birkha¨user, Berlin.
———. 1999b. Worker allocation in insect societies:
co-ordination of nectar foragers and nectar receivers in
honey bee (Apis mellifera) colonies. Behavioral Ecology
and Sociobiology 46:73–81.
Bourke, F. G., and N. R. Franks. 1995. Social evolution in ants. Princeton University Press, Princeton, N.J. Burd, M. 1996. Server system and queueing models of leaf
harvesting by leaf-cutting ants. American Naturalist 148: 613–629.
Crawshay, G. A. 1905. A large community ofVespa vulgaris.
Entomologist’s Monthly Magazine 41:8–10.
Fell, R. D., J. T. Ambrose, D. M. Burgett, D. DeJong, R. A. Morse, and T. D. Seeley. 1977. Seasonal cycle of
swarming in honey bees (Apis melliferaL.). Journal of
Apicultural Research 16:170–173.
Forsyth, A. B. 1981. Swarming activity of polybiine social wasps (Hymenoptera: Vespidae: Polybiini). Biotropica 13:93–99.
Fowler, H. G., and G. E. Robinson. 1979. Foraging byAtta
sexdens: seasonal patterns, caste, and efficiency. Ecolog-ical Entomology 4:239–247.
Free, J. B., and C. G. Butler. 1959. Bumblebees. New nat-uralist series. Collins, London.
Jeanne, R. L. 1986a. The evolution of the organization of
work in social insects. Monitore Zoologico Italiano, n.s., 20:199–133.
———. 1986b. The organization of work in Polybia
oc-cidentalis: costs and benefits of specialization in a social wasp. Behavioral Ecology and Sociobiology 19:333–341.
———. 1991. Polyethism. Pages 389–425 in K. G. Ross
and R. W. Matthews, eds. The social biology of wasps. Cornell University Press, Ithaca, N.Y.
———. 1996a. Productivity in a social wasp: per capita
output increases with swarm size. Behavioral Ecology 7: 43–48.
———. 1996b. Regulation of nest construction behaviour
in Polybia occidentalis. Animal Behaviour 52:473–488. Johnson, N. L., S. Kotz, and N. Balakrishnan. 1995.
Con-tinuous univariate distributions. Vol. 1. 2d ed. Wiley, Chichester, N.Y.
Kirchner, W. F., and M. Lindauer. 1994. The causes of the
tremble dance of the honeybee, Apis mellifera.
Behav-ioral Ecology and Sociobiology 35:303–308.
Lindauer, M. 1961. Communication among social bees. Harvard University Press, Cambridge, Mass.
Little, J. D. C. 1961. A proof for the queueing formula: . Operations Research 9:383–387.
L =lW
Michener, C. D. 1977. The social behavior of the bees: a comparative study. Harvard University Press, Cam-bridge, Mass.
O’Donnell, S. 1998. Dominance and polyethism in the
eusocial wasp Mischocyttarus mastigophorus
(Hymen-optera: Vespidae). Behavioral Ecology and Sociobiology 43:327–331.
Oster, G. F., and E. O. Wilson. 1978. Caste and ecology in the social insects. Princeton University Press, Prince-ton, N.J.
Ratnieks, F. L. W., and C. Anderson. 1999a. Task
parti-tioning in insect societies. Insectes Sociaux 46:95–108.
———. 1999b. Task partitioning in insect societies. II. Use
of queueing delay information in recruitment. American Naturalist 154:536–548.
Robinson, G. E. 1992. Regulation of division of labor in insect societies. Annual Review of Entomology 37: 637–665.
Schatz, B., J. P. Lachaud, and G. Beugnon. 1996.
Polyeth-ism within hunters of the ponerine ant, Ectatomma
ruidum Roger (Formicidae, Ponerinae). Insectes So-ciaux 43:111–118.
Seeley, T. D. 1989. Social foraging in honey bees: how nectar foragers assess their colony’s nutritional status. Behavioral Ecology and Sociobiology 24:181–199. ———. 1995. The wisdom of the hive. Harvard University
Press, Cambridge, Mass.
———. 1997. Honey bee colonies are group-level adaptive units. American Naturalist 150(suppl.):S22–S41. Seeley, T. D., and C. A. Tovey. 1994. Why search time to
find a food-receiver bee accurately indicates the relative rates of nectar collecting and nectar processing in honey bee colonies. Animal Behaviour 47:311–316.
von Frisch, K. 1967. The dance language and orientation of bees. Harvard University Press, Cambridge, Mass. Wilson, E. O. 1971. The insect societies. Harvard
Univer-sity Press, Cambridge, Mass.
———. 1980a. Caste and division of labor in leaf-cutter
pattern in A. sexdens. Behavioral Ecology and Socio-biology 7:143–156.
———. 1980b. Caste and division of labor in leaf-cutter
ants (Hymenoptera: Formicidae:Atta). II. The
ergon-omic optimization of leaf cutting. Behavioral Ecology and Sociobiology 7:157–165.
———. 1983a. Caste and division of labor in leaf-cutter
ants (Hymenoptera: Formicidae:Atta). III. Ergonomic
resiliency in foraging byA. cephalotes. Behavioral
Ecol-ogy and SociobiolEcol-ogy 14:47–54.
———. 1983b. Caste and division of labor in leaf-cutter
ants (Hymenoptera: Formicidae:Atta). IV. Colony
on-togeny ofA. cephalotes. Behavioral Ecology and
Socio-biology 14:55–60.
Winston, M. L. 1987. The biology of the honey bee. Har-vard University Press, Cambridge, Mass.