promoting access to White Rose research papers
White Rose Research Online
Universities of Leeds, Sheffield and York
http://eprints.whiterose.ac.uk/
This is an author produced version of a paper published in Journal of Documentation.
White Rose Research Online URL for this paper: http://eprints.whiterose.ac.uk/4567/
Published paper
Purves, R. and Sanderson, M. (1998) A methodology to allow avalanche
forecasting on an information retrieval system. Journal of Documentation, 54 (2). pp. 198-209.
A methodology to allow avalanche forecasting on an information retrieval system R. S. Purves
Department of Geography University of Edinburgh
Edinburgh
M. Sanderson
Department of Computing Science University of Glasgow
Glasgow
Abstract
This paper presents adaptations and tests undertaken to allow an Information Re-trieval (IR) system to forecast the likelihood of avalanches on a particular day. The forecasting process uses historical data of the weather and avalanche conditions for a large number of days. A method for adapting this data into a form usable by a text-based IR system is first described, followed by tests showing the resulting system’s accuracy to be equal to existing ‘custom built’ forecasting systems. From this, it is concluded that the adaptation methodology is effective at allowing such data to be used in a text-based IR system. A number of advantages in using an IR system for avalanche forecasting are also presented.
Introduction
Avalanches affect people and property in areas throughout the world where signifi-cant snowfalls occur. Since the 1950s, research into avalanche forecasting has been pursued in a number of countries where avalanches pose a significant risk to habita-tion, communications, or to those partaking in recreational pursuits [1].
This paper describes the use of computational techniques used in local avalanche forecasting. A number of points should be made clear about such systems. Typically, users are experienced avalanche forecasters who will have made observations in the field of the current snow and meteorological conditions. They will not use any com-puter forecasting system in isolation, but rather as a tool to aid them in making their decision on the level of avalanche hazard on a particular day. It should be noted that a local avalanche forecast aims to give information not about the mean level of avalanche hazard, but about the highest hazard in the area. In general the forecast is not for par-ticular avalanche paths, but for slopes with similar characteristics (such as altitude, inclination and aspect). Avalanche hazard is generally relatively localised, and in local avalanche forecasting the aim is often to give the mountaineer or skier sufficient in-formation so that they can still pursue their chosen activity, whilst avoiding slopes which are likely to be hazardous.
his-torical days according to their similarity to the forecast day. The forecast of avalanche occurrence depends on the occurrence of avalanches on the most similar days in the historical data set. If avalanches occurred on more than a certain number of those his-torical days, the forecast day is judged to be an avalanche day.
The similarity between days is computed by representing each day as a set of multi-variate parameters. A day is modelled as being a point in n-dimensional space, one dimension for each of its parameters, which are generally considered to be non-parametric1 [3]. In this model, known as Nearest Neighbours (NN), the similarity
be-tween two days is computed by measuring the Euclidean distance bebe-tween the points representing those days. A family of statistical avalanche forecasting tools using the NN model have been derived from Buser’s NXD (Nearest Days) system [3, 4, 5]. These are in operational use for local avalanche forecasting in many areas, including Switzerland [3, 4, 5], France, Scotland [6], and North America[2]. This forecasting technique is analogous to the vector based term independence models of information retrieval (IR) [7, pp. 95-111] where documents are represented as vectors and their similarity is computed using a Euclidean measure.
This paper describes an initial investigation into the use of an IR system as an ava-lanche forecasting tool. It starts with a description of the methodology used to adapt the multivariate historical data to a form usable by an IR system. This is followed by an explanation of the evaluation techniques utilised and the results thus derived. A number of potential advantages were found through the use of the IR system and these are explained next. Finally some ideas for the further development of such a system are discussed, with particular reference to advantages considered to stem di-rectly from the use of IR.
Methodology
The data used in this work consisted of a set of historical days data which consisted of parameters that described daily weather and snowpack conditions. The amount of precipitation, depth of new snow and wind speed were typical of these parameters. These data differed in one significant way from those normally processed by a text based IR system: the parameters, representing each day, were of different types and therefore the measurement of similarity between days was more complex than the measurement of similarity between two documents. An IR system is, generally, not equipped to handle this multi-typed matching as the similarity of a query to a docu-ment is typically based on one feature type, i.e. words. Rather than adapt a system to accommodate the avalanche data, it was transformed to be compatible with those which the IR system processed.
The system used in these experiments was a retrieval toolkit called SIRE (System for Information Retrieval Experimentation) developed ‘in-house’ at Glasgow University. SIRE is a collection of small independent modules, each conducting one part of the
1 Although such a treatment is statistically flawed, results from models that treated data as parametric
indexing, retrieval and evaluation tasks required for ‘classic’ retrieval experimentation [7, pp. 144-183]. The modules are linked in a pipeline architecture communicating through a common token based language. SIRE was initially used in research examin-ing the relationship between word sense ambiguity, disambiguation, and retrieval ef-fectiveness [8]. It proved to be a flexible tool as it not only provided retrieval func-tionality but a number of its core modules were also used to build a word sense disambiguator. It was further used in the Glasgow IR group submissions to TRECs 4 & 5 [9, 10] and is currently being used in a number of research efforts within the group.
The following section describes the transformation of the numerical data to a form suitable for SIRE to process.
The data transformation
As has already been stated, in an avalanche forecasting system based on the NN model, days are regarded as points in a multi-dimensional space and the similarity of two days is computed by measuring the Euclidean distance between their respective positions. These data can be regarded differently, one can view a parameter holding a certain value as a function, f(x), describing a distribution about that value (Figure 1). In
this paradigm, the similarity between two parameters is measured by computing the area of intersection between their respective distributions (Figure 2). If there is no in-tersection, then the measured similarity is zero. The similarity of two days is com-puted by summing the intersecting areas over all parameters associated with those days. 2.0 1.8 1.6 1.4 1.2 1.0 0.8 0.6 0.4 0.2 0.0
0 5 10 15 20
2.0 1.8 1.6 1.4 1.2 1.0 0.8 0.6 0.4 0.2 0.0 30 25 20 15 10 5 0
Figure 1: A parameter with the value 10 displayed as a distribution about that value.
Figure 2: The intersection of two distribu-tions. 2.0 1.8 1.6 1.4 1.2 1.0 0.8 0.6 0.4 0.2 0.0
0 5 10 15 20
av_temp, 2, 0.3 av_temp, 3, 0.4 av_temp, 4, 0.7 av_temp, 5, 0.9 av_temp, 6, 1.1 av_temp, 7, 1.3 av_temp, 8, 1.5 av_temp, 9, 1.8 av_temp, 10, 2.0
av_temp, 11, 1.8 av_temp, 12, 1.5 av_temp, 13, 1.3 av_temp, 14, 1.1 av_temp, 15, 0.9 av_temp, 16, 0.7 av_temp, 17, 0.4 av_temp, 18, 0.3
Figure 3: A distribution after being
By regarding parameters in this way, one can encode in the shape of their distribution, the manner in which one computes their similarity. For example, narrowing the distri-butions of two parameters requires them to be very alike before any value of similar-ity greater than zero is computed between them. In these experiments, a conical dis-tribution was used though it was quite possible for other disdis-tribution functions to have been applied. Using distributions causes the process of matching two days to be simplified, since the parameters associated with those days regardless of their type have the same form and this goes some way to making these data compatible for use in an IR system.
Making these data fully compatible with an IR system, involved a process of con-verting a parameter’s continuous distribution (Figure 1) into a discrete distribution (Figure 3) that is itself changed into a set of triples. These consisted of a token repre-senting the parameter type, a point value, and a weight indicating the magnitude of the distribution at that point (Figure 4). This transformation is referred to here as discre-tisation.
After discretisation, SIRE was presented with a collection of days in a form similar to a document text collection. Each day was represented by a set of triples, where the first two parts concatenated (parameter type and point value) were analogous to the words of a document and the third part was similar to the term frequency (TF) weight often used in IR systems. Measuring the similarity of two days involved counting the number of triples in common to those two days, a process akin to calculating the similarity of a document to a query. Adapting SIRE to accommodate these discretised data required the minor adjustment of only one of its modules: a strong indication of the transformed data’s similarity to text based documents. From the experience of adapting SIRE, it was concluded that data in this form will integrate into retrieval sys-tems that possess the following features:
• the ability to rank documents based on a similarity measure;
• the ability to index and retrieve documents composed of word/weight pairs;
• the ability to prevent the application of language based functions to the discre-tised data (e.g. case normalisation, stemming, etc.).
Evaluation of the forecasting system
Historical data used in evaluation
Two historical data sets were employed in the evaluation, one provided by the Scot-tish Avalanche Information Service (SAIS) and the other by the Swiss Federal Ava-lanche Institute (SLF). These data sets consisted of meteorological, snowpack and avalanche occurrence data collected by avalanche observers over a number of years
and used in operational versions of NXD in the areas concerned. Details of these sets are shown in Table 1.
The SAIS data set consisted of nine parameters, whilst the SLF data set consisted of twelve. Parameters were chosen based on their perceived relationship to avalanche occurrence in their respective climates.
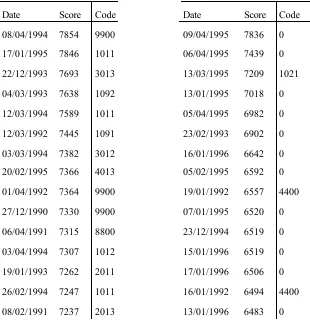
Two example forecasts
In this section two example avalanche forecasts using the SAIS data are illustrated. The values of the (nine) parameters of the two forecast days are shown in Table 2. The values were chosen to be indicative of, first, a day where avalanches were thought likely to occur (a cold day with fresh drifting snow), and second, where avalanches were thought unlikely to occur (a mild day with rain and a melting snowpack). Table 3 shows the results of the forecasts: a ranking of most similar days. As can be seen, associated with each day is an avalanche code. Its meaning is as follows: a 0 indicates that no avalanches were observed on the day and that visibility was clear; 9900
2 A no-visibility day is one where the observer’s visibility was obscured due to bad weather and no
avalanches were observed
Data
set Avalanchedays Non-avalanchedays No visibil-ity days2 Total numberof days
SAIS 165 309 182 656
SLF 1281 4585 148 6014
Table 1: Breakdown of historical days data sets
Parameter Avalanche Non-avalanche
New snow index 6 0
Wind speed (mph) 40 20
Wind direction (Deg.) 270 270
Rain No Yes
Midday temperature (°C) -8 4 Snow temperature3 (°C) -7 0
Cloud cover (%) 100 80
Snow drift Yes No
Foot penetration (cm) 20 0
cates that visibility was poor and no avalanches were observed, but the forecasters felt one was very likely to occur; if the forecaster felt less certain about an avalanche’s occurrence on a no visibility day, an 8800 was used instead; a 4400 again indicates that visibility was poor, but this time forecasters did not expect avalanches to occur. All other numerical codes indicate, in the first two digits, the number of avalanches that occurred, and in the second two, the type and triggering mechanism of the ava-lanche (wet, dry, naturally triggered, manually triggered); e.g. 4012 indicates a day with four dry triggered avalanches4 occurring.
As shown in Table 3, for the first forecast the ranking contains, eleven avalanche days, with all of the remainder being 9900 and 8800 days. For the second forecast, only one avalanche day was ranked highly. Of the others, fourteen were non-avalanche days, and the remaining two were 4400 days.
3 The temperature of the snow 10cm below the surface.
4 A dry triggered avalanche is one that is triggered by some additional load on the snowpack (typically
a climber or a skier) and that involves snow with a relatively low free water content.
Avalanche day Non-avalanche day
Date Score Code Date Score Code
[image:7.595.174.484.226.553.2]08/04/1994 7854 9900 09/04/1995 7836 0 17/01/1995 7846 1011 06/04/1995 7439 0 22/12/1993 7693 3013 13/03/1995 7209 1021 04/03/1993 7638 1092 13/01/1995 7018 0 12/03/1994 7589 1011 05/04/1995 6982 0 12/03/1992 7445 1091 23/02/1993 6902 0 03/03/1994 7382 3012 16/01/1996 6642 0 20/02/1995 7366 4013 05/02/1995 6592 0 01/04/1992 7364 9900 19/01/1992 6557 4400 27/12/1990 7330 9900 07/01/1995 6520 0 06/04/1991 7315 8800 23/12/1994 6519 0 03/04/1994 7307 1012 15/01/1996 6519 0 19/01/1993 7262 2011 17/01/1996 6506 0 26/02/1994 7247 1011 16/01/1992 6494 4400 08/02/1991 7237 2013 13/01/1996 6483 0
Measuring the forecasting system’s accuracy
To test the system’s accuracy on a particular data set, each historical day in that set was treated in turn as the day being forecast for. The values of its parameters were used to produce a ranked list of all the other days in the historical data set. The sys-tem’s forecast for a day was compared against the known avalanche conditions for that day. Evaluation of the forecasting system produced two figures: the percentage of correctly forecast avalanche days and the percentage of correctly forecast non-avalanche days; these are the figures commonly used in evaluating operational ava-lanche forecasting systems [2, 3]. To enable comparisons between different configura-tions of the forecasting system, the unweighted average of the two percentages was used to synthesise these two numbers. It was found to reflect the following points: avalanche days are quite rare, but not forecasting an avalanche is considered a serious error; occasionally forecasting avalanches on a day where none occur is less serious. Using the unweighted average ensured that it would be adversely affected by even a few avalanches being wrongly forecast out of a low overall total of avalanches.
The configurations evaluated
In evaluating the accuracy of the forecasting system, a number of configurations were examined.
• Buser’s NXD system forecast an avalanche would occur on a particular day if
three or more of the ten top ranked (most similar) historical days were avalanche days. This is a form of decision function. For the IR based forecasting system, it was decided to evaluate variations of this function. They took the form of testing if α avalanche days were in the top β ranked days where α had the range [1..70], and β had [3..100]. In addition, the treatment of the 9900 days as avalanche days
was also tried.
• The widths of the distributions associated with the parameters representing each
day was varied. A number of widths were examined, of which two, referred to as
narrow and wide, are illustrated in the results. The narrow configuration resulted in a discrete distribution with only 1 unit on either side of the central value, whilst the wide configuration had 20 units either side.
• Given that the triples resulting from the discretisation of the data are analogous to
words in an IR system, it was decided to attach Inverse Document Frequency
• Since avalanche conditions may build up as a result of meteorological and snow-pack conditions over a number of days, many NN models include data from days previous to the forecast day. In the system the representation of a day (both fore-cast and historical) was expanded to include parameters of the day previous to the represented day. Those additional parameters were given a reduced weighting.
The results
Initial tests of the configurations were performed on the SAIS data set. These in-cluded the use of IDF and treating 9900 days as avalanche days. These different con-figurations made little difference to the accuracy of the system, which in all cases was found to be around 80%. Thus it was decided that when examining the larger SLF data set, these particular configurations would not be considered.
The SLF data was tested over a variety of decision functions in the following configu-rations: using narrow and wide distributions; and adding into the representation of a day, the parameters of the day previous to it. The results of the forecasts under these configurations are displayed in Table 4.
Results from the SLF data shows significant differences across configurations, with the best accuracy being achieved with the inclusion of a previous day, and a wide dis-tribution.
Discussion of Results
Overall, the results showed that the forecasting accuracy of the IR system was equivalent to that of previous ‘custom made’ systems, with McLung quoting figures of 79% [2] for dry snow avalanche prediction, Buser reporting performances with an upper level of 80% [3], and the SAIS reporting performance of 76% [D.S.B. Wright, personal communication]. Therefore, it was concluded that the methodology that adapted the numerical historical day data into an appropriate form for a text-based IR
system worked well. Conclusions drawn from the various configurations tested are now discussed.
α in β
days
Parameters of single day only Parameters of previous day included also
Narrow Wide Narrow Wide
[image:9.595.169.457.511.647.2]1 in 3 64.5 (63 66) 70.5 (73 68) 67.0 (63 71) 74.5 (77 72) 3 in 10 66.0 (52 80) 70.0 (64 76) 67.5 (52 83) 75.5 (70 81) 4 in 20 68.0 (68 68) 71.0 (80 62) 69.5 (67 72) 75.5 (84 67)
SAIS data
The lack of difference between the different sets of results for the SAIS was at first surprising. The use of IDF was expected to remove extraneous noise from the system. However, the matching to the historical data is very specific and thus might be ex-pected to improve the signal to noise ratio to such an extent that IDF is unlikely to further improve the system.
The lack of significant improvement generated by the use of the no visibility days in the decision function is less easily explained, and further trials with different weights attached to 9900 days are required to examine their importance more closely.
SLF data
Results from the SLF data showed improvement with the addition of previous day parameters to the representation of days. The addition of these parameters provided a better discrimination between days, which resulted in improved forecasts. The use of wide distributions resulted in a marked improvement of the results on the SLF data, with a forecasting accuracy of around 75% in the optimum configuration.
Further Work
One area in which the IR system will allow further investigation, is the incorporation of textual information into the data sets. Avalanche forecasters regularly use descrip-tive terms to describe the prevailing weather and resulting events, and the incorpora-tion of these data might be used to augment the representaincorpora-tion of a day, and thus the efficacy of the forecasts.
The system described above did not use weighting to bias the perceived importance of different parameters over others and the use of such weightings should be investi-gated.
Finally, as the methodology used to adapt the numerical data for use in a text-based IR system has been shown to work well, similar types of forecasting, for such events as floods, may be examined.
Conclusions
In this paper a methodology was presented for incorporating non-textual multivariate data into a conventional text-based IR system. Through a series of experiments over two data sets, this method was shown to provide an effective tool for use in ava-lanche forecasting that is comparable in performance to existing avaava-lanche forecasting systems.
Acknowledgements
IDOMENEUS network of excellence. Mark Sanderson was supported by the VIPIR project funded by the University of Glasgow.
References
1. McClung, D. & Schaerer, P. The Avalanche Handbook. Cordee, 1993
2. McClung, D. & Tweedy, J. Numerical avalanche prediction - Kootenay Pass, British Columbia, Canada. Journal of Glaciology, 40(135):[350-358], 1994.
3. Buser, O. et al. Avalanche forecast by the nearest neighbour method. In Avalanche Formation, Movement and Effects, (Proceedings of the Davos Symposium, Sep-tember 1986). IAHS Publ. no. 162, 1987
4. Buser, O. Avalanche forecast with the method of nearest neighbours: An iterative approach. Cold Regions Science and Technology, 8:[155-163], 1983.
5. Buser, O. Two years of operational avalanche forecasting using the nearest neigh-bours method. Annals of Glaciology, 13:[31-34], 1989
6. Purves, R.S., Barton, J.S. & Wright, D.S.B. Automated measurements of snow temperature profiles in the Cairngorm mountains, Scotland. Meteorological appli-cations, 2 [199-207], 1995.
7. van Rijsbergen, C.J. Information retrieval (second edition), in London: Butter-worths, 1979.
8. Sanderson, M. Word Sense Disambiguation and Information Retrieval, PhD The-sis, Technical Report (TR-1997-7) of the Department of Computing Science at the University of Glasgow, Glasgow G12 8QQ, UK.
9. Sanderson, M. & Ruthven, I. Report on the Glasgow IR group (glair4) submis-sion, In the proceedings of the 5th TREC conference (TREC-5) published by NIST, 1996.