Identification, Characterisation and
Quantification of Proteins used in
Chemical Communication
Thesis submitted in accordance with the requirements of the University
of Liverpool for the degree of Doctor in Philosophy
by
Jennifer M Unsworth
Acknowledgments
Firstly I would like to thank my supervisors Professor Rob Beynon and Professor
Jane Hurst for giving me the opportunity to do this PhD and for their guidance,
enthusiasm and patience over the past four years. I would also like to thank
Professor Elke Zimmerman and Professor Ute Radespial for allowing me to
collaborate with them on the mouse lemur work.
Special thanks goes to the following: the amazing Lynn who has helped me out with
pretty much everything over the past 4 years you have also been a great friend to
me which I am incredibly grateful for. To Stu and Deb for their help and guidance
with the QconCAT work and Lupe for answering my MUP related questions and for
being so approachable and letting me chat to you about my data. Thank you also to
Rachel for allowing me to collaborate with you on the harvest mouse work and to Amanda for collecting samples for me whenever I needed them and for providing
musical entertainment in the lab. Many thanks to Duncan for teaching me de novo
sequencing and the principles of anion exchange chromatography and to Philip for
his technical assistance with the instruments. I apologise for all the times I woke
you up from you naps with the depressing sentence – the E. Coli hits are down...
To my lovely friends Vicki and Yvonne – I honestly don’t know what I would have
done without all your support, I dread to think how much pork related produce,
teacakes and wine we have gone through over the past couple of years.
A big thank you to my family – Mum, Dad, Steph and Phil for your constant love and
support. I am very lucky to have you! Much love to Bubbles, Mo and Gabriella (and
Nibbies) for listening to my thesis woes at all hours of the night when all you
wanted to do was play on your wheels and eat seeds. Finally I would like to thank
my partner Chris for your love, hugs and cups of tea and for always encouraging and
reassuring me. I imagine you are just as pleased as I am that this thesis is finally
Abstract
Abstract
Identification, characterisation and quantification of proteins used in chemical communication.
Most animals have excretory systems to remove soluble waste. In humans soluble
waste is mainly excreted through the urinary system. Kidneys, urinary bladder and
urethra make up this system and are responsible for the production of urine by
filtration, reabsorption and secretion. Under normal circumstances urine contains
water, creatinine, urea and salts. In humans, the presence of elevated levels of
protein or glucose is indicative of medical conditions such as impaired kidney
function and diabetes. Some animals are an exception to this. Rodents such as the
house mouse (Mus musculus), Norway rat (Rattus norvegicus), bank vole (Myodes glareosin) and Roborovski hamster (Phodopus roborovskii) excrete substantial amounts of protein in their urine yet their renal function remains intact. These
proteins belong to the lipocalin family and play an essential part in chemical
signalling. Their size (18-19kDa) allows them to escape from being filtered out of
the urine during the ultrafiltration step resulting in their excretion in the urine.
Many of these proteins share a high sequence identity and genomic data is often
incomplete or absent. One aspect of this thesis looks at developing a quantification
method for a set of highly homologous lipocalins in mice. Another was to
characterise and identify proteins excreted in the harvest mouse (Micromys minutus) and mouse lemur (Microcebus) in the absence of genomic data and see if they are related to the lipocalin family or if they belong to a completely different
group of proteins.
Using mass spectrometric techniques a method to quantify major urinary proteins
(MUPS), lipocalins found in mice, was developed and implemented. A
quantification concatemer (QconCAT) was designed to do this and was based on
genomic data from the laboratory strain of mouse C57BL/6. MUP isoforms were
successfully quantified in both male and female C57BL/6 mice. The QconCAT
mice. Females express more MUP during the estrous stage with a decline in
expression seen during the proestrous.
For the second part of this thesis, lipocalin expression in the harvest mouse
(Micromys minutus) was investigated. Urine samples collected from male and female harvest mice revealed proteins approximately 18-19 kDa expressed in both
sexes. The concentration of protein in urine was much lower than that observed in
other rodents. Alternative areas of protein excretion were explored and revealed
the same protein to be excreted in much higher concentrations from the saliva
and/or paws. Again mass spectrometry was employed to identify and characterise
these proteins. A preliminary discovery analysis identified proteins that shared high
homology with other lipocalins including MUPS and odorant binding proteins.
Intact mass analysis also confirmed the presence of three abundant proteins in both
males and females. Anion exchange chromatography was used to separate the
proteins for de novo sequence analysis which confirmed that harvest mice excrete proteins belonging to the lipocalin family.
The final section of this thesis examines characterising protein expression in the
mouse lemur (Microcebus). Although they are classed as primates not rodents, mouse lemurs are known to respond to urinary chemosignals from their
conspecifics. Urine samples were collected from two species of mouse lemur
-Microcebus murinus and Microcebus lehilahytsara. As mouse lemurs have a specific breeding season samples were collected both in and out of season. Some of the
male mouse lemurs from both species expressed a large amount of protein during
reproductive season. No protein was observed in females. Intact mass analysis
identified a protein at 9388 Da in the M. murinus and 9418 Da in the M. lehilahytsara. Unlike many members of the rodent family who excrete large quantities of lipocalins, de novo sequencing confirmed this protein to be a member of the Whey Acidic Protein family (WAPS). WAPS are expressed across many
lineages and have a variety of functions including antibacterial and antifungal
action, protease inhibition, tumour suppression and anti-inflammatory activity. No
protease inhibition by the mouse lemur protein was observed and further studies
Table of Contents
Table of Contents
List of Figures... i
List of Tables... v
Appendices... vi
Abbreviations... vii
1. Introduction... 1
1.1 Animal communication... 1
1.2 Scent marking... 2
1.3 Volatiles... 4
1.4 Involatiles... 6
1.4.1 Major Urinary Proteins... 6
1.4.2 Major Histocompatibility Complex... 18
1.4.3 Exocrine-gland secreting peptides... 19
1.5 Pheromone detection... 19
1.5.1 Main olfactory system... 19
1.5.2 Accessory olfactory system... 22
1.6 Discovery, identification and quantification of pheromones... 23
1.6.1 Discovering the complexity of a scent mark... 24
1.6.2 Identification of proteins in a scent mark... 25
1.6.3 Quantification of proteins in a scent mark... 30
1.6.3.1 Relative Quantification... 32
1.6.3.2 Absolute Quantification...34
1.7 Aims and objectives... 38
2. Materials and methods... 40
2.1 Sample collection... 41
2.2 Protein assay... 43
2.3 Creatinine assay... 43
2.4 SDS-PAGE... 43
2.5 Protein digestion... 43
2.6 Peptide mass fingerprinting... 46
2.7 Electrospray – mass spectrometry of intact proteins... 46
2.8 Tandem mass spectrometry... 47
2.9 De novo sequencing... 49
2.10 Database searching... 49
2.11 Anion exchange chromatography... 50
2.12 QconCAT design...50
2.13 Bacterial transformation... 50
2.14 Cell culture and purification of MUP QconCAT... 51
2.15 Cell culture and purification of labelled darcin... 52
3. Quantification of mouse major urinary proteins... 54
3.1 Introduction... 54
3.2 Aims and objectives... 54
3.3 Results and discussion... 55
3.3.1 Design of a QconCAT for the quantification of MUPs... 55
3.3.2 Optimising proteolysis of the native protein... 65
3.3.3 Co-digestion and LC-MS analysis of analyte and QconCAT... 71
3.3.4 Quantification of MUPs using a doubly labelled QconCAT and darcin... . 82
3.4 Conclusions...107
4. Protein secretion in the harvest mouse (Micromys minutus)...115
4.1 Introduction... 115
4.2 Results and discussion...118
4.2.1 Examination of the urine content of the harvest mouse... 118
4.2.2 Peptide mass fingerprinting of urine samples... 118
4.2.3 Investigating other sources of protein secretion... 123
4.2.4 Peptide mass fingerprinting of washes and saliva samples... 125
4.2.5 Determination of an accurate molecular weight... 130
4.2.6 Discovery analysis... 132
4.2.7 Protein purification for de novo sequencing... 137
4.2.8 De novo sequencing analysis... 138
4.2.9 Determination of the harvest mouse protein sequences... 142
4.3 Conclusions... 158
5.Seasonal expression of urinary proteins in the male mouse lemur (Microcebus)... 164
5.1 Introduction... 165
5.2 Aims and objectives... 166
5.3 Results and discussion... 166
5.3.1 Identification of a sex-specific protein in male mouse lemurs (Microcebus)... 166
5.3.2 Determination of an accurate molecular weight... 171
5.3.3 Peptide mass fingerprinting... 171
5.3.4 De novo sequencing ... 176
5.3.5 Determination of the mouse lemur protein sequence... 177
5.3.6 Sequence differences between species... 196
5.3.7 Identification of a novel Whey acidic protein... 201
5.3.8 Potential functions of the mouse lemur WDFC 12 protein... 202
5.4 Conclusions... 207
6. General discussion...208
List of Figures
i
List of Figures
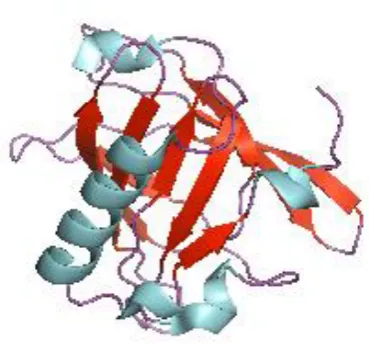
Fig 1.1 The tertiary structure of a lipocalin 9
Fig 1.2 The tertiary structure of mouse MUP 1 with bound ligand 11
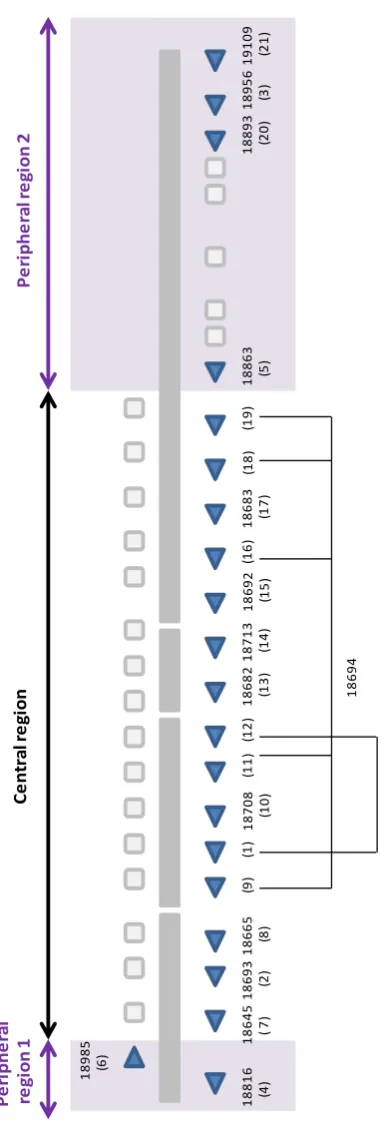
Fig 1.3 Mouse MUP gene cluster 14
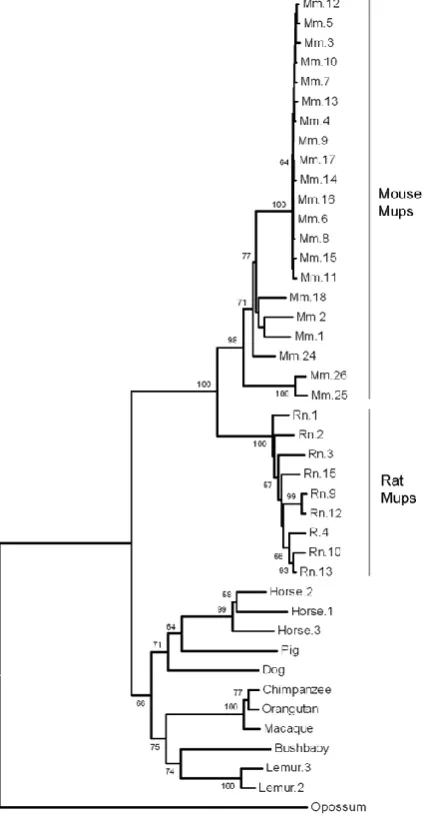
Fig 1.4 Phylogeny of MUP coding sequences in mammals. 17
Fig 1.5 Anatomical representation of the mammalian olfactory system 21
Fig 1.6 LC-MS/MS workflow 27
Fig 1.7 Peptide fragmentation chemistry 28
Fig 2.1 Animal systems used for sample collection 42
Fig.3.1 Alignment of MUP amino acid sequences based on the C57BL/6
genome
58
Fig.3.2 Proteolytic maps of MUP amino acid sequences 59
Fig. 3.3 LysC Peptides selected for incorporation into the MUP QconCAT
and their relative location in the MUP protein
61
Fig. 3.4 Strategy for the quantification of MUPS 62
Fig. 3.5 Expression and purification of the MUP QconCAT 63
Fig. 3.6 MALDI-TOF analysis of purified QconCAT 64
Fig. 3.7 Digestion of MUPs and QconCAT using a standard in-solution
digest protocol
66
Fig. 3.8 Digestion of MUPS using a standard in-solution digest protocol
plus RapiGest™
68
Fig. 3.9 Digestion of MUPs using increasing concentrations of RapiGest™ 69
Fig. 3.10 RapiGest™ time course experiment. 70
Fig. 3.11 Workflow to determine the cause of incomplete digestion of
MUPS
72
Fig. 3.12 SDS-PAGE analysis to identify the cause of incomplete digestion
of MUPS
73
Fig. 3.13 Observing the degree of digestion using decreasing amounts of
MUP in the starting material
74
Fig. 3.14 Proteolysis of MUPS with LysC using the optimised digest
method
75
Fig. 3.15 Comparison between C18 and C4 column chromatography 78
Fig. 3.16 Tryptic fragments selected for incorporation into the MUP
QconCAT and their relative location in the MUP protein
79
Fig. 3.17 Strategy for the quantification of MUPS using trypsin 80
Fig. 3.18 Revised MUP quantification workflow 81
Fig. 3.19 Expression and purification of a doubly labelled MUP QconCAT 83
Fig. 3.20 MALDI-TOF analysis of purified doubly labelled QconCAT 84
Fig. 3.21 Expression and purification of a doubly labelled darcin standard 85
Fig. 3.22 MALDI-TOF analysis of purified labelled darcin 86
Fig. 3.23 Isotopic profiles of peptides 5 and 13 87
Fig. 3.24 The conversion of amide to acid with increasing pH 89
Fig. 3.25 The effect of deamidation on ionisation 90
Fig. 3.26 Sequence comparison between MUP QconCAT and 18694 92
Fig. 3.27 Quantification of individual MUP variants expressed in male and
female C57BL/6 mice
95
Fig. 3.28 A comparison between C57BL/6 male and female MUP
expression
96
Fig. 3.29 Comparison of QconCAT quantification and protein assay 97
ii
Fig. 3.31 Comparison of QconCAT darcin quantification and SDS-PAGE 99
Fig. 3.32 Comparison of C57BL/6 male QconCAT quantification and intact
mass analysis
101
Fig. 3.33 Comparison of C57BL/6 female QconCAT quantification and
intact mass analysis
102
Fig. 3.34 Quantification of individual MUP isoforms expressed during the
mouse estrous cycle
105
Fig. 3.35 Comparison of MUP expression in individual females during the
estrous cycle
106
Fig 3.36 Deamidation reaction 110
Fig. 4.1 SDS-PAGE analysis of male and female harvest mouse urine 119
Fig. 4.2 Peptide mass fingerprint comparison of the two protein bands
identified by SDS-PAGE
120
Fig. 4.3 Peptide mass fingerprint comparison between male and female
M. minutus – protein band 1
121
Fig. 4.4 Peptide mass fingerprint comparison between male and female
M. minutus – protein band 2
122
Fig. 4.5 SDS-PAGE analysis of Glass rod washes from the cages of male
and female harvest mice
124
Fig. 4.6 Protein and creatinine assays of harvest mouse glass rod washes 126
Fig. 4.7 SDS-PAGE analysis of saliva, paw washes, body washes, glass rod
washes and urine from male and female harvest mice
127
Fig. 4.8 Peptide mass fingerprint comparison between paw, body and
glass rod washes, saliva and urine from harvest mice – protein band 1
128
Fig. 4.9 Peptide mass fingerprint comparison between paw, body and
glass rod washes, saliva and urine from harvest mice – protein band 2
129
Fig. 4.10 Determination of an accurate molecular weight of the protein
bands identified by SDS-PAGE in male and female harvest mice
131
Fig. 4.11a Base peak chromatograms from LC-MS discovery run 135
Fig. 4.11b Base peak chromatograms from LC-MS discovery run 136
Fig. 4.12 Harvest mouse protein purification using anion exchange
chromatography
139
Fig. 4.13 Identification of proteins present in AEX fractions 140
Fig. 4.14 Sequence alignment of harvest mouse protein 16724 Da with
odorant binding protein 2 (Myodes glareolus)
144
Fig. 4.15 Sequence alignment of harvest mouse protein 16437 Da with
odorant binding protein 3 (Myodes glareolus)
145
Fig. 4.16 LysC Peptide mass fingerprint to compare to the masses from
peptides that were de novo sequenced
146
Fig. 4.17 De novo sequence analysis of the processed MS/MS spectra of
M. minutus tryptic peptide 847 m/z (16724 Da protein)
148
Fig. 4.18 De novo sequence analysis of the processed MS/MS spectra of
M. minutus LysC peptide 1101 m/z (16724 Da protein)
149
Fig. 4.19 De novo sequence analysis of the processed MS/MS spectra of
M. minutus GluC peptide 1471 m/z (16724 Da protein)
150
Fig. 4.20 De novo sequence analysis of the processed MS/MS spectra of
M. minutus tryptic peptide 1753 m/z (16724 Da protein)
151
Fig. 4.21 De novo sequence analysis of the processed MS/MS spectra of
M. minutus tryptic peptide 1114 m/z (16437 Da protein)
152
List of Figures
iii
M. minutus tryptic peptide 870 m/z (16437 Da)
Fig. 4.23 De novo sequence analysis of the processed MS/MS spectra of
M. minutus LysC peptide 2138 m/z
154
Fig. 4.24 De novo sequence analysis of the processed MS/MS spectra of
M. minutus GluC peptide 1043 m/z (16437 Da protein)
155
Fig 4.25 Harvest mouse peptides aligned with MUPs 160
Fig. 5.1 SDS-PAGE analysis of male and female Microcebus murinus
urine samples
167
Fig. 5.2 SDS-PAGE analysis of male and female Microcebus lehilahytsara
urine samples
168
Fig. 5.3 Determination of protein concentration in M. murinus males
during the breeding season
169
Fig. 5.4 Determination of protein concentration in M. lehilahytsara
males during the breeding season
170
Fig. 5.5 Determination of the molecular weight of the male specific
urinary protein in the Microcebus murinus urine samples
172
Fig. 5.6 Determination of the molecular weight of the male specific
urinary protein in the Microcebus lehilahytsara urine samples
173
Fig. 5.7 Peptide mass fingerprinting comparison between the two
mouse lemur species
174
Fig. 5.8 Identification of the +16 Da adduct observed in the ESI-MS data 175
Fig. 5.9 Sequence alignment of the mouse lemur peptide sequences
with WAP 4 –disulphide core domain 12 (Lemur catta)
178
Fig. 5.10 Peptide map of the final mouse lemur sequence 181
Fig. 5.11 De novo sequence analysis of the processed MS/MS spectra of
M. murinus tryptic peptide 961 m/z
182
Fig. 5.12 De novo sequence analysis of the processed MS/MS spectra of
M. murinus LysC peptide 1274 m/z
183
Fig. 5.13 De novo sequence analysis of the processed MS/MS spectra of
M. murinus tryptic peptide 1888 m/z
184
Fig. 5.14 De novo sequence analysis of the processed MS/MS spectra of
M. murinus AspN peptide 1125 m/z
185
Fig. 5.15 De novo sequence analysis of the processed MS/MS spectra of
M. lehilahytsara GluC peptide 1588 m/z
186
Fig. 5.16 De novo sequence analysis of the processed MS/MS spectra of
M. lehilahytsara GluC peptide 1116 m/z
187
Fig. 5.17 De novo sequence analysis of the processed MS/MS spectra of
M. lehilahytsara AspN peptide 1060 m/z
188
Fig. 5.18 De novo sequence analysis of the processed MS/MS spectra of
M. lehilahytsara tryptic peptide 746 m/z
189
Fig. 5.19a Trypsin PMF comparison with theoretical digest of mouse lemur
protein
192
Fig. 5.19b LysC PMF comparison with theoretical digest of mouse lemur
protein
193
Fig. 5.19c GluC PMF comparison with theoretical digest of mouse lemur
protein
194
Fig. 5.19d GluC PMF comparison with theoretical digest of mouse lemur
protein using an extended mass range for detection
195
Fig. 5.20 Alignment of mouse lemur sequence using peptide masses from
PMFs
197
Fig. 5.21 Alignment of the final mouse lemur sequence with the genome
data from both L. catta and M. murinus
iv
Fig. 5.22 Final sequences of the mouse lemur WFDC 12 protein 199
Fig. 5.23 Structural analysis of the mouse lemur protein 200
Fig. 5.24 Assessment of trypsin inhibition following incubation with the
mouse lemur WFDC protein
205
Fig. 5.25 Assessment of elastase inhibition following incubation with the
mouse lemur WFDC protein
List of Tables
v
List of Tables
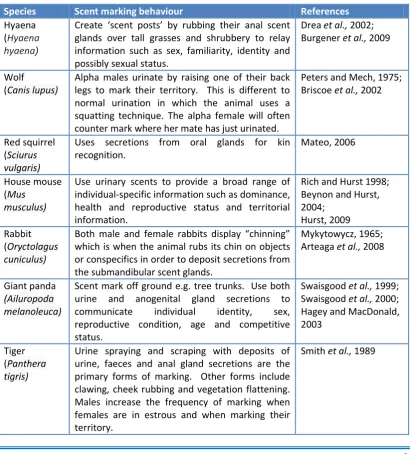
Table 1.1 Examples of scent marking behaviours in mammals 3
Table 1.2 A list of functional and pseudo MUP genes in 11 different
species
16
Table 3.1 A summary of peptides used in MUP quantification 94
Table 3.2 A summary of MUP proteins quantified in B6 mice 103
Table 4.1 Examples of lipocalin expression in rodents 115
Table 4.2 A list of abundant masses from the peptide mass
fingerprint analysis of the two protein bands identified by SDS-PAGE.
123
Table 4.3 A comparison between the abundant masses observed in
the original urine PMF and the saliva, glass rod, paw and body washes
130
Table 4.4 Peptide sequence tags from PEAKS database search 134
Table 4.5 BLAST results of harvest mouse protein sequences
obtained from LC-MS analysis
141
Table 4.6 A comparison between the masses observed by PMF
analysis and the sequence data
146
Table 4.7 A summary of all peptides de novo sequenced from the
harvest mouse in-solution digest of 16724 Da.
156
Table 4.8 A summary of all peptides de novo sequenced from the
harvest mouse in-solution digest of 16437Da.
157
Table 5.1 Peptide sequences identified from PEAKS de novo analysis 176
Table 5.2 BLAST results of mouse lemur sequences obtained from
LC-MS analysis
177
Table 5.3 AspN sequences to support C terminal sequence data
collected from digests with alternative proteases
179
Table 5.4 A summary of all peptides de novo sequenced from the M.
murinus in-solution digests
190
Table 5.5 A summary of all peptides de novo sequenced from the M.
lehilahytsara in-solution digests
vi
Appendices
Supplementary data A Extracted ion chromatograms of heavy:light peptide pairs
used in the quantification of B6 male and female mice.
Supplementary data B MS/MS spectra used to determine the harvest mouse
protein sequences
Supplementary data C MS/MS spectra used to determine the mouse lemur
protein sequences
Abbreviations
vii
Abbreviations
2D-PAGE Two dimensional polyacrylamide gel electrophoresis
°C Degrees centigrade
μg Microgram
μl Microlitre
A Alanine
AEX Anion exchange chromatography
Ala Alanine
AOB Accessory olfactory bulb AQUA Absolute quantification
Arg Arginine
Asn Asparagine
Asp Aspartic acid
Asp N Endoproteinase Asp N
BAPNA Nα-Benzoyl-L-arginine 4-nitroanilide
BLAST Basic Local Alignment Sequence Tool
BSA Bovine serum albumin
C Cysteine
CaCl2 Calcium Chloride
CID Collision induced dissociation C-terminus Carboxy-terminus
Cys Cysteine
D Aspartic acid
D Diestrus
Da Dalton
D-P Diestrus-Proestrus
DTT Dithiotreitol
E Estrus
E Glutamic acid
E-M Estrus-Metestrus
E. coli Escherichia coli
ELISA Enzyme-linked immunosorbent assay
ESI-MS Electrospray ionisation mass spectrometry ESP Exocrine gland secreting peptide
ETD Electron transfer dissociation
F Phenylalanine
GC-MS Gas chromatograph mass spectrometry
GG Grueneberg ganglion
Gln Glutamine
Glu Glutamic acid
Glu C Endoproteinase Glu C
H Histidine
HCD Higher-energy collisional dissociation
HCl Hydrochloric acid
HEPES 4-(2-hydroxyethyl)-1-piperazineethanesulfonic acid
His Histidine
I Isoleucine
ICAT Isotope-coded affinity tags IEF Isoelectric focusing
Ile Isoleucine
viii
kDa Kilodalton
kV Kilovolts
L Leucine
L Litre
LC-MS Liquid chromatography-Mass spectrometry
Leu Leucine
Lys Lysine
Lys C Endoproteinase Lys C
M Metestrus
M Methionine
M Molar
M-D Metestrus-Diestrus
MALDI Matrix assisted laser desorption ionisation
MALDI–TOF-MS Matrix-assisted laser-desorption ionization–time of flight MaxENT Maximum Entropy Modeling
MES 2-(N-morpholino) ethanesulphonic acid
Met Methionine
mg Milligram
MHC Major histocompatibility complex
mM Millimolar
MOB Main olfactory bulb MOE Main olfactory epithelium
MS Mass spectromtery
MS/MS Tandem mass spectrometry MUP Major urinary protein
m/z Mass to charge ratio
N Asparagine
Native PAGE Native polyacrylamide gel electrophoresis NMR Nuclear magnetic resonance spectroscopy N-terminus Amino-terminus
OR Olfactory receptor
OSN Olfactory sensory neuron
P Proline
P Proestrus
P-E Proestrus-Estrus
Phe Phenylalanine
pI Isoelectric point
PMF Peptide mass fingerprinting Pr:Cr Protein: creatinine ratio
Pro Proline
PSAQ Protein standard for absolute quantification
Q Glutamine
QconCAT Quantification concatamer
Q-peptide Quantification peptide (from QconCAT)
Q-ToF Quadrupole/Orthogonal Time of Flight Mass Spectrometer
R Arginine
rpm Revolutions per minute
SDS-PAGE Sodium dodecyl sulfate polyacrylamide gel electrophoresis SILAC Stable isotope labelling by/with amino acids in cell culture
SO Septal organ of Masera
T Threonine
Abbreviations
viiii Tris 2-amino-2-hydroxymethyl propane-1, 3-diol
Trp Tryptophan
Tyr Tyrosine
UPLC Ultra performance liquid chromatography
V Valine
V1R Vomeronasal family 1 receptor V2R Vomeronasal family 2 receptor
Val Valine
VNO Vomeronasal organ
VSN Vomeronasal sensory neuron
W Tryptophan
WAP Whey acidic protein
WFDC Whey acidic four disulphide core protein
1
Chapter 1: Introduction
1.1 Animal communication
Animal communication can be defined as the transfer of information from one
animal to another that results in a behavioural change in the receiver.
Communication is often in the form of visual, auditory and olfactory cues. Visual
signals frequently include gestures, facial expressions, body posture and mimicry.
Herring gull chicks exhibit a begging response upon presentation of the parents’
beak which signals feeding time to the chicks (Tinbergen and Perdeck, 1951; Ten
Cate et al., 2009). Aggressive, dominant wolves will often have high body posture and raised hackles while submissive ones lower their tails and ears and carry their
bodies low (Sillero-Zubiri, 2004). Others examples of visual signalling include
peacocks attracting peahens by erecting and displaying their impressive trains and
chameleons change colour to reflect their physiological state and intentions to
conspecifics (Stuart-Fox and Moussalli, 2008).
Auditory signals are also regularly used as a form of communication between
animals. Male pacific walruses use acoustic displays to attract a female during the
breeding season and to warn other competing males (Fay 1982; Stirling et al.,
1987). Lactating female guinea pigs respond to vocal calls from their pups (Kober et al., 2007) while ultrasonic calls in red deer play a key role in sexual behaviour (Pomerantz and Clemens, 1981).
While visual and auditory cues are frequently used by most animals, olfactory
signals are the primary source of communication. The advantage of olfactory
signalling is information about the depositor is still able to be detected after they
have left the scene, which is particularly useful for defending territories etc.
Olfactory signals are deposited in the form of scent marks and provide more
Chapter 1: Introduction
2
1.2 Scent marking
Scent marking is a behaviour by which glandular secretions are deposited on the
ground or onto objects in an animal's environment (Johnson, 1973). These
secretions are often in the form of urine, faeces or are excreted from specialised
scent glands. Most animals display scent marking behaviour and use it as a form of
communication between conspecifics (Brown and MacDonald, 1985) with glandular
secretions, urine and faeces being placed in noticeable places in their
territories/home ranges, often in lines or along paths and boundaries (Gosling and
Roberts, 2001). By placing scent marks in this manner, an individual can define and
defend their territory from invading conspecifics. These scent marks contain
information such as sex, species, individual identity, social status and the prescence,
age and location of the marking (Brown and MacDonald, 1985; Hurst, 1993; Gosling
and Roberts, 2001; Hurst et al., 2001; Petrulis, 2013). Examples of marking behaviour by various mammals are outlined on Table 1.1.
Males usually mark more than females with dominant males marking more than
others ensuring the markings stay fresh (Gosling, 1982). Although scent marking
has advantages such as conveying information about the signaller in their absence
and requiring less energy to produce than an acoustic signal, it does involve
significant cost in time and risk. The reasons behind scent marking are unclear but
there are several hypotheses. The first hypothesis is an individual tends to place
their markings around the edge of a territory; the markings serve as fence or
warning sign for conspecifics not to enter the territory. However most species
studied will cross into territories despite the markings (Gosling and McKay, 1990)
the exceptions being male moles and beavers who avoid marked sites (Gosling and
Stone, 1990; Sun and Muller-Schwarze 1998). The second hypothesis is a trespasser
will learn the scent of the signaller so if they encounter the owner of the scent they
will recognise this and avoid fights they are likely to lose (Gosling and Roberts,
2001). The third hypotheses propose that animals establish boundaries with major
competitors and therefore prevent costly disagreements between territory owners
3
Animals can counter-mark existing scents. This can be in the form of over-marking
where an individual will partially or completely cover the existing scent of another
individual or by adjacent marking where an individual will mark nearby the existing
scent of another individual (Johnston et al., 1994). Outcomes of over-marking include scent blending, individual scents that have been over-marked remain
distinct or scent masking which has been observed in male Syrian hamsters who
ignore earlier marks and only treat the most recent top marking as “familiar”
(Johnston et al., 1994). Territory owners will often verify their ownership by over-marking an intruder’s scent. In mice dominant males appear not to over-mark their
own scent or that of a genetically identical individual (Hurst, 1990; Nevison et al.,
[image:18.595.115.527.329.784.2]2000).
Table 1.1 Examples of scent marking behaviours in mammals
Species Scent marking behaviour References
Hyaena (Hyaena hyaena)
Create ‘scent posts’ by rubbing their anal scent glands over tall grasses and shrubbery to relay information such as sex, familiarity, identity and possibly sexual status.
Drea et al., 2002; Burgener et al., 2009
Wolf
(Canis lupus)
Alpha males urinate by raising one of their back legs to mark their territory. This is different to normal urination in which the animal uses a squatting technique. The alpha female will often counter mark where her mate has just urinated.
Peters and Mech, 1975; Briscoe et al., 2002
Red squirrel
(Sciurus
vulgaris)
Uses secretions from oral glands for kin recognition.
Mateo, 2006
House mouse (Mus
musculus)
Use urinary scents to provide a broad range of individual-specific information such as dominance, health and reproductive status and territorial information.
Rich and Hurst 1998; Beynon and Hurst, 2004;
Hurst, 2009 Rabbit
(Oryctolagus
cuniculus)
Both male and female rabbits display “chinning” which is when the animal rubs its chin on objects or conspecifics in order to deposit secretions from the submandibular scent glands.
Mykytowycz, 1965; Arteaga et al., 2008
Giant panda
(Ailuropoda melanoleuca)
Scent mark off ground e.g. tree trunks. Use both urine and anogenital gland secretions to communicate individual identity, sex, reproductive condition, age and competitive status.
Swaisgood et al., 1999; Swaisgood et al., 2000; Hagey and MacDonald, 2003
Tiger
(Panthera
tigris)
Urine spraying and scraping with deposits of urine, faeces and anal gland secretions are the primary forms of marking. Other forms include clawing, cheek rubbing and vegetation flattening. Males increase the frequency of marking when females are in estrous and when marking their territory.
Chapter 1: Introduction
4
Both physiological and behavioural responses have been observed in response to
scent marking. In mice and rats, female puberty is accelerated in the presence of
male urine and can be delayed by the presence of female urine amongst
group-housed females (Drickamer, 1977; Mucignat-Caretta et al., 1995; Novotny et al.,
1999). Urine from males will promote aggression in other males and attract
females (Novotny et al., 1985; Lacey et al., 2007; Roberts et al., 2010). In female gray short tailed opossums, estrous is only ever induced in response to a male scent
mark (Harder et al., 2008). Decreased testosterone levels have been observed in male gray mouse lemurs post exposure to dominant male urine (Schilling et al.,
1984). Male giant pandas in response to rival scent marks will significantly increase
their sexual motivation and become more interested in estrous females (Bian et al.,
2013). Exposure to dominant male urine will suppress aggression, scent marking
and production and territorial patrolling in male blackbuck antelopes (Rajagopal et al., 2010).
A scent mark usually contains pheromones which are responsible for the relaying
information about the signaller and cause the behavioural and physiological
changes observed. Pheromones are described as ‘substances which are secreted to
the outside by an individual and received by a second individual of the same
species, in which they release a specific reaction, e.g., a definite behaviour or a
developmental process’ (Karlson and Luscher, 1959). Pheromones are separated
into two categories – volatile and involatile. Volatile compounds tend to be small
molecules while involatile compounds usually include peptides and proteins.
1.3 Volatiles
Volatile pheromones require no extra energy investment by the signaller as they are
often by –products of metabolism (Wyatt, 2009). The advantage of a volatile
pheromone is that it can be detected even after the depositor has left the scene.
The disadvantage is they are lost to the environment quite soon after secretion of
the scent mark. Volatile pheromones have been identified in a number of mammals
and have been studied extensively in rodents, mice and rats in particular. A number
(GC-5
MS) analysis are present in the urine of both mice and rats.
2-sec-butyl-4,5-Dihydrothiazole and 2,3-dehydro-exobrevicomin are two pheromones found in
male mouse urine and promote inter-male aggression as well as puberty
acceleration and estrous synchronisation in females (Novotny et al., 1985; Jemiolo
et al., 1986; Novotny et al., 1999). They also bind to involatiles (major urinary proteins) (Novotny et al., 1985; Jemiolo et al., 1986). Male mouse urine also contains 6-hydroxy-6-methyl-3-heptanone and (methylthio)-methanethiol which
causes puberty acceleration and an attractant females respectively (Novotny et al.,
1999; Lin et al., 2005). Female urine contains 2-heptanone and 2,5 – dimethylpyrazine which both delay puberty with 2-heptanone potentially causing a
prolongation of estrous and 2,5 –dimethylpyrazine having the opposite effect and
suppressing estrous in grouped females (Novotny et al.,1986; Ma et al., 1998). Rat urine contains 2-heptanone and 4- ethylphenol both of which are attractive to
females (Zhang et al., 2008). 2-heptanone also serves as a fear pheromone causing anxiety and stress in rats (Sugai et al., 2006; Gutierrez-Garcia et al., 2007). Rat pups also emit dodecyl propionate from their preputial glands which serves as an
attractant to their mothers (Brouette-Lahlou et al., 1999).
Volatile pheromones have also been observed in other mammals. During estrous,
the urine of female Asian elephants contain high concentrations of
(Z)-7-dodecen-1-yl acetate, a sex pheromone that stimulates male sexual behaviour (Rasmussen,
1997). Female bovine urine contains 1-iodoundecane during estrous and serves as
an attractant to bulls (Kumar et al., 2000; Archunan and Kumar, 2013). Male black buck antelope urine has three volatile components - 3-hexanone,
6-methyl-5-hepten-2-one and 4-methyl-3-heptanone – all of which are only observed during
the dominance hierarchy period by dominant males (Rajagopal et al., 2010). A pheromone emitted by male goats – 4-ethyloctanal, is responsible for the activation
of gonadotropin releasing hormone (GnRH) a key hormone in the regulation of
estrous and reproduction, in female goats (Murata et al., 2014). Three volatile pheromones have been identified in female buffaloes - 1-chlorooctane,
4-methylphenol and 9-octadecenoic acid. Isolation of the three fractions saw sexual
Chapter 1: Introduction
6
volatiles 4-methylphenol and 9-octadecenoic acid. No responses were observed
with 1-chlorooctane (Rajanarayanan and Archunan, 2011).
1.4 Involatiles
The volatile components of a scent mark draw the receiver towards the location of
the scent mark and allow them to investigate the markings further. As volatiles are
metabolically produced, information such as health and reproductive status of the
signaller at the time of the marking is conveyed to the recipient. Involatile
pheromones have the advantage over volatile pheromones in that they are more
stable and continue to be present in the scent mark for some time. Examples of
involatile components are the major urinary proteins (MUPS), the major
histocompatibility complex (MHC) peptides and the exocrine gland secreting
peptides (ESP). These involatiles portray information such as individual identity and
the receiver must make direct contact with the scent mark to collect the required
information. The longevity and robustness of these pheromones means the scent
mark will not be mistaken as belonging to another individual.
1.4.1 Major urinary proteins
The excretory system is responsible for removing excess and unwanted materials
from an organism to prevent damage to the body and to maintain homeostasis.
Most animals have excretory systems to remove soluble waste. In mammals soluble
waste is mainly excreted through the urinary system (Kardasz, 2009). Kidneys,
urinary bladder and urethra make up this system and are responsible for the
production of urine by filtration, reabsorption and secretion.
The production of urine begins with an ultra filtration step. Filtration is one of the
main functions of the kidneys and uses special filtration units known as glomeruli,
which line the capillaries that make up the glomerulus (Ronco, 2007). The filtration
step is aided by a blood pressure difference between two arterioles –the afferent
arteriole which supplies blood to the glomerulus and the efferent arteriole in which
the blood exits the glomerulus (Atherton, 2012). This blood pressure difference
7
chloride, urea and glucose being forced through the glomerular capillaries to form a
fluid called glomerular filtrate. The capillaries have a low permeability to plasma
proteins, such as albumin, so the passage of large molecular weight products are
restricted (Larina et al., 2013).
The majority of the glomerular filtrate is then reabsorbed back into the blood as it
passes through the renal tubes. This enables the body to retain most if its nutrients
(Rubenstein et al., 2012). At the same time waste substances are then secreted into the tubular fluid, such as potassium ions, ammonium ions, creatinine, urea and drug
metabolites (Atherton, 2006) leading to the production of urine. This not only
removes excess amounts of these substances but also helps maintain a healthy
blood pH (approximately 7.4) (Atherton, 2006). Urine is then excreted via the
ureters, bladder and urethra.
Under normal circumstances urine contains water, creatinine, urea and salts. In
humans, presence of elevated levels of protein or glucose is indicative of medical
conditions such as impaired kidney function and diabetes (Bailey, 2011; Naresh et al., 2013). The urine content of some rodents such as the house mouse (Mus musculus) and the Norway rat (Rattus norvegicus) has been widely studied and it is well known that these rodents excrete a substantial amount of protein in their urine
yet their renal function remains intact. These proteins are known as major urinary
proteins (MUPs) and play an essential part chemosignalling (Beynon and Hurst,
2003). Mice in particular excrete high concentrations of MUP (up to 20 mg/ml per
day) which is a huge energy investment for each individual animal. The size
(18-19kDa) of these MUP proteins allows them to escape from being filtered out of the
urine during the ultrafiltration step resulting in their excretion in the urine
(Neuhaus, 1986).
MUPS belong to the lipocalin family of proteins. Lipocalins are a large group of
extracellular proteins. They are transport proteins that bind small hydrophobic
molecules. They also have other molecular recognition properties that include
Chapter 1: Introduction
8
soluble macromolecules (Flower, 1996; Flower et al., 2000). Lipocalins have highly conserved structures yet vary quite drastically on the sequence level. All lipocalins
have eight β-strands which together form a cup-shaped anti parallel β-barrel which
surrounds an internal ligand binding site (Flower et al., 1993). The eight strands of the barrel are connected by β-hairpin loops, the first loop being slightly larger than
the rest and forms a lid by folding back to close off the internal binding site (Flower
et al., 1993; Flower et al., 2000). The other end is closed off by a short N-terminal α-helical domain (Lucke et al., 1999) (Figure 1.1).
The structure of mouse MUPS has been defined by x-ray crystallography (Bocskei et al., 1991; Bocskei et al., 1992; Lucke et al., 1999; Timm et al., 2001). Similar to other lipocalins, MUPS have eight anti parallel β-strands that form a single β-sheet
surrounding a ligand binding cavity. The binding cavity contains several
hydrophobic residues with the highly conserved tryptophan residue (Try 19) at the
centre of the cavity (Flower et al., 1993)
MUP ligand binding
Mouse MUPS bind a number of volatile components in their hydrophobic cavity
including the male specific volatile pheromones mentioned in section 1.3 -
2-sec-butyl-4,5-Dihydrothiazole, 2,3-dehydro-exobrevicomin and
6-hydroxy-6-methyl-3-heptanone (Bacchini et al., 1992; Robertson et al., 1993; Novotny et al., 1999). Fractions of MUP isoforms by anion exchange chromatography has shown there is
some specificity of ligand binding (Robertson et al., 1993; Armstrong et al., 2005). The male specific isoform known as darcin not only binds more thiazole than the
other isoforms, it also binds it more tightly causing slower release of the volatile
from the scent mark (Armstrong et al., 2005; Roberts et al., 2010). Despite functional genes being present in both sexes, darcin is only expressed in male mice
(Mudge et al., 2008). Behavioural studies have revealed females are most attracted to the darcin component of male urine. MUPs were separated using anion
9
Figure 1.1 The tertiary structure of a lipocalin
Chapter 1: Introduction
10
All females showed the most interest in the darcin fraction (Roberts et al., 2010). To test whether this response was darcin or thiazole related a recombinant form of
darcin was produced and presented to the female mice (Roberts et al., 2010). Females were equally as attracted to the recombinant darcin suggesting darcin
protein itself acts as a sex pheromone. As darcin is a single protein that is not
polymorphic between males, it cannot provide the individual scent specific signal
that females require to recognize a particular male. Recognition of an individual
male is a result of a learned attraction by the females to the airborne volatiles
produced by individual males. This learned attraction by females is stimulated by
direct contact with darcin and results in the female learning and becoming attracted
to the airborne odours of a specific individual but no to that of other males (Roberts
et al., 2010; Roberts et al., 2012).
X-ray crystallography has been used to observe the interaction of MUPs and bound
ligands (Figure 1.2) (Bocskei et al., 1992; Timm et al., 2001). Two pheromones 2-sec-butyl-4,5-dihydrothiazole and 6-hydroxy-6-methyl-3-heptanone have been
shown to bind within hydrophobic cavity at one end of the β-barrel, formed by the
side chains of Phe56, Leu58, Leu60, Ile63, Leu72, Phe 74, Met87, Val100, Tyr102,
Phe108, Ala121, Leu123, Leu134, and Tyr138 (Timm et al., 2001). Furthermore, the exact orientation of the ligand binding has also been recognized by hydrogen
bonding between water molecules and the 2-sec-butyl-4,5-dihydrothiazole nitrogen
and the ketone oxygen group in 6-hydroxy-6-methyl-3-heptanone (Timm et al.,
2001). It is unclear exactly how the ligands reach the binding site as the cavity is
completely surrounded by side chains. A study by Zidek et al., 1999 showed, using NMR relaxation techniques, the backbone flexibility of the MUP protein increases as
it binds 2-sec-butyl-4,5-dihydrothiazole. Large conformational changes in the
protein allow the ligand access to the binding site and also significantly stabilises
the protein-pheromone complex (Zidek et al., 1999). Fluorescent probe studies with various MUP isoforms proved that different amino acid compositions inside
the binding pocket led to a decreased binding affinity and fluorescence yield for the
11
Figure 1.2 The tertiary structure of mouse MUP 1 with ligand.
Chapter 1: Introduction
12
One of the disadvantages of volatile ligands is they are lost to the environment after
a short period of time and when the MUP ligands are not bound to MUP protein
they fade away after only a few minutes (Robertson et al., 2001). MUPS have the ability to delay the release of these pheromones and therefore extend the lifetime
of the these chemical signals, with pheromones still being detected by conspecifics
up to 24 hours later (Hurst et al., 1998; Humphries et al., 1999).
MUP genetics
MUPS are products of a multigene cluster located on mouse chromosome 4
(Krauter et al., 1982). A gene cluster is usually defined as a set of two or more genes that encode for the same or similar products. They are created by gene
duplication and divergence. A gene is accidently duplicated during cell division so
its descendants have two copies of the gene which initially code for the same
protein. During the course of evolution these genes diverge so the product they
code for have different but related functions with genes still being adjacent to each
other on the chromosome (Ohno, 1970).
Extensive sequencing of the laboratory strain of mouse C57BL/6 has enabled
significant amount of information about this multigene cluster to be acquired.
Mudge et al., 2008 identified 19 functional MUP genes and 19 pseudogenes with further analysis by Logan et al., 2008 identifying a total of 21 intact genes and 21 pseudogenes. The multigene cluster could be separated into three groups on the
basis of phylogenetic analysis. Phylogenetic analysis is used to observe the
evolution of a genetically related group of organisms or study the relationships
between a collection of genes or proteins that are derived from a common
ancestor. One group of genes within the MUP cluster consisted of pseudogenes. A
second group contained functional genes with high homology to each other and a
third group contained genes and pseudgenes that were more divergent and have
low homology to all other MUP genes. These groups were localised within the MUP
locus to two areas, referred to as central and peripheral genes by Mudge et al
(2008). The central region is flanked at either end by the peripheral region (Figure
13
The central genes are extremely homologous and are most likely the result of a
number of gene duplications and divergence from one of the older peripheral
genes. The timing of the oldest divergence event for the functional central MUP
genes is approximately 1.2-2.4 Mya (Mudge et al., 2008). The peripheral genes share less sequence homology and include 6 intact functional genes and 5
pseudogenes (Mudge et al., 2008; Logan et al., 2008). The timing for the oldest divergence for the functional MUP loci in the peripheral region is estimated to be
11.2-22.4 Mya (Mudge et al., 2008).
MUP expression
MUPs are primarily synthesised in the liver and escape glomerular filtration leading
to excretion in urine. MUPs account for approximately 99% of protein found in
mouse urine. They are synthesised with a 19 amino acid signalling peptide that is
cleaved off before entering the bloodstream (Finlayson et al., 1965). Several hormones – testosterone, growth hormones, thyroxine, insulin and glucocorticoids
are all thought to contribute to the control of MUP synthesis (Ruemke and Thung,
1964; Knopf et al., 1983; Spiegelberg and Bishop,1988; Johnson et al., 1995).
Male laboratory mice typically excrete 10-20 mg/ml of protein per day with
females excreting much less – approximately 2-10 mg/ml per day (Cheetham et al.,
2009). Although highly homologous, major MUP isoforms can be separated using
mass spectrometry and isoelectric focussing (Robertson et al., 1996, 1997; Beynon
et al.,2002; Cheetham et al., 2009; Mudge et al., 2008). For laboratory strains of mice who often belong to one of only two phenotypes, these isoform profiles are
virtually identical between individuals of the same sex in the same species. Wild
mice profiles are more complex and unique. Both sexes of wild mice excrete up to
three times more protein than laboratory strains (Beynon and Hurst, 2004).
Substantial variation between unrelated individuals has been observed (Robertson
et al., 1997; Beynon et al., 2002). Offspring inherit different MUP haplotypes from their parents leading to large variability. Wild mice will use these variations in MUP
profiles rather than MHC peptides (see section 1.4.2) to avoid in-breeding
15
MUP and lipocalin expression in non-rodents
MUPS have been studied extensively in mice who use MUPS as their primary source
of communication. Phylogenetic analysis by Logan et al., (2008) found the last common ancestor of rat and mouse had either a single or small number of MUPs
which enabled them to determine the extent of MUP gene expansions across
non-rodent lineages. Of the sequenced genomes available, they were able to identify
genes in different species that evolved from a common ancestral gene by speciation
(orthologues) and contiguous genomic sequence spanning the interval between the
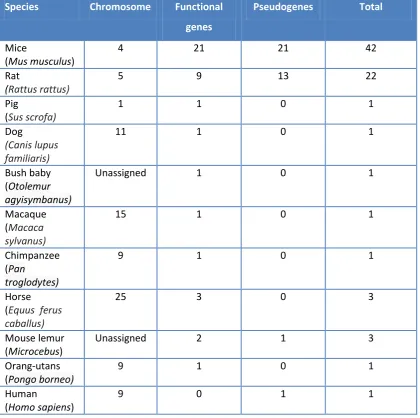
genes in nine additional placental mammals. Pigs, dogs, bush babies, macaques,
chimpanzees and orang-utans all have one functional MUP gene. Humans have a
single MUP pseudogene containing a mutation that causes mis-splicing, rendering it
dysfunctional (Table 1.2, Figure 1.4).
Interestingly, two of the nine genomes did reveal further examples of lineage specific expansions (Figure 1.3). Three MUP paralogues were identified in the horse with the product of one of these previously isolated from dander and sublingual salivary glands (Gregoire et al., 1996). Identified as a major horse allergen, this protein has been used to identify further expression in the submaxillary glands and
liver. The gray mouse lemur was also found to have at least two MUP gene
paralogues and one possible pseudogene.
Protein expression arising from these MUP genes has also been observed in the pig.
Expression of a salivary lipocalin that binds sex pheromones in the submaxillary
gland of male pigs has been observed (Marchese et al., 1998; Loebel et al., 2000). Dogs also express two lipocalins in their tongue epithelial tissue and paratoid gland
that are also potent allergens to humans (Konieczny et al., 1997; Saarelainen et al.,
2004). Cats express a number of allergen proteins one of which FEL D 4 is a lipocalin
secreted from the submandibular salivary gland (Smith et al., 2004). Interestingly, this lipocalin is detected through the vomeronasal organ (VNO) of mice and caused
defensive behaviours. Also native odour stimuli from other species that did not
Chapter 1: Introduction
[image:31.595.114.535.99.517.2]16
Table 1.2 A list of functional and pseudo MUP genes in 11 different species. Table was
adapted from Logan et al., 2008
Species Chromosome Functional
genes
Pseudogenes Total
Mice
(Mus musculus)
4 21 21 42
Rat
(Rattus rattus)
5 9 13 22
Pig
(Sus scrofa)
1 1 0 1
Dog
(Canis lupus familiaris)
11 1 0 1
Bush baby
(Otolemur
agyisymbanus)
Unassigned 1 0 1
Macaque (Macaca sylvanus)
15 1 0 1
Chimpanzee (Pan
troglodytes)
9 1 0 1
Horse (Equus ferus caballus)
25 3 0 3
Mouse lemur
(Microcebus)
Unassigned 2 1 3
Orang-utans
(Pongo borneo)
9 1 0 1
Human
(Homo sapiens)
17
Figure 1.4 Phylogeny of MUP coding sequences in mammals
Chapter 1: Introduction
18
1.4.2 MHC peptides
The major histocompatability complex is a large multigene area containing a
number of closely linked highly polymorphic genes that play a crucial role in
immunological self and non-self recognition (Klein and Figueroa 1986; Janeway,
1993). The main function of MHC proteins is to transport peptides from within a
cell to the cell surface where they are presented to T-cells, which will ignore healthy
cells and destroy cells containing foreign protein. Each protein binds to a specific
peptide producing a set of uniquely bound peptide-MHC complexes for each
individual. These complexes are then discarded from the cell during cell turnover
and released into bodily fluids such as blood, saliva and urine (Singh et al., 1997).
In addition to their role in immunity, the MHC is thought to participate in mate
selection for many mammals through olfactory cues. Females are thought to
choose a mate with a dissimilar MHC type to their own to avoid inbreeding and to
improve resistance to infection (Penn and Potts, 1998; Jordan and Bruford, 1998).
However, there is limited research into this heterozygote advantage of disease
resistance with one study suggesting no immunological advantages (Ilmonen et al.,
2007).
MHC-dependant mate choice has been observed in primates such as humans and
mouse lemurs. Women were exposed to odours from dissimilar and
MHC-similar males and mostly preferred odours from MHC-disMHC-similar males. Also the
MHC-dissimilar odours often reminded woman of previous partners (Gosling et al.,
2008). In a study with gray mouse lemurs, post-copulatory mate-choice has been
observed with fathers being more MHC-dissimilar to mothers (Schwensow et al.,
2008). MHC-dependant mate choice has also been observed in non-mammals such
as fish and birds (Von Schantz et al., 1996; Von Schantz et al., 1997; Olsen et al.,
1998; Freeman-Gallant et al., 2003).
In mice, there are reservations over the role of MHC peptides as a signal of
individuality as native MHC peptides have never been observed in urine. Mice have
receptors for MHC peptides in their VNO and MOE. Synthetic peptides have been
19
2007) and conflicting data surrounding response of VNO sensory neurons to MHC
peptides has been published (Chamero et al., 2007; He et al., 2008; Nodari et al.,
2008).
1.4.3 Exocrine-gland secreting peptides (ESPs)
More recently ESPS have been observed in rodents such as mice and rats. These
peptides are not secreted in urine but are found in extraorbital lachrymal gland,
Harderian gland and/or submaxillary gland of with responses to these peptides
observed in the vomeronasal organ but not the main olfactory epithelium (Kimoto
et al., 2007). They are encoded by a multigene family on chromosome 17 of the mouse and chromosome 9 of the rat and encode proteins of various lengths ranging
from 5-15 kDa (Kimoto et al., 2007).
There are 24 functional ESP genes in mice with expression of the various individual
ESPs varying between strains. Expression also varies between sexes, a male-specific
ESP has been identified in the lachrymal glands of a number of strains. When
females make close nasal contact with the facial area or bedding of adult males,
stimulation of vomeronasal sensory organs is observed (Kimoto et al., 2005).
1.5 Pheromone detection
In most mammals, pheromones are detected using a dual olfactory system (Figure
1.5). This olfactory system consists of the main olfactory system (MOS) and the
accessory olfactory system (AOS). Mammals use either one or both of these system
to detect chemosensory clues present in scent marks. The main olfactory
epithelium (MOE) is responsible for the conscious perception of odours while the
accessory olfactory system is responsible for the detection of pheromones that
elicit various behavioural and physiological responses between conspecifics.
1.5.1 Main olfactory system
The MOE is located at the posterior end of the nasal cavity and is mostly made up of
olfactory sensory neurons (OSNs). These OSNs send their axons into the main
Chapter 1: Introduction
20
before proceeding to higher sensory centres. The OSN contain olfactory receptors
which are heptahelical G-protein-coupled receptors (GPCR) that share a significant
homology in vertebrates (Rouquier and Giorgi, 2007). The amount of receptors
varies between mammals depending on how much olfactory system is required for
survival. For instance, humans contain less functional olfactory receptor genes than
most other mammals. A rise in pseudogenes from old world monkeys to new world
monkeys suggests primates may have lost part of their olfactory ability over time
(Rouquier et al., 2000). In contrast to this mice and rats have over 1300 olfactory receptors that bind a broad range of odorants with different affinities (Zhang and
Firestein, 2002).
The MOS is not normally associated with pheromone detection; it is usually
responsible for detection and differentiation of complex chemical signals that are
present in both the physical and social surroundings of individuals. However the
individual sensory roles for the two olfactory systems are still unclear. Pheromone
detection by the MOS has been reported in female boars. Male boars secrete a
volatile steroid androstenone in their saliva that induces lordosis in females (Dorries
et al., 1995; Dorries et al., 1997). If the female AOS is blocked off the pheromone continues its effect inducing the female mating stance, suggesting this volatile is
detected in the MOS (Dorries et al., 1995; Dorries et al., 1997). Also preovulatory LH surge and ovulation in ewes after exposure to ram odours is thought to involve
the MOS. The ewes still experience a surge in LH in response to the rams after
blocking off the AOS (Cohen-Tannoudji et al., 1989; Delgadillo et al., 2009). (methylthio) methanethiol (MTMT) in male mouse urine is also detected by the
MOS (Lin et al., 2005). The rabbit mammary pheromone 2-methylbut-2-enal present in the milk of the mother encourages nipple-searching behaviour in pups.
Removal of the AOS has no affect on the pups’ nipple-searching efforts but removal
21 Main olfactory epithelium
(MOE)
Gruenberg ganglion (GG)
Vomeronasal organ (VNO)
Septal organ of Masera (SO)
Accessory olfactory bulb (AOB)
[image:36.595.118.519.75.325.2]Main olfactory bulb (MOB)
Figure 1.5 Anatomical representation of the mammalian olfactory system.
Chapter 1: Introduction
22
1.5.2 Accessory olfactory system
The AOS is responsible for the detection of the majority of pheromones. A
vomeronasal organ (VNO) is based in the vomer between the nose and the mouth
and is responsible for detecting stimuli. Like the MOE, the VNO contains sensory
receptors whose axons project into the accessory olfactory bulb (AOB). The axons
that leave the AOB project into parts of the brain that stimulate aggression and
mating behaviour.
The VNO contains two types of sensory receptor – VR1 and VR2 receptors. VR1
receptors detect small volatile molecules and VR2 receptors perceive involatile
pheromones such as peptides and proteins (Dulac and Axel, 1995; Matsunami and
Buck, 1997). Both receptors belong to two distinct super families of seven trans
membrane G-protein coupled receptors. They have different molecular structures
and are expressed in different locations in the VNO. VR1 receptors are linked to the
G protein Gαi2 and are located in the apical region of the VNO. VR2 receptors are
liked to a G protein Gαo and are based in the basal compartment of the VNO (Dulac
and Torello, 2003; Mombaerts, 2004). They have a longer N terminal which is
thought to be involved in pheromone binding. The V1R receptors transmit
projections into the rostral part and the V2Rs into the caudal part of the AOB (Zufall
and Leinders-Zufall, 2007).
Identification of VR1 genes has been made easier because of their relatively simple
gene structure. At present a complete VR1 gene repertoire has been identified in
human, chimpanzee, mouse, rat, dog, cow and opossum with the number of intact
genes varying between species (Rodriguez and Mombaerts, 2002; Rodriguez et al.,
2002; Grus and Zhang, 2004; Zhang et al., 2004; Young et al., 2005; Grus et al.,
2005). However little is known about VR2 receptors and until recently these
receptors had only been described in rodents and marsupials. The first functional
VR2 receptor genes in a primate, the gray mouse lemur, were observed in a study