CORRELATION BETWEEN MITRAL ANNULAR
SYSTOLIC VELOCITY AND LEFT
FUNCTION IN MITRAL STENOSIS
THE TAMIL NADU DR. M.G.R. MEDICAL UNIVERSITY
In partial fulfillment of the requirements for the award of the degree of
THE TAMIL NADU DR. M.G.R. MEDICAL UNIVERSITY
CORRELATION BETWEEN MITRAL ANNULAR
SYSTOLIC VELOCITY AND LEFT ATRIAL APPENDAGE
FUNCTION IN MITRAL STENOSIS
Dissertation submitted toTHE TAMIL NADU DR. M.G.R. MEDICAL UNIVERSITY
In partial fulfillment of the requirements for the award of the degree of
D.M. CARDIOLOGY BRANCH II – CARDIOLOGY
THE TAMIL NADU DR. M.G.R. MEDICAL UNIVERSITY CHENNAI, INDIA
AUGUST 2014
CORRELATION BETWEEN MITRAL ANNULAR
APPENDAGE
THE TAMIL NADU DR. M.G.R. MEDICAL UNIVERSITY
In partial fulfillment of the requirements for the award of the degree of
CERTIFICATE
This is to certify that the dissertation titled “CORRELATION
BETWEEN MITRAL ANNULAR SYSTOLIC VELOCITY AND LEFT ATRIAL APPENDAGE FUNCTION IN MITRAL STENOSIS” is the bonafide original
work of Dr. M. S. SELVAKUMARAN, in partial fulfillment of the
requirements for D.M. Branch-II (CARDIOLOGY) examination of THE
TAMILNADU DR.M.G.R. MEDICAL UNIVERSITY to be held in August
2014.The period of post-graduate study and training was from August 2011
to July 2014.
Prof. R. Vimala M.D
Dean,
Rajiv Gandhi Government General Hospital & Madras Medical College Chennai – 600 003.
Prof. M. S. Ravi, M.D, D.M
Professor and Head of Department Department of Cardiology
DECLARATION
I, Dr. M. S. SELVAKUMARAN, solemnly declare that this
dissertation entitled, “CORRELATION BETWEEN MITRAL ANNULAR
SYSTOLIC VELOCITY AND LEFT ATRIAL APPENDAGE FUNCTION IN MITRAL STENOSIS” is a bonafide work done by me at the department of
Cardiology, Madras Medical College and Government General Hospital
during the period 2011 – 2014 under the guidance and supervision of the
Professor and Head of the department of Cardiology of Madras Medical
College and Government General Hospital, Professor M. S. Ravi M.D.D.M.
This dissertation is submitted to The Tamil Nadu Dr. M.G.R Medical
University, towards partial fulfillment of requirement for the award of D.M.
Degree (Branch-II) in Cardiology.
Place: SIGNATURE OF THE CANDIDATE
ACKNOWLEDGEMENT
A great many people made this work possible. I thank Prof. R.
Vimala, M.D., Dean, Rajiv Gandhi Government General Hospital & Madras
Medical College for allowing me to conduct this study.
My warmest respects and sincere gratitude to our beloved Prof M. S.
Ravi M. D., D.M., Professor and Head of the Department of Cardiology,
Government General Hospital, Chennai who was the driving force behind
this study. But for his constant guidance this study would not have been
possible.
I am indebted to Prof K. Meenakshi, Prof. D. Muthukumar, Prof.
N.Swaminathan, Prof. G. Ravishankar and Prof. G. Justin Paul without
whom, much of this work would not have been possible.
I acknowledge Dr. S. Venkatesan for the many useful comments he
made during this project.
In addition, I am grateful to Dr. G. Manohar, Dr. S. Murugan, Dr. C.
Moorthy,Dr C.Elangovan, Dr. G. Prathap kumar, Dr. Ilamaran, Dr.
Rajasekar Ramesh, Dr. Arumugam, Dr. Balaji Pandian and Dr. S. Saravana
Babu, for tracing all those waveforms and guidance.
I also thank all my patients for their kind cooperation.
Lastly, I thank all my professional colleagues for their support and
CONTENTS
TITLE PAGE NO
1. INTRODUCTION 6
2. AIMS AND OBJECTIVES 10
3. REVIEW OF LITERATURE 11
4. MATERIALS AND METHODS 33
5. RESULTS 36
6. DISCUSSION 55
7. CONCLUSION 58
8. LIMITATION OF STUDY 59
9. APPENDIX 60
a. Bibliography
b. Acronyms
c. Proforma
d. Master chart
e. Ethical committee approval order
INTRODUCTION
The appendage of the left atrium is bulbar structure which is long with
a narrow junction at its meeting point with left atrium. In many diseases the
left atrial appendage is clinically important because of the propensity for the
development of thrombus. Being a dynamic structure, the stasis of blood is
prevented, but when its function is impaired, stasis will increase. This may
lead to the development of spontaneous echo contrast and thrombus
formation. Moreover an inactive left atrial appendage is an independent
predictor of thrombo embolism. Hence the decision for anticoagulant
therapy can be made on the basis of the presence of inactive left atrial
appendage.
In patients with rheumatic mitral stenosis, left atrial appendage
velocities are reduced. Also in mitral stenosis, the annular velocities
calculated by Doppler tissue imaging are reduced. The lateral mitral annulus
and the left atrial appendage has a close functional and anatomic relation and
hence the velocities obtained from the annulus by Doppler tissue imaging
The prevalence of rheumatic heart disease is high in South Asian
countries, particularly in India. Isolated mitral stenosis occurs in 25% of all
rheumatic heart disease cases. Mitral stenosis and mitral regurgitation occur
in 40% of the cases. Almost two thirds of patients with mitral stenosis are
females. The thrombi originating from the left atrial appendage are believed
to be the source of embolism in patients with rheumatic mitral stenosis,
especially when mitral stenosis is associated with atrial fibrillation.
Echocardiography is used to detect thrombi in the left atrium and its
appendage. Transthoracic echocardiography is 50% sensitive in detecting
left atrial and left atrial appendage thrombi. Transesophageal
echocardiography (TOE) is superior to transthoracic echocardiography and
has high sensitivity and specificity for the detection of left atrial and left
atrial appendage thrombi. The individual valve lesion severity can be
assessed by echocardiography in patients with rheumatic heart disease and
can be matched with left atrial dimensions and hence used for risk
stratification from thromboembolism.
formation, but disease states like atrial fibrillation and rheumatic heart
disease cause left atrial appendage dysfunction and becomes a risk factor for
thrombus formation. Recent attention has been focused on left atrial
appendage function by transesophageal echocardiography to assess the risk
of thrombus formation.
Spontaneous echo contrast in left atrium is a common finding in
patients with rheumatic mitral valve disease. Left atrial spontaneous echo
contrast is an independent predictor for systemic embolization and is
documented better by transesophageal echocardiography. In this scenario it
is prudent to investigate whether there is a relation between mitral annular
velocities obtained by Doppler tissue imaging and left atrial appendage
function and to find out if the velocities obtained from the annulus can
indicate the presence of inactive left atrial appendage in patients with mitral
AIMS AND OBJECTIVES
1. To determine the relation between systolic mitral annular velocity and
left atrial appendage function by Doppler tissue imaging.
2. To investigate if the systolic mitral annular velocity can indicate the
presence of inactive left atrial appendage in mitral stenosis.
3. To assess echocardiographic parameters particularly left atrial
dimensions, mitral valve area, presence of left atrial thrombus and
spontaneous echo contrast by trans-thoracic echocardiogram.
4. Trans-esophageal echocardiographic assessment of thrombus,
spontaneous echo contrast and emptying velocity of appendage of left
atrium.
5. To determine if there is any correlation between E wave or A wave
velocities and left atrial appendage emptying velocity.
6. To risk stratify thromboembolism in those patients based on Doppler
echocardiographic parameters.
7. The ultimate aim of the study is to prevent thromboembolism in all
REVIEW OF LITERATURE
Valvular heart disease remains a major burden in India. Due to lack of
diagnostic facilities in many areas especially in rural areas, it is mandatory to
be familiar with assessment of valvular heart disease at the bedside by
physical examination. With escalating health care costs, cost effectiveness of
care (diagnostic and therapeutic) is important. The attending physician has
the responsibility of using limited economic resources of the patient in an
appropriate way.
In India rheumatic heart disease remains the commonest cause of
valvular heart disease. Less common causes are Degenerative, Congenital
and Infective Endocarditis. Rare causes include drug induced, trauma,
carcinoid syndrome, connective tissue disorders, iatrogenic etc. Previously
considered as an insignificant structure in cardiac anatomy, the appendage of
left atrium is now considered a structure with important pathological
associations.(1)
five fold in non-rheumatic atrial fibrillation and fifteen fold in patients with
rheumatic mitral stenosis and atrial fibrillation. In rheumatic mitral valve
disease there is a predilection for thrombus formation in left atrial
appendage, especially in atrial fibrillation and it is also is present in sinus
rhythm. In non-valvular atrial fibrillation also clot formation occurs in left
atrial appendage. With the advent of transesophageal echocardiography now
it is possible to assess in health and disease, the shape, flow patterns, size
and content of left atrial appendage.
Atrial fibrillation is the causative factor for about 15% of
cardio-embolic ischemic cerebro vascular accidents.(2) As a whole 90% of thrombus
originates in the left atrial appendage in non-valvular atrial fibrillation.
Around 60% of thrombus were seen in appendage of left atrium in rheumatic
mitral valve disease. The thromboembolic phenomenon can be reduced with
the use of anti-coagulants and some patients have contraindications for the
initiation of such treatment. In those patients who have contraindications for
OAC (Oral Anti-Coagulants) an alternative form of thromboembolism
ANATOMY OF THE LEFT ATRIAL APPENDAGE
The left atrium develops in 3rd week of gestation.(3) The appendage of
the left atrium is a remnant of embryonic left atrium. The main left atrium
develops from the outgrowth of pulmonary veins. The left atrial appendage
is much longer than its counterpart on the right side and has a much
narrower connection with the atrium. The shape of the left atrial appendage
resembles a finger or the wing of a bird. The left atrial appendage is a
tubular and hooked structure. In contrast the right atrial appendage has a
broad base and a triangular contour and resembles the ear of a dog. Both
appendages have trabeculation and both appendages have pectinate muscles,
which are nothing but muscles running parallel to each other, resembling a
comb.
The right atrial appendage has prominent pectinate muscles whereas it
is less prominent in the left atrial appendage. In some congenital heart
diseases the pectinate muscles in appendages were used to identify the
morphological left and right atrium. In autopsy studies, in patients with atrial
fibrillation the atrial appendages were voluminous and broader when
compared to patients in sinus rhythm. These findings correlate with
These findings may be due to hemodynamics of atrial fibrillation or
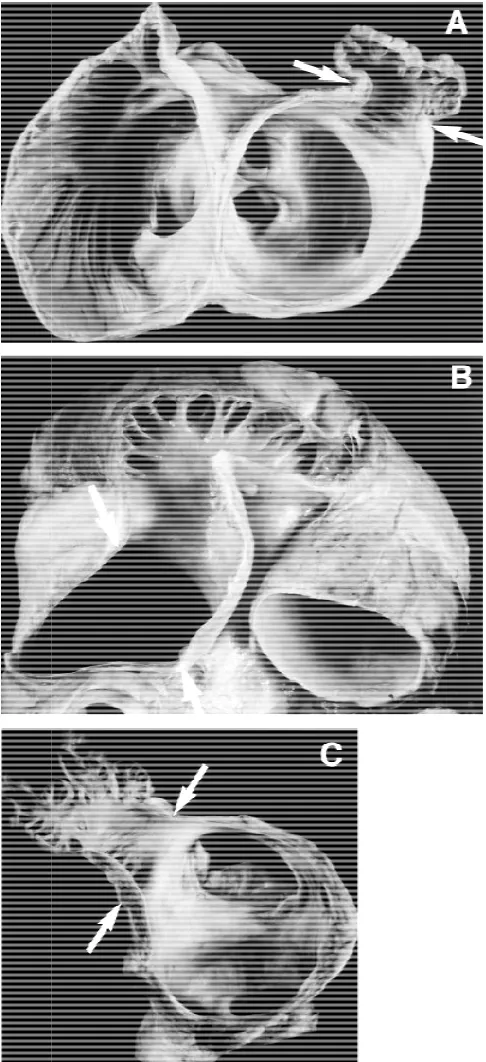
[image:13.612.203.446.207.738.2]fibrillation per se.
Figure showing v
A) Single lobed B) Bilobed C) Multilobed
ay be due to hemodynamics of atrial fibrillation or
Figure showing various types of LAA
A) Single lobed B) Bilobed C) Multilobed
The myocytes in appendage of left atrium is similar to the myocyte of
myocardium present in other sites. The left atrial appendage has a thicker
epicardium when compared with the thickness over the ventricles. The left
atrial appendage is an intra-pericardial structure. It is related superiorly to
the pulmonary artery and to the free wall of the left ventricle inferiorly. The
blood supply to the left atrium comes from the left atrial branch of left
circumflex artery and from the right coronary arteries. They are innervated
by both sympathetic and parasympathetic system.
PHYSIOLOGY
The contraction pattern of left atrial appendage is distinct. When
compared to left atrium it shortens to a greater extent. Transesophageal
echocardiography has been used for studying the blood flow within the left
atrial appendage. It gives optimal views of appendage and its orifice.
The left atrial appendage flow patterns in those patients who are in
sinus rhythm which was measured by Doppler imaging techniques were
described as biphasic.(5) In addition to the biphasic flow pattern there were
emptying and filling waves. This is called quadriphasic flow pattern. (6) This
flow pattern was described in 50-70% of patients. This quadriphasic flow
pattern may not be seen in patients undergoing transesophageal
echocardiography for clinical indications.
There are 2 phases in the left atrial appendage flow, a forward flow
phase and a backward flow phase. In the forward flow phase the blood
moves out of the appendages. This phase occurs early in the diastole, after
the start of the trans-atrial flow this is followed by a short phase of backward
flow, in which blood moves into the appendage.
The causal relationship between early left atrial appendage emptying
and the left ventricular relaxation is suggested by the first forward flow
phase. This first forward flow phase is fixed to the beginning of early
diastole. A further phase of forward flow is noted due to the contraction of
the left atrial appendage coincides with atrial systole. This is followed by
backward flow phase. This backward flow phase is presumably caused by
the elasticity of the left atrial appendage. This cyclic forward flow and
backward flow phase is constant and independent of heart rate.
The left atrial appendage being intrapericardial is relatively fixed and
to the free wall of left ventricle inferiorly and medically. The intrapericardial
space is being filled up during disease as the left ventricle dilates. This
dilation of left ventricle during diastole compresses the inferomedial wall of
left atrial appendage between the fixed pericardium and its free wall. This
has been suggested to contribute to the emptying of the left atrial appendage.
During early diastole and intracavitary suction effect is created by
ventricular filling. This intracavitary suction effect will have an influence on
the filling and emptying of left atrium as well as the left atrial appendage.
Hence the filling and emptying of left atrial appendage is influenced by
changes in left ventricular function rather than appendage function. This
finding will explain the atrial fibrillation related cerebrovascular accidents in
patients with left ventricular dysfunction. (7) There was an inverse
relationship between the filling and emptying of left atrial appendage and
ventricular rate. These findings can be extrapolated for and optimal rate
control in the prevention of thromboembolism in atrial fibrillation. (8)
There are theories regarding whether the left atrial appendage
contracts actively or it functions passively. This is due to the relation of the
compressed by left ventricle during ventricular diastole and also the negative
pressure created by ventricular filling empties the appendage.
The left atrial appendage has prominent muscle ridges. If these
pectinate muscle ridges won’t contract, they will go for atrophy. Hence the
evidence favours active contraction of left atrial appendage. If the filling and
emptying in the appendage is passive, this will not explain the quadriphasic
flow pattern which was seen at low heart rates. Cardiac surgeons have also
observed active contraction of left atrial appendage intraoperatively.
The distensibility of the left atrial appendage is much more that the
proper left atrium. There will be an increase in dimensions as well as left
atrial pressure when appendage is clamped during cardiac surgery. There is
also an increase in pulmonary and trans-mitral diastolic flow velocities
during clamping of the appendage.(9) By way of modulating left atrial
pressure volume relations the left atrial appendage will increase
hemodynamic function in states of pressure and volume overloaded left
atrium, this is due to the increased distensibility of the left atrial appendage.
appendages. The density of atrial natriuretic factor granules was high in the
left atrial appendage. Amyloidosis has predilection for left atrial appendage.
The major protein in atrial amyloidosis is atrial natriuretic factor.
The neural supply to atrial appendages is diverse. There will be an
increase in urine flow and sodium excretion, when the atrial appendage is
distended experimentally without increasing the pressures in the right or left
atrium or aorta. This is due to the stretch sensitive receptors in the atrial
appendage. When bases of both appendages were crushed this effect is lost.
The stretch receptors also cause an increase in the heart rate mediated
by the sympathetic efferent pathway. Hence left atrial pressure is maintained
by left atrial appendage via stretch sensitive receptors which when activated
increase natriuresis, heart rate and diuresis. Also the distensibility of left
atrial appendage and through atrial natriuretic factor secretion helps maintain
the left atrial pressure. (10)
IMAGING OF THROMBUS IN LEFT ATRIAL APPENDAGE
Left atrial appendage lies between the left ventricle and pulmonary
outlet region in a normal cardiac skiagram. Previously angiography has been
Being an invasive procedure it is not done nowadays. Transthoracic
echocardiography has limited diagnostic utility in the imaging of thrombus
in left atrial appendage.
A highly accurate imaging was done through transesophageal
echocardiography. This semi-invasive imaging technique is a valuable tool
for diagnosing thrombus in the left atrial appendage. For diagnosing thrombi
in left atrial appendage transesophageal echocardiography has 100%
sensitivity and 99% specificity. The positive predictive value of
transesophageal echocardiography for diagnosing left atrial appendage
thrombus is 86% and a negative predictive value is 100 %.( 12)
If the length of the time in atrial fibrillation is more than 48 hours,
current guidelines recommend oral anticoagulation at least 3 weeks prior to
and 4 weeks following direct current cardioversion.(13) A transesophageal
echocardiogram can be performed while the patient is on intravenous
heparin with a goal aPTT of 1.5 to 2.0 and if no identifiable thrombus is
found, direct current cardioversion can safely be performed, followed by
oral anti-coagulants with a goal INR of 2.0-3.0.(14)
In the assessment of cardioversion using transesophageal
echocardiogram (ACUTE) study, transesophageal echocardiography
compared to conventional approach based on 3 weeks of anti-coagulant
therapy. Both groups were continued on warfarin for 4 weeks after the
cardioversion. There was no difference noted in the embolic event rate or
maintenance of sinus rhythm, TEE cardioversion minimized the duration of
atrial fibrillation and increases the likelihood of success. (15)
The size, flow velocity and flow patterns of left atrial appendage are
related to thrombus formation. An enlarged left atrial appendage is
associated with thrombus formation and subsequent embolisation as
evidenced by studies with transesophageal echocardiography. Around 60%
of patients with enlarged left atrium on transesophageal echocardiography
have and enlarged left atrial appendage. About 15% of the patients with a
normal left atrium have an enlarged left atrial appendage.
A light grey haze which was swirling inside the great vessels and
veins had cardiac chambers called spontaneous echo contrast (SEC) first
described by Feigenbaum in 1975 is observed in conditions of low blood
flow velocity such as rheumatic mitral stenosis, dilated left atrium,
dyskinetic segments of left ventricle and mitral valve prosthesis. SEC
represents intracardiac erythrocyte or platelet microaggregates. It may be a
In patients with left atrial appendage thrombus, left atrial appendage
size is larger both in patients with sinus rhythm and atrial fibrillation. In
patients with chronic atrial fibrillation the appendage area is significantly
larger in patients with thrombus when compared with patients who do not
have thrombus. (16)
Velocity and Pattern of Flow in Left Atrial Appendage
The velocity of flow at the orifice of the appendage is determined by
Doppler TOE. In patients in sinus rhythm and atrial fibrillation and absent or
reduced left atrial appendage inflow and outflow velocities were associated
with spontaneous echo contrast and formation of thrombus.
In patients with history of systemic embolization the left atrial
appendage filling and emptying velocities are reduced. (17) Based on Doppler
transesophageal echocardiography the pattern of flow in left atrial
appendage is classified into three types :( 5)
Type 1 – Sinus rhythm patients with regular pattern of filling and
emptying.
Type 2 – Atrial Fibrillation patients with saw tooth pattern
The incidence of thrombus formation and spontaneous echo contrast is
high in patients with type 3 flow pattern, when compared with type 1 and
type 2. The flow patterns were related to the appearance of fibrillatory waves
on the electrocardiogram. In coarse atrial fibrillation the left atrial appendage
ejection fraction and emptying velocity were reduced and this was
associated with a high incidence of thrombus and spontaneous echo contrast.
Patients with fine atrial fibrillation have lesser incidence of thrombus and
SEC.
There are two proposed causes for left atrial appendage dysfunction in
patients with atrial fibrillation:
1. Myopathic process resulting in atrial Fibrillation
2. Atrial fibrillation resulting in myopathic process
In patient with atrial flutter, left atrial appendage flow pattern shows a
regular pattern and high emptying velocities when compared to patients in
atrial fibrillation. Hence atrial flutter will have low incidence of
thromboembolism. (18)
The thromboembolic risk is determined by the size as well as the
mobility of the thrombus. A thrombus that are pedunculated, mobile and
more than 15 cm are at high risk for thromboembolism. Post cardioversion
have decreased mechanical function of left atrium for a variable period,
following reverting to sinus rhythm. Studies on left atrial appendage
function also show depressed mechanical function following cardioversion.
(19)
The inflow and outflow velocities of the left atrial appendage are
decreased following successful cardioversion of atrial fibrillation.
Spontaneous echo contrast also develops after successful cardioversion. The
depressed atrial function results in thrombus formation. The term stunning is
used to denote depressed atrial mechanical function after cardioversion.
DC cardioversion per-se causes damage to the atrium and appendage
with the resulting depressed function and stasis. This was challenged by the
subsequent studies on patients, which showed that stunning also occur in
pharmacological as well as spontaneous cardioversion.
Atrial mechanical dysfunction is not seen in patients who receive
shock for ventricular tachycardia. The depressed atrial mechanical function
following cardioversion is due to atrial and left atrial appendage myopathy
caused by atrial fibrillation. The depression of function is also related to the
chronicity of atrial fibrillation.
Patients in sinus rhythm, with underlying left ventricular dysfunction
patients with dilated cardiomyopathy, in sinus rhythm have thrombi in the
left atrial appendage. A small proportion of patients with history of TIA,
stroke, systemic embolism without significant carotid stenosis do have
thrombi in left atrial appendage.
The continuous formation and dissolution of thrombi in left atrial
appendage makes it a dynamic process. This has been correlated to raised
serum concentrations of Fibrinopeptide A, that reflects thrombin mediated
fibrin formation and D- dimer which is a fibrinogen degradation product. (21)
Patients who were treated with warfarin for 4 weeks, showed clot
dissolution which was confirmed by transesophageal echocardiography. The
disappearance of thrombi suggests that the clot formation and lysis is a
dynamic process. The role of endothelium and platelets in left atrial
appendage clot formation is not known.
Warfarin is used in the prophylaxis of stroke in atrial fibrillation.
Because of its narrow therapeutic index and bleeding complications
alternative treatment such as obliteration of left atrial appendage can be
tried. The procedure is technically challenging and may result in unfavorable
hemodynamic and hormonal effects which could have an impact on patients
with left ventricular dysfunction and valvular heart disease. Left atrial
mitral valvular disease. Hence left atrial appendage obliteration will not
prevent all episodes of thromboembolism.
Echocardiographic Assessment of Left Atrial Appendage
The assessment of appendage function was described initially by
Suetsugu et al and by Pollick and Taylor and has now become incorporated
into the routine transesophageal examination.(23,24) The imaging of left atrial
appendage has been done primarily in 2 basic biplane tranesophageal views,
the horizontal and longitudinal views.(22)
1. The horizontal view is a short axis view at the base of the heart
2. The longitudinal view is a two chamber view of the left ventricle
and atrium.
The appendage can be visualized in a continuum of intermediate
planes by multi-plane Transesophageal echocardiography. Transpulmonary
injection of contrast agents have been used to improve the Doppler
recordings and echocardiographic images to visualize the appendage. Left
atrial appendage is a posterior cardiac structure.
Transesophageal imaging can easily visualize left atrial appendage.
By transthoracic echocardiography, left atrial appendage can be imaged by
two chamber view. However transesophageal approach is necessary for
adequate visualization of left atrial appendage especially in elderly
population. Recently it has been suggested that Doppler imaging of
appendage can be done through transthoracic approach.
A complete assessment of left atrial appendage includes 2D imaging
of its size, morphology and contraction. A quantitative assessment of left
atrial appendage function is done through pulse-Doppler imaging of left
atrial appendage flow.(25) In addition the left atrial size, left ventricular
systolic and diastolic function and the associated mitral valve disease should
be assessed and correlated with the left atrial appendage function,
2D Evaluation of Left Atrial Appendage
Previously the appendage area and ejection fraction has been
calculated. This is not relevant clinically because the appendage cross
sectional area is inclined to have considerable inter-observer variability. This
is due to the fact that appendage is a complex structure and hence the
standard imaging is limited.
The assessment of left atrial appendage function by planimetry
method is time consuming and it doesn’t offer any advantage over gross
imaging of left atrial appendage function can be performed easily. It is also
reproducible and relevant clinically.
In an autopsy study about 80% of atrial appendage was multi lobed
and 59% was bilobed. The appendage should be imaged precisely be a multi
plane trans-esophageal echocardiogram.
The presence of spontaneous echocardiographic contrast and its semi
quantitative grading and also the presence of complex structure of left atrial
appendage, trans-esophageal echocardiography will both over diagnose and
under-diagnose the lesions.(26) There may be false interpretation of
prominent pectinate muscles as thrombus and the presence of occult thrombi
in multi-lobed appendages is missed.
Doppler Evaluation of Left Atrial Appendage Function
Colour flow imaging guided, Doppler interrogation of left atrial
appendage flow should be selected. The sample volume location size is not
standardized whether to keep the sample volume at appendage – left atrial
junction or at varied sites within the left atrial appendage cavity. The varied
location of sample volumes within the appendages will produce significant
changes in measured velocities, is also not known. The velocities obtained at
velocities obtained at the wider orifice of
Figure showing Doppler evaluation of LAA by TEE
As a routine colour flow imaging guided, sample volume placement at
the site of maximum flow velocities should be employed for
appendage flow. The sample volume placement in the more distal portion of
the appendage should be avoided because of
wall motion. In practice maximal left
velocities obtained at the wider orifice of left atrial appendage.
Figure showing Doppler evaluation of LAA by TEE
As a routine colour flow imaging guided, sample volume placement at
the site of maximum flow velocities should be employed for
flow. The sample volume placement in the more distal portion of
the appendage should be avoided because of Doppler artifacts caused by
wall motion. In practice maximal left atrial appendage flow velocities can be As a routine colour flow imaging guided, sample volume placement at
the site of maximum flow velocities should be employed for left atrial
flow. The sample volume placement in the more distal portion of
artifacts caused by
obtained within the proximal third of the appendage.
Doppler Flow Patterns of Appendage in Sinus Rhythm
1) LAA contraction – Positive wave toward the transesophageal
transducer. Related to mitral flow in late diastole.(27)
2) LAA filling – Negative wave away from the transducer.
3) Reflection waves during systole – these are passive waves both
outward and inward waves that follows contraction and filling
waves.
4) Early diastole wave – early emptying wave that correlates with
rapid early diastolic inflow into the ventricle.(28)
The early diastolic wave and the appendage contraction wave fuse,
resulting in total higher velocities in patients with sinus tachycardia.
Mitral Valve Disease and Left Atrial Appendage
In Mitral stenosis which is hemodynamically significant, there will be
increased resistance to left atrial appendage emptying both during active and
passive phases. This will cause lowered velocities of left atrial appendage
A study by Hwang et al, in patients with rheumatic mitral valve
disease and without rheumatic heart disease has also shown that the
contraction velocities of left atrial appendage were decreased irrespective of
the patients in sinus rhythm and atrial fibrillation. (29)
A study by Lin et al also showed that in patients with atrial fibrillation
and mitral stenosis, the normal increase in the left atrial appendage flow
during diastole is impaired; this is due to hemodynamically significant
stenosis. (30)
In patients with hemodynamically significant mitral stenosis and atrial
fibrillation, the velocities obtained from the left atrial appendage will be
lower or absent. Whereas in patients with atrial fibrillation and
non-rheumatic etiology there is a wide difference in the left atrial appendage
flow velocities ranging from ≥ 25cm/ sec which was taken as high and <25
cm/ sec which was taken as low.(31)
The elevated left atrial pressures hemodynamically significant mitral
stenosis influences the function of left atrial appendage. Also the
inflammatory process off rheumatic heart disease involves the left atrium
and left atrial appendage. Another cause is atrial myopathy, resulting from
In a study by Lee et al in asymptomatic patients with mitral valve
prosthesis, left atrial spontaneous echo contrast was present. This is due to
the effect of longstanding pressurised valvular disease on the function of left
atrial and left atrial appendage and also due to the stenosis of the prosthetic
valve. (32) The recovery of left atrial appendage function following balloon
mitral valvotomy is due to the hemodynamic relief of the valvular stenosis.
This is due to the fall in the transmitral pressure gradient.
Transesophageal echocardiogram performed after balloon valvotomy
showed resumption of left atrial appendage function. This is seen within
24-72 hours post procedure. This effect is also seen in patients with atrial
fibrillation as well as in sinus rhythm. (33) Mitral regurgitation on the other
hand which is hemodynamically significant also impairs the function of left
atrial appendage. This is due to the dilation of left atrial appendage and left
atrium and also due to the elevation of filling pressures. In spite of decrease
of left atrial appendage function by mitral regurgitation, it also doesn’t cause
thromboembolism due to the prevention of stasis of blood in left atrium.
There were few studies in the past for patients in sinus rhythm with
rheumatic heart disease with mitral valve involvement and its impact on the
left atrial appendage dysfunction. Left atrial and left atrial appendage
velocities of the appendage.
Larger prospective trials should throw light on the possible role of left
atrial appendage dysfunction in those patients with sinus rhythm and its
implications for future thromboembolic events. This should also address
whether left atrial appendage dysfunction also predisposes to the
development of atrial fibrillation.
THE MITRAL ANNULUS AND THE MITRAL VALVE
The role of mitral annulus for proper functioning of Mitral valve, left
atrium and left ventricle cannot be overemphasized. During systole the
mitral annular movement will be towards apex and during diastole the
annulus moves towards the left atrium. The movement of the mitral annulus
will produce a suction effect and it aids filling of left atrium by a suction
effect. The annular movement towards atrium during diastole also aids in
emptying of left atrium by reduction of left atrial volume. (34)
Normal Long Axis Function
The left ventricle has both longitudinal and circumferential fibers. The
majority of fibers of left ventricle are arranged circumferentially. Both fibers
circular fibers. The long axis of the ventricle goes from the apex to the base
of the heart. The anatomical definition of the apex is precise, whereas the
base of the heart is conveniently fixed at the atrioventricular rings. (35)
The atrio-ventricular interaction is such that during ventricular systole
the AV rings moves towards the apex. This leads to the increased volume of
atria as its floor move caudally and this creates a suction effect of blood into
the atria from pulmonary veins and vena cavae.
The shortening of long axis during systole was around 10-12% and the
short axis falls by 25%. This leads to the cavity becoming less spherical. The
contribution of longitudinal fibers to the systolic work done by the ventricle
is less, in comparison with circumferential fibers. The contribution of
longitudinal fibers gain significance due to its important role in mediating
AV interactions during systole and diastole.
Zaky and colleagues were the first to describe the mitral annular
motion. They initially described the motion of the annulus was from base to
apex. Having complex 3D motion pattern, the annular ring as got 3
components
1) Annular motion along long axis of the ventricle from basal region
to the apical region.
3) Sphincter like movements
In a study by Simonson and Pai et al, published in American Journal
of Cardiology in the year 1991, showed that a strong correlation exists
between left ventricular ejection fraction and the annular displacement
during systole measured by M-mode echocardiography. Both longitudinal
and radial functions were affected in cardiac diseases. There will be early
involvement of long axis myocardial function than the radial function.
Tissue Doppler during echocardiographic evaluation helps in the assessment
of longitudinal myocardial function. (36)
The calculation of annular velocities is an established method of
assessment of global left and right ventricular function. The annular systolic
velocity is highest in the lateral annulus. This is due to the abundance of
longitudinal fibers in the free wall of left ventricle.
A simple and reliable method for calculating the global and
longitudinal left ventricular systolic function is the calculation of mitral
annular systolic velocity obtained by tissue Doppler imaging. Lower mitral
annular systolic velocity in the septal side is due to the abundance of circular
fibers in that area and also due to the influence of right ventricle on the
movement of septum.
commissural fusion, thickening of mitral apparatus, impaired mobility,
calcification and chordal fusion. In a study done by Kuytulos et al published
in the Journal of American Society of Echocardiography, showed that
reduction in systolic myocardial velocities in mitral stenosis is due to
functional changes rather than myocardial pathology. The reduction in
myocardial systolic velocities also show a negative correlation with mitral
METHODOLOGY
STUDY DESIGN
The present study was a prospective study based on semi invasive
procedure conducted in the department of cardiology in Madras Medical
College and Rajiv Gandhi Government General Hospital for a period of
three months from January 2014. Informed written consent was obtained
from all the patients prior to the start of the study. Institutional ethics
committee approval was obtained.
STUDY POPULATION AND PATIENT SELECTION
The total number of patients selected for the study was 60. The
selection criteria of patient were as follows:
INCLUSION CRITERIA
• Patient with moderate to severe Mitral Stenosis with MVO <1.5 cm2
were included in the study.
EXCLUSION CRITERIA
• Aortic regurgitation – Moderate and severe
• Aortic stenosis
• Post PTMC or CMC
• Congestive heart failure
• Patients on oral anti-coagulants
• Hypertension
• Hyperthyroidism
• Diabetes mellitus
• Coronary artery disease
• Patient unwilling for transesophageal echocardiography
• Pregnancy and puerperium
METHODS
All eligible patients underwent detailed history and clinical
examination. A 12 lead electrocardiogram was taken. Atrial fibrillation
diagnosis was based on electrocardiogram.
ECHOCARDIOGRAPHIC DATA
Echocardiographic evaluation was done for all patients with Phillips
HD 7XE echocardiographic machine. For transthoracic echo imaging a 2
multi plane probe were used. Various echocardiographic parameters were
measured as follows:
1) LVEF
By modified Simpson’s method
2) MVO
By planimetry in PSAX view
By Pressure half time
3) Trans-mitral mean gradients
4) Trans-mitral peak gradients
Calculated using modified Bernoulli equation.
5) LA size (PLAX view)
AP diameter measured at end systole
6) Tissue Doppler imaging
• A4C view
• Pulse wave sample volume location – lateral corner of mitral
annulus
• Activation of TDI function
• Velocity scale selected 30cm/sec
• Sector angle <60°
• Minimal optimal gain settings such that trans
signals eliminated
• Adjustment of Doppler signal filters such that Nquist limit were
between -20 and +20 cm/sec
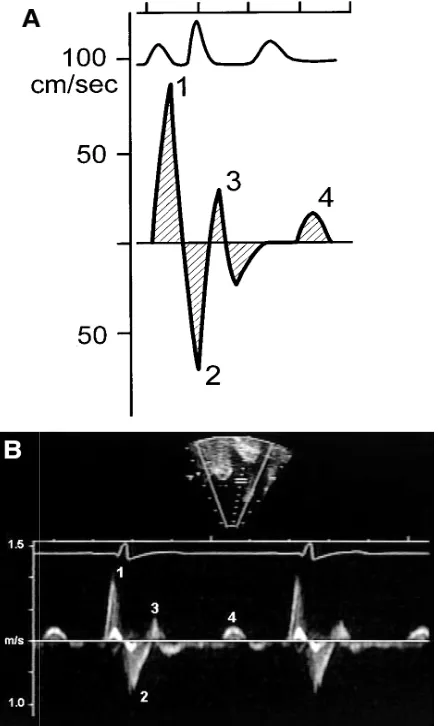
Three important velocities reordered
1) Systolic myocardial velocity which was a positive wave
2) Em and Am waves which were negative waves and occur during
[image:39.612.139.497.413.679.2]diastole
Figure 1 showing three important velocities in TDI of Mitral annulus Sector angle <60°
Minimal optimal gain settings such that trans-mitral flow
signals eliminated
Adjustment of Doppler signal filters such that Nquist limit were
20 and +20 cm/sec
Three important velocities reordered:
Systolic myocardial velocity which was a positive wave
and Am waves which were negative waves and occur during
showing three important velocities in TDI of Mitral annulus itral flow
Adjustment of Doppler signal filters such that Nquist limit were
and Am waves which were negative waves and occur during
Grading of Mitral Stenosis
Mild 1.5- 2.5 cm2
Moderate 1.0 – 1.49 cm2
Severe <1 cm2
Transesophageal Echocardiography
• Lignocaine was used for local anaesthesia
• LA appendage visualized in 2 orthogonal views
1) A short axis view in the horizontal plane at the base of the heart
at about 45°
2) With 90° to 120° transducer rotation and counter clockwise
rotation of probe
All patients were instructed for fast for at least 4 hours prior to TEE
The thrombus and transduction in left atrial appendage were
distinguished by visualizing in more than 1 view. The tuberculation in the
appendage were more linear and were in continuity with the atrial wall.
Thrombi tend to project into the left atrial appendage and have an
independent motion. Thrombus mobility and size were noted. Size of
thrombus was measure in major and minor dimensions.
optimized to reduce gray-noise artefacts.
Spontaneous ECHO contrast was identified by clouds of echoes which
are dynamic and slow curling in a circular shape. The Echo contrast was
graded as follows(37)
0 – Absent
1+ - Only mild echogenicity present
Not seen with the gain settings that are used for conventional 2D Echo
imaging.
2+ - Mild to moderate echogenicity noted. Seen without optimizing
gain settings
3+ - The swirling pattern is moderately dense and was seen
throughout the cardiac cycle.
The density is less when compared within the left atrium
4+ - Severe intensity and comparable to those in the main cavity
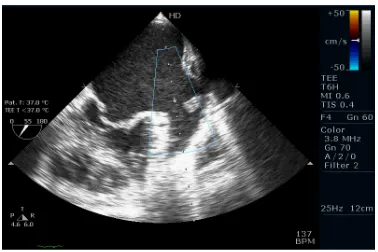
Pulse Doppler imaging was used to assess the function of left atrial
appendage. The sample volume is placed just inside the orifice of the
appendage. The maximum velocity during the atrial systole was measured.
This velocity was taken as peak LAA emptying velocity. A cutoff value of
<25cm/Sec was taken as inactive appendage.
Group A1 – Patients in Sinus rhythm and peak emptying velocity of
appendage of >25cm/Sec
Group A2 – Patient in Sinus rhythm and peak emptying velocity of
appendage of <25cm/Sec
Group B – Patient in Atrial fibrillation
STATISTICAL ANALYSIS
Categorical variables between the groups were compared using
chi-square test. Continuous variables are tabulated as Mean and Standard
Deviation. Unpaired Student t test had been used for the analysis of the
Continuous variables. Then multivariate analysis was done to assess the
relative importance to the predictors of the LAA inactivity. The parameters
included in multivariate analysis were age, left atrial dimension, mitral valve
area, gradients across the mitral valve and S wave velocity. A receiver
operator characteristic curve analysis was performed to know the cut-off
point of S wave velocity to predict the LA appendage dysfunction in sinus
rhythm patients. The statistical analysis was performed by using. Software
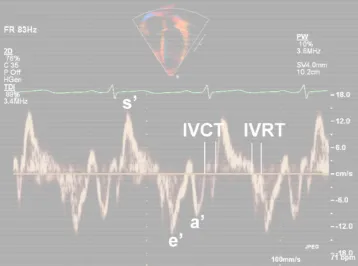
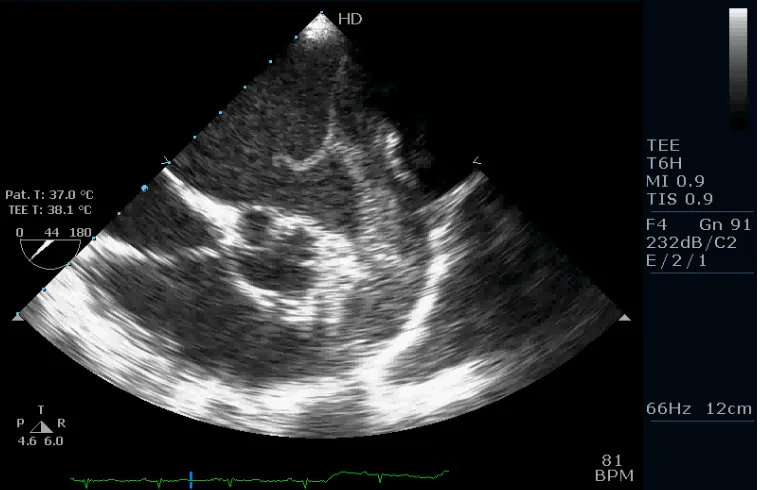
Figure 2: TEE - Measurement of LA appendage emptying Velocity
[image:43.612.129.509.464.709.2]Figure 4: TDI of Lateral Mitral Annulus
[image:44.612.129.507.430.682.2]Results and Analysis of Observed Data
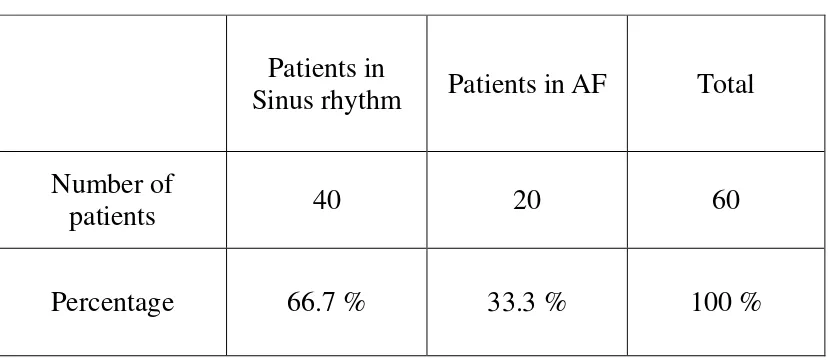
Total number of patients in our study were 60. Among 60 patients, 40
were in sinus rhythm constituting 66.7 % of the study population and 20
were in atrial fibrillation constituting 33.3 %. Hence patients were divided
into 2 groups, Group A – sinus rhythm patients and Group B – patients with
atrial fibrillation. The patient characteristics regarding rhythm is depicted in
[image:45.612.111.525.387.567.2]Table No. 1 and Figure No. 1.
Table No 1: Patient Characteristics
Patients in
Sinus rhythm Patients in AF Total
Number of
patients 40 20 60
Figure 1: Patient Characteristics
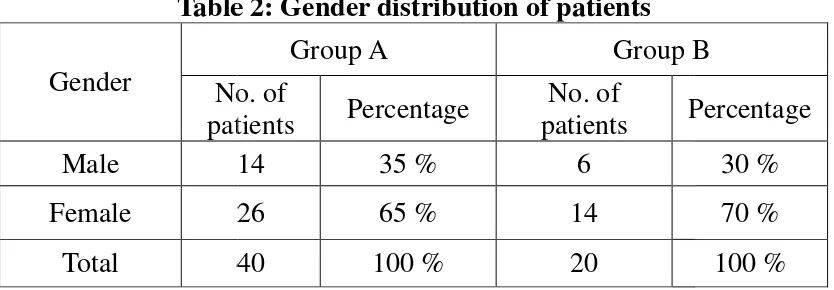
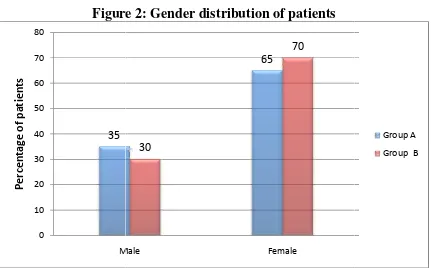
Regarding gender distribution, 20 patients were male among the total
study population of 60. Females are more common with 40 patients. Among
group A, 14 patients were males and 6 patients were females. In
fibrillation group, 14 patients were females
both subgroups female patients outnumbered male patients.
Table 2: Gender distribution of patients
Gender No. of
patients
Male 14
Female 26
Total 40
[image:46.612.110.527.533.678.2]33%
Figure 1: Patient Characteristics
Regarding gender distribution, 20 patients were male among the total
study population of 60. Females are more common with 40 patients. Among
group A, 14 patients were males and 6 patients were females. In
fibrillation group, 14 patients were females and 6 patients were males. In
both subgroups female patients outnumbered male patients.
Table 2: Gender distribution of patients
Group A Group B
No. of
patients Percentage
No. of
patients Percentage
14 35 % 6
26 65 % 14
40 100 % 20
67%
Regarding gender distribution, 20 patients were male among the total
study population of 60. Females are more common with 40 patients. Among
group A, 14 patients were males and 6 patients were females. In atrial
and 6 patients were males. In
Figure
Gender distribution of patients among groups are shown in Table No.
2 and Figure No. 2.
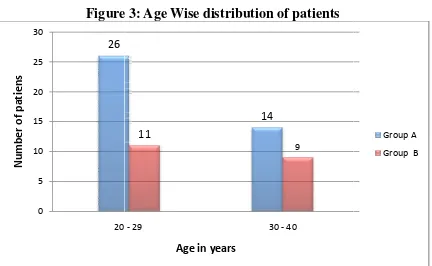
In our study, 37 (61.6 %) patients were in the age group of 20
years. The remaining 23 patients were in the age group of 30
patient in our study has age more than 40 years or less than 20 years. In
Group A 65 % of the patients were in a
Group B 55 % of the patients were in age group of 20
and age wise distribution of the study population among groups are not
statistically significant. The age wise distribution of the patients are show
in Table no. 3 and in Figure No. 3. 35 0 10 20 30 40 50 60 70 80 Male P e rc e n ta g e o f p a ti e n ts
Figure 2: Gender distribution of patients
Gender distribution of patients among groups are shown in Table No.
In our study, 37 (61.6 %) patients were in the age group of 20
years. The remaining 23 patients were in the age group of 30 – 40 years. No
patient in our study has age more than 40 years or less than 20 years. In
Group A 65 % of the patients were in age group of 20 – 29 years and in
Group B 55 % of the patients were in age group of 20- 29 years. The gender
and age wise distribution of the study population among groups are not
statistically significant. The age wise distribution of the patients are show
in Table no. 3 and in Figure No. 3.
65
30
70
Male Female
Gender distribution of patients among groups are shown in Table No.
In our study, 37 (61.6 %) patients were in the age group of 20 – 29
40 years. No
patient in our study has age more than 40 years or less than 20 years. In
29 years and in
29 years. The gender
and age wise distribution of the study population among groups are not
statistically significant. The age wise distribution of the patients are shown Group A
Table 3: Age Wise distribution of patients
Age in years
No. of patients
20 - 29 26
30 - 40 14
Total 40
Figure
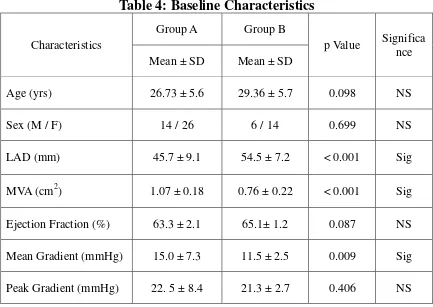
Baseline Characteristics between Group A and Group B
The mean age for Group A is 26.7 years and for Group B is 29.3
[image:48.612.104.536.305.571.2]which was not statistically significant. The mean left 26 0 5 10 15 20 25 30 20 N u m b e r o f p a ti e n s
Table 3: Age Wise distribution of patients
Group A Group B
No. of
patients Percentage
No. of
patients Percentage
26 65 % 11
14 35 % 9
40 100 % 20
Figure 3: Age Wise distribution of patients
Baseline Characteristics between Group A and Group B
he mean age for Group A is 26.7 years and for Group B is 29.3
which was not statistically significant. The mean left atrial diameter for 14
11
9
20 - 29 30 - 40
Age in years
Group B
Percentage
55 %
45 %
100 %
he mean age for Group A is 26.7 years and for Group B is 29.3
diameter for Group A
Group A patients was 45.7 mm and Group B was 54.5 mm. The difference in
[image:49.612.100.533.163.470.2]LA diameter between the two groups is statistically significant. (p <0.001).
Table 4: Baseline Characteristics
Characteristics
Group A Group B
p Value Significa nce
Mean ± SD Mean ± SD
Age (yrs) 26.73 ± 5.6 29.36 ± 5.7 0.098 NS
Sex (M / F) 14 / 26 6 / 14 0.699 NS
LAD (mm) 45.7 ± 9.1 54.5 ± 7.2 < 0.001 Sig
MVA (cm2) 1.07 ± 0.18 0.76 ± 0.22 < 0.001 Sig
Ejection Fraction (%) 63.3 ± 2.1 65.1± 1.2 0.087 NS
Mean Gradient (mmHg) 15.0 ± 7.3 11.5 ± 2.5 0.009 Sig
Peak Gradient (mmHg) 22. 5 ± 8.4 21.3 ± 2.7 0.406 NS
Mean mitral valve area is smaller in Group B with mean of 0.76 cm2
compared to Group A with mean of 1.07 cm2 . The difference between both
groups are statistically significant. (p <0.001). Left ventricular ejection
fraction is similar in both groups and does not achieve statistical
significance. Mean gradient (MG) across mitral valve was has mean of 15
mmHg in Group A whereas in Group B it is 11.5 mmHg. The difference of
difference between peak gradients in both the groups was not statistically
[image:50.612.104.531.200.469.2]significant. The mean values and p values are tabulated in Table no. 4
Table 5: TDI and TEE Variables
Characteristics
Group A Group B
p Value Significa nce
Mean ± SD Mean ± SD
Sm Velocity (cm/sec) 17.1± 3.7 12.3 ± 1.0 < 0.0001 Sig
Em (cm/sec) 13.8 ± 1.8 12.7 ± 2.3 0.070 NS
Am (cm/sec) 14.8 ± 2.7 - - -
Laaev (cm/sec) 24.3 ± 9.4 4.5 ± 2.2 < 0.001 Sig
% of patients with SEC 22 (55 %) 20 (100%) < 0.001 Sig % of patients with
thrombus 2 (5%) 11 (55%) <0.001 Sig
Peak annular systolic velocity (S’) is statistically significant between
Group A and Group B. (p<0.0001). Mean Sm velocity in Group A is 17.1
cm/sec and in Group B is 12. 3 cm/sec. Mean early diastolic annular velocity
(Em) is 13.8 cm/sec in Group A and 12.7 cm/sec in Group B. The difference
between 2 groups is statistically not significant. Mean late diastolic annular
velocity in Group A is 14.8 cm/sec. Group B patients does not have late
atrial appendage emptying velocity is different between both groups. In
Group A patients the mean Laaev is 24.3 cm/sec and in Group B patients the
mean Laaev is 4.5 cm/sec. The difference between both groups is
statistically significant. (p < 0.001).
22 patients of Group A were having spontaneous echo contrast (SEC)
constituting 55 % of that population. All 20 patients in Group B had
spontaneous echo contrast. The difference is statistically significant. (p <
0.001). Left atrial appendage thrombus was found in 2 persons in Group A
and 11 persons in Group B which corresponds to 5 % and 55 % of the study
groups respectively. The difference in occurrence of thrombus is statistically
significant. (p < 0.001). The details of TDI and TEE findings are tabulated
in Table No. 5
18 patients in Group A did not show any spontaneous echo contrast in
contrary to Group B patients in whom no one was free of spontaneous echo
contrast. In Group B patients, the number of patients is increasing in an
ascending pattern as the grade of density of spontaneous echo contrast is
increasing. In Group A one patients is having grade 4 SEC whereas in
Group B 8 patients are having grade 4 SEC. The differences between both
groups regarding the presence of various grades of SEC are statistically
Table 6: Spontaneous Echo contrast density grading
Group
0
Group A 18
Group B 0
Total 18
Figure 4: Shows trend of SEC density in Groups of patients
Comparison between study groups
The Group A is further sub divided into 2 groups depending upon left 18 8 0 0 2 4 6 8 10 12 14 16 18 20
Grade 0 Grade 1
: Spontaneous Echo contrast density grading
SEC Grading
1 2 3 4
8 8 5 1
4 3 5 8
12 11 10 9
: Shows trend of SEC density in Groups of patients
Comparison between study groups
The Group A is further sub divided into 2 groups depending upon left 8 5 1 4 3 5 8
Grade 1 Grade 2 Grade 3 Grade 4 : Spontaneous Echo contrast density grading
p Value
< 0.001
: Shows trend of SEC density in Groups of patients
The Group A is further sub divided into 2 groups depending upon left Group A
[image:52.612.104.532.350.608.2]atrial appendage emptying velocity. Group A1 is having left atrial appendage
emptying velocity ≥ 25 cm/sec and Group A2 patients were having left atrial
emptying velocity < 25 cm/sec. Group B (Atrial Fibrillation group) is kept
as such and not subdivided as the Laaev < 25 cm/sec in all cases. The
subgroups are compared within for statistical significance as follows.
P1 – Comparison between Group A1 and A2
P2 – Comparison between Group A1 and B
P3 – Comparison between Group A2 and B
The distribution of gender and age groups between all 3 subgroups are
not statistically significant when they are compared within them. The mean
left atrial dimension was 40.1 mm in Group A1, 50.7 mm in Group A2 and
54.5 mm in Group B. The difference is statistically significant between
Group A1 and A2, Groups A1 and B. The difference between Groups A2 and
B (P3) is not statistically significant. (p3 = 0.162). There is also a
progressive increase in LA dimension when we move from Group A1 to
Group A2 to Group B.
Mean mitral valve area is 1.22 cm2 in Group A1, 0.94 cm2 in Group
A2 and 0.76 cm2 in Group B. The inter differences in between the three
groups is statistically significant. Stenosis severity is progressively
fraction does not vary significantly between groups.
Mean gradient and peak gradient were statistically significant between
groups. Mean and Peak gradients increase progressively as we move from
Group A1 to Group A2. The Peak and mean gradient in Group B is lesser
[image:54.612.100.533.272.563.2]that that of Group A2. The results are tabulated in following Table No. 7
Table 7: Patient Groups Characteristics - TTE
Variable Group A1 Group A2 Group B
p1 p2 p3
Mean ± SD Mean ± SD Mean ± SD
Age (Years) 26.74 ±
5.32 27.86 ± 6.3 29.35 ± 5.76 0.539 0.150 0.424
Sex (M / F) 7 / 12 7 / 14 6 / 14 0.816 0.651 0.819
LAD (mm) 40.1 ± 3.2 50.7 ± 9.8 54.5 ± 7.2 < 0.001 < 0.001 0.162
MVA (cm2) 1.22 ± 0.15 0.94 ± 0.09 0.76 ± 0.20 < 0.001 < 0.001 0.004
EF (%) 63.6 ± 2.5 63.0 ± 1.8 65.1 ± 1.3 0.410 0.082 0.203
MG (mmHg) 8.84 ± 2.1 20.6 ± 5.4 11.5 ± 2.5 < 0.001 < 0.001 < 0.001
PG (mmHg) 15.4 ± 4.0 29.0 ± 5.7 21.3 ± 2.7 < 0.001 < 0.001 < 0.001
Comparing tissue Doppler imaging parameters, the mean peak mitral
annular systolic velocity (S wave) is 19.4 cm/sec in Group A1, 15.1 in
Group A2 and 12.3 cm/sec in Group B. The differences between these 3
wave velocity when we move from Group A1 to Group A2 to Group B.
There are no statistically significant variations between early diastolic
velocities (Em) of mitral annulus in between sub groups.
As the late diastolic mitral annular velocity (Am) is absent in Groups
B (presence of atrial fibrillation abolishes Am wave), it is only compared
within Group A1 and A2. The mean Am velocity is 16.1 cm /sec in Group
A1 and 13.5 cm/sec in A2. The difference in means and standard deviation
[image:55.612.102.533.357.589.2]between these groups is statistically significant.
Table 8: Patient Groups Characteristics – TDI & TEE
Variable Group A1 Group A2 Group B
p1 p2 p3
Mean ± SD Mean ± SD Mean ± SD
S Wave (cm/s) 19.4 ± 3.5 15.1 ± 2.6 12.3 ± 1.0 < 0.001 < 0.001 < 0.001
Em (cm/s) 14.3 ± 1.7 13.3 ± 1.8 12.7 ± 2.3 0.120 0.072 0.312
Am (cm/s) 16.1 ± 2.2 13.5 ± 2.6 - 0.002 - -
Laaev (cm/s) 31.7 ± 7.2 17.5 ± 5.2 4.5 ± 2.2 < 0.001 < 0.001 <0.001
% of patients
with SEC 3 (15.7 %) 19 (90.4 %) 20 (100 %) < 0.001 < 0.001 0.157 % of patients
with Thrombus 0 2 (9.5 %) 11 (55%) 0.168 < 0.001 0.002
The mean left atrial appendage emptying velocity in Group A1 is 31.7
cm/sec, in Group A2 is 17.5 cm/sec and in Group B is 4.5 cm/sec. There is
is also a progressive decreasing trend when we move from Group A1 to
Group A2 to Group 3.
[image:56.612.103.536.219.501.2]Laaev is depicted in the figure below.
Figure 5: Bar graph showing decreasing Laaev, Sm and Am wave
3 patients in Group A1 had spontaneous echo contrast constituting
15.7 % pf that population, Group A2 had 19 patients were having SEC
constituting 90.4 %. In Group B, all the patients had spontaneous echo
contrast. The difference between Groups A1 and A2
and Group B is statistically significant. The difference between Group A2
and Group B is not statistically significant. (p = 0.157). No patients in Group 31.7 19.4 16.1 0 5 10 15 20 25 30 35 Group A1
is also a progressive decreasing trend when we move from Group A1 to
Group A2 to Group 3. The decreasing trend in Sm wave, Am wave and
Laaev is depicted in the figure below.
Bar graph showing decreasing Laaev, Sm and Am wave
3 patients in Group A1 had spontaneous echo contrast constituting
15.7 % pf that population, Group A2 had 19 patients were having SEC
constituting 90.4 %. In Group B, all the patients had spontaneous echo
contrast. The difference between Groups A1 and A2 and between Group A1
and Group B is statistically significant. The difference between Group A2
and Group B is not statistically significant. (p = 0.157). No patients in Group 17.5 4.5 15.1 12.3 13.5 0
Group A2 Group B
is also a progressive decreasing trend when we move from Group A1 to
The decreasing trend in Sm wave, Am wave and
Bar graph showing decreasing Laaev, Sm and Am wave
3 patients in Group A1 had spontaneous echo contrast constituting
15.7 % pf that population, Group A2 had 19 patients were having SEC
constituting 90.4 %. In Group B, all the patients had spontaneous echo
and between Group A1
and Group B is statistically significant. The difference between Group A2
and Group B is not statistically significant. (p = 0.157). No patients in Group
A1 had any thrombus whereas 2 patients in Group A2 had thrombus. 11
patients in Group B had thrombus as already discussed above. The
difference between Group A1 and A2 is statistically not significant (p=
0.168). The difference between Groups A1 & B and Groups A2 & B were
statistically significant. The details of differences in TDI and TEE
parameters are shown in Table No.8.
16 patients in Group A1 did not show any spontaneous echo contrast,
in Group A2 two persons does not have any spontaneous echo contrast in
contrary to Group B patients in whom no one was free of spontaneous echo
contrast. Grade 3 and Grade 4 SEC is absent in Group A1 patients whereas 5
persons in Group A2 & Group B had Grade 3 spontaneous echo contrast.
Grade 4 spontaneous echo contrast is present in only one patient in Group
A2 whereas 8 persons in Group B had Grade 4 SEC. The difference is
statistically significant as depicted in the Table No. 9 below.
SEC Group A1 Group A2 Group B p1 p2 p3
Grade 0 16 2 0
< 0.001 < 0.001 0.049
Grade 1 2 6 4
Grade 2 1 7 3
Grade 3 0 5 5
Grade 4 0 1 8
Total 19 21 20
The relationship between left atrial appendage emptying velocity and
peak annular systolic velocity was studied using Pearson correlation. There
was positive correlation between these two variables which are statistically
significant. (Pearson correlation coefficient r = 0.944, p value < 0.001). The
relationship between Laaev and S wave is depicted in scatter plot in Figure
No.6.
There was positive correlation between left atrial appendage emptying
velocity and mitral annular late diastolic velocity in patients in sinus rhythm.
The Pearson Correlation coefficient r = 0.695 (p < 0.001). The relationship is
shown in scatter diagram in Figure No. 7
Figure 6: Correlation between Laaev and S wave
Figure 7: Correlation between Laaev and S wave
10 15 20 25 30
0 10 20 30 40 50
Peak Annular Systolic Velocity (cm/sec)
L e ft A tr ia l A p p e n d a g e E m p ty in g V e lo c ity ( c m /s e c )
10 12 14 16 18 20
10 15 20 25 30 35 40 45 50
Peak Annular Late Diastolic Velocity (cm/sec)
L e ft A tr ia l A p p e n d a g e E m p ty in g V e lo c it y ( c m /s e c ) Case 15
Pearson r = 0.952 Significance p < 0.001
[image:59.612.151.476.431.672.2]