Rochester Institute of Technology
RIT Scholar Works
Theses Thesis/Dissertation Collections
5-9-2017
Validation of a Method to Estimate Skin Spectral
Reflectance Using a Digital Camera.
Christopher Thorstenson [email protected]
Follow this and additional works at:http://scholarworks.rit.edu/theses
This Thesis is brought to you for free and open access by the Thesis/Dissertation Collections at RIT Scholar Works. It has been accepted for inclusion in Theses by an authorized administrator of RIT Scholar Works. For more information, please [email protected].
Recommended Citation
R
.I
.T
Validation of a Method to Estimate Skin Spectral Reflectance Using a Digital Camera.
by
Christopher Thorstenson
A Thesis Submitted in Partial Fulfillment of the Requirements for the Degree of Masters of Science
in Color Science
Program of Color Science College of Science
Rochester Institute of Technology Rochester, NY
May 9, 2017
Signature of Author ____________________________________________________________________
COLLEGE OF SCIENCE
ROCHESTER INSTITUTE OF TECHNOLOGY ROCHESTER, NEW YORK
CERTIFICATE OF APPROVAL
MASTERS DEGREE THESIS
The Masters Degree Thesis of Christopher Thorstenson Has been examined and approved by the
Committee as satisfactory for the Thesis required for the Masters degree in Color Science
_____________________________________________________________________________________________________
Dr. Mark D. Fairchild, Advisor
_____________________________________________________________________________________________________
Dr. Michael Murdoch
_____________________________________________________________________________________________________
THESIS RELEASE PERMISSION ROCHESTER INSTITUTE OF TECHNOLOGY
PROGRAM OF COLOR SCIENCE
Title of Thesis:
Validation of a Method to Estimate Skin Spectral Reflectance Using a Digital Camera.
I, Christopher Thorstenson, hereby grant permission to Wallace Memorial Library of R.I.T. to reproduce my thesis in whole or in part. Any reproduction will not be for commercial use or profit.
Signature _____________________________________________________________________________
Abstract
The accurate measurement of skin color and skin spectral reflectance is becoming increasingly desirable due to its application across several domains, including medical, cosmetics, graphic arts, automation, and social science fields. While there exist robust ways to accurately measure color and spectral reflectance, these methods typically require the use of specialized instruments which are often expensive, invasive, and require expert training. Therefore, it would clearly be advantageous to develop methods that can extract accurate colorimetric and spectral data from readily-available, inexpensive digital RGB cameras. Such methodology involves overcoming several fundamental obstacles due to the limitations of RGB camera data.
Acknowledgements
I would like to thank my advisor, Dr. Mark Fairchild, for his guidance, advice, and patience throughout this process. It has been a pleasure to work and learn with him over the past years.
I would like to thank my family, Romina, Jeff, and Jillian, who have been unending in their support. I would not be where I am without them.
I would like to thank my RIT cohort, Ben Bodner, Nargess Hassani, and Yixuan Wang. I could not imagine navigating the program without our collaborative efforts. I would also like to thank fellow students, especially Brittany Cox, Joel Witwer, Dr. Yuta Asano, Dr. Max Derhak, Dr. Jennifer Kruschwitz, Dr. Adrià Forés Herranz, and Dr. David Long, for their advice and support throughout the program.
I would like to thank Dr. Roy Berns, Dr. Susan Farnand, Dr. David Wyble, and Dr. Michael Murdoch, for sharing their knowledge and time with me over these past few years.
I would like to thank Valerie Hemink for her constant help and encouragement.
I would like to thank my UR advisor, Dr. Andrew Elliot, for supporting my autonomy in pursuing this program.
Contents
Abstract ... i
Acknowledgements ... ii
Contents ... iii
List of Figures ... iv
List of Tables ... vi
1. Introduction ... 1
2. Background ... 2
2.1. Remote Measurement of Color ... 2
2.2. ColourWorker Functionality ... 4
2.3. Basics of Color Vision ... 5
2.4. Skin Properties ... 6
3. Experiment 1 ... 10
3.1. Methods ... 11
3.1.1. Subjects ... 11
3.1.2. Apparatus ... 11
3.1.3. Procedure ... 14
3.1.4. Measured Reflectance Spectra ... 14
3.1.5. Estimated Reflectance Spectra ... 14
3.2. Results and Discussion ... 17
3.2.1. Results ... 17
3.2.2. Discussion ... 21
4. Experiment 2 ... 22
4.1. Methods ... 22
4.1.1. Subjects ... 22
4.1.2. Apparatus ... 22
4.1.3. Procedure ... 25
4.1.4. Measured Reflectance Spectra ... 27
4.1.5. Estimated Reflectance Spectra ... 27
4.2. Results and Discussion ... 29
4.2.1. Results ... 29
4.2.2. Discussion ... 38
5. Summary, Conclusions, and Future Directions ... 38
List of Figures
Figure 2-1: Relative spectral sensitivity of S, M, and L cones by wavelength ... 6 Figure 2-2: Molecular extinction coefficient spectra of oxyhemoglobin and
deoxyhemoglobin ... 7 Figure 2-3: Molecular extinction coefficient spectra of melanin... 8 Figure 2-4: Example of skin spectral reflectance and color as a function of
hemoglobin properties ... 9 Figure 3-1: Example illustration of the apparatus in Experiment 1 ... 12 Figure 3-2: Normalized radiance of the source illuminant, measured by a PR655 spectroradiometer ... 13 Figure 3-3: Spectral reflectance of the 24-patch ColorChecker measured by an i1-pro spectrophotometer ... 13 Figure 3-4: Reference spectra used in Experiment 1... 16 Figure 3-5: Estimated reflectance spectra (M+/-SD) against Measured reflectance spectra (M+/-SD) for each subject in Experiment 1... 18 Figure 3-6: Mean+/-SD of L* error between measured and estimated colorimetric data for each of 5 subjects ... 19 Figure 3-7: Mean+/-SD of a* error between measured and estimated colorimetric data for each of 5 subjects ... 20 Figure 3-8: Mean+/-SD of b* error between measured and estimated colorimetric data for each of 5 subjects ... 20 Figure 4-1:Example illustration of the apparatus in Experiment 2 ... 24 Figure 4-2: Illustration of the hemodynamics involved during the time course of the experiment... 26 Figure 4-3: Reference spectra used in Experiment 2... 28 Figure 4-4: Estimated reflectance spectra (M+/-SD) against Measured reflectance spectra (M+/-SD) for all subjects during baseline measurement ... 30 Figure 4-5: Estimated reflectance spectra (M+/-SD) against Measured reflectance spectra (M+/-SD) for all subjects during occlusion measurement ... 31 Figure 4-6: Estimated reflectance spectra (M+/-SD) against Measured reflectance spectra (M+/-SD) for all subjects during hyperaemia measurement ... 32 Figure 4-7: Mean+/-SD of CIELAB values. Difference between measured and
Figure 4-8: Mean+/-SD of CIELAB values. Difference between measured and
estimated colorimetric data for each of 6 subjects at occlusion ... 34 Figure 4-9: Mean+/-SD of CIELAB values. Difference between measured and
List of Tables
Table 3-1: Correlation (r) and root-mean-square-error (RMSE) for each subject’s estimated versus measured reflectance ... 19 Table 3-2: CIELAB values for each subject’s estimated versus measured
colorimetric data ... 21 Table 4-1: Correlation (r) and root-mean-square-error (RMSE) for the estimated versus measured reflectance at each physiological state ... 32 Table 4-2: CIELAB values for each subject’s estimated versus measured
1. Introduction
The accurate measurement of skin color is increasingly gaining importance
due to its useful applications across several domains. The assessment of skin color is
valuable to medical fields (e.g., identifying cutaneous or cardiovascular illnesses such
as diabetes, cyanosis, and hypertension; Changizi & Rio, 2010), the cosmetics industry
(e.g., skin tone matching; Kikuchi, Masuda, & Hirao, 2013), graphic arts (e.g., skin
modeling and portraiture; Sun & Fairchild, 2002), and skin color segmentation for
automated face processing (e.g., detection and recognition; Hsu, 2002; Yip & Sinha,
2002). Additionally, skin color has become increasingly studied in social sciences. For
instance, recent research has shown that skin color can indicate aerobic fitness
(Johnson, 1998), presence of sex hormones (Charkoudian, Stephens, Pirkle, Kosiba, &
Johnson, 1999), ovulatory cycle in women (Burriss et al., 2015), and emotional
responses (Drummond, 1994), and that facial color can influence perceptions of
health (Stephen, Law Smith, Stirrat, & Perrett, 2009), attractiveness (Re, Whitehead,
Xiao, & Perrett, 2011), emotion (Young, Thorstenson, & Pazda, 2016), and personality
(Stephen, Oldham, Perrett, & Barton, 2012). It is clear from this that colorimetric
measurement of skin provides useful computational, medical, aesthetic, and social
information.
The spectral reflectance of skin (i.e., the proportion of light reflected by skin
as a function of wavelength) provides additional information that colorimetric values
cannot. For instance, skin spectral reflectance data is necessary to model skin
artificial lighting). Further, skin spectral reflectance can be used to extract
information about skin chromophores (e.g., melanin, hemoglobin concentration, and
hemoglobin oxygenation; Nishidate, Aizu, & Mishina, 2004), which are important
physiological parameters that can be used to predict health, emotion, and skin type.
Therefore, the accurate measurement of skin reflectance, as well as skin color, is
valuable to several fields, including medical, cosmetic, aesthetic, and visual and social
research.
2. Background
2.1. Remote Measurement of Color
There currently exist several instruments that accurately measure
colorimetric and reflectance data from objects (e.g., spectrophotometers, spectral
radiometers). However, such devices are highly specialized (requiring advanced
training to operate), cost prohibitive, and sometimes invasive (requiring
device-to-surface contact). Given the availability and low cost of regular commercial RGB
cameras, it would seem ideal to explore methodology that involves measurement (or
estimation) of spectral reflectance and colorimetric data using readily-available RGB
cameras.
Color is difficult to measure accurately with a camera, due to a range of issues.
First, cameras represent color using three distinct numbers relating to the three
detectors (RGB). However, because reflectance spectra vary continuously as a
available color information. Additionally, illumination can vary across scenes, which
affects the intensity of light reflected from objects.
Despite these limitations, past research has shown that color information from
RGB cameras can be extracted and used to reconstruct reflectance spectra using
various techniques. These typically involve either the use of multiple chromatic filters
with known spectral characteristics (Imai & Berns, 1999), or characterizing the
camera sensitivities and modeling spectral estimates based on reference spectra
(Chiao, Osorio, Vorobyev, & Cronin, 2000; Zhang et al., 2017).
For instance, Imai and Berns (1999) demonstrated that the spectral
reflectance data of paintings can be recovered by combing a conventional RGB camera
with either a set of chromatic absorption filters (specifically, a blue, green, and no
filter) or multiple lighting sources (specifically Illuminants A and D65). This
technique takes advantage of the fact that pigments used in paintings contain
predictable spectral curves, minimizing the degrees of freedom needed to estimate
them, and then determines the relationship between the camera’s digital counts and
variation due to changes in either the multiple filters or multiple lighting conditions.
The researchers found that a linear method could be applied to estimate the spectral
reflectance from the camera’s digital counts for their test patches. The limitation of
this method is that it requires the target to remain fixed across multiple
measurements, while cycling through either multiple absorption filters or multiple
lighting conditions.
An alternative method involves characterizing the camera sensitivities and
al., 2017). The current research aims to test the validity of skin spectral estimation
using this latter method (reviewed below). Specifically, the current project tests the
ability of an existing system (i.e., ColourWorker; Anderson, Hallam, Nduka, & Osorio,
2015) to reliably estimate skin reflectance.
2.2. ColourWorker Functionality
As mentioned previously, reconstructing spectral measurements from RGB
cameras presents at least two main problems. First, illumination conditions (i.e., a
range of natural and artificial sources, such as daylight vs. fluorescent lighting) under
which camera recordings take place can vary across scenes. ColourWorker deals with
this problem by incorporating a calibration standard (e.g., X-rite ColorChecker) with
known reflectance spectra. The calibration standard is used to estimate the camera
(RGB) responses as a function of wavelength relative to a white reference. Because
the spectral characteristics of the calibration standard are known, this procedure
allows an estimation of the camera model and the illumination conditions. The
camera model is estimated by iteratively adjusting a set of parameters (spectral
sensitivity functions, and intensity response functions) in order to minimize the
difference between a measured camera response to the calibration standard and the
estimated response predicted by the camera model using a standard least squares
approach.
The second main problem is that camera images comprise three specific
values (RGB), while reflectance spectra vary continuously as a function of
wavelength. This is a problem because any given RGB signal can be reproduced by an
taking advantage of the fact that the reflectance spectra of natural materials (such as
skin) vary predictably, and are often influenced by three or fewer variables.
Therefore, the system can make use of a set of reference spectra measured from the
material of interest (in this case, skin) to estimate the likely reflectance spectra
produced given the RGB signal through linear modeling (see Anderson et al., 2015,
for more detailed information on this method). The specific reference spectra and
measurement details will be discussed in the Methods section for each experiment.
2.3. Basics of Color Vision
The first step in human vision occurs when light reflects or emanates from an
object or source, enters the eye, and is imaged on the retina. There, the photoreceptor
cells’ pigment molecules absorb the light and transduce electrical neural signals.
There are two main classes of photoreceptor, rods and cones, which are functionally
distinct. Rods operate at low light (scotopic) conditions, while cones operate at higher
light (photopic) conditions, with a midrange where both cones and rods operate
(mesopic). High resolution and color vision are present under photopic conditions.
While rods may have some effect on color perception under mesopic conditions, their
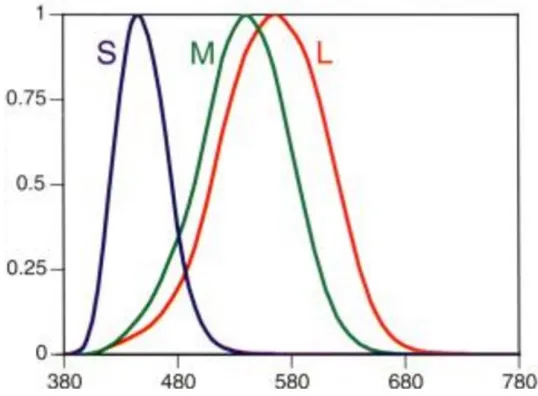
influence is small and can be ignored. Humans have three classes of cones. The
spectral absorption characteristics of the short (S), medium (M), and long (L)
wavelength cones are distinguished by the spectral sensitivities of their visual
pigments (see Figure 2-1). Our perception of color relies on having these three types
of cones which respond to, and integrate, light at various wavelengths. The
integration of these cone responses forms three color-opponent axes (Berns, 2000).
activation. A red-green chromatic axis results from subtracting M-cone activation
from L-cone activation. A yellow-blue chromatic axis results from the addition of L-
and M- cone activation, and subtracting S-cone activation. The color-opponent signals
then leave the retina via the optic nerve for further processing in cortical and
subcortical areas of the brain (for a comprehensive review of color vision processes,
[image:16.612.185.454.245.443.2]see Gegenfurtner & Kiper, 2003, and Goldstein et al., 2004).
Figure 2-1. Relative spectral sensitivity of the S, M, and L cones by wavelength (from Berns, 2000).
2.4. Skin Properties
Skin reflectance is influenced by various chromophores in the skin that absorb
light in different ways. Along the visible range of wavelength, the primary
chromophores that influence skin reflectance are hemoglobin and melanin (Zonios,
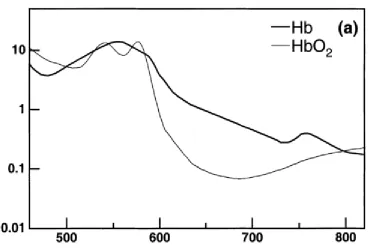
Bykowski, & Kollias, 2001). The absorptive properties of hemoglobin (see Figure
2-2) are responsible for blood’s reddish color, which is found in the vascular structures
of the dermis, approximately 50-500 µm below the skin surface. Further, oxygenated
approximately 90-95% of hemoglobin is oxygenated in the arteries, while only about
47% of the hemoglobin is oxygenated in the veins (Baranoski & Krishnaswamy;
2010).
Figure 2-2. Molecular extinction coefficient spectra of oxyhemoglobin and deoxyhemoglobin. From Zonios et al. (2001).
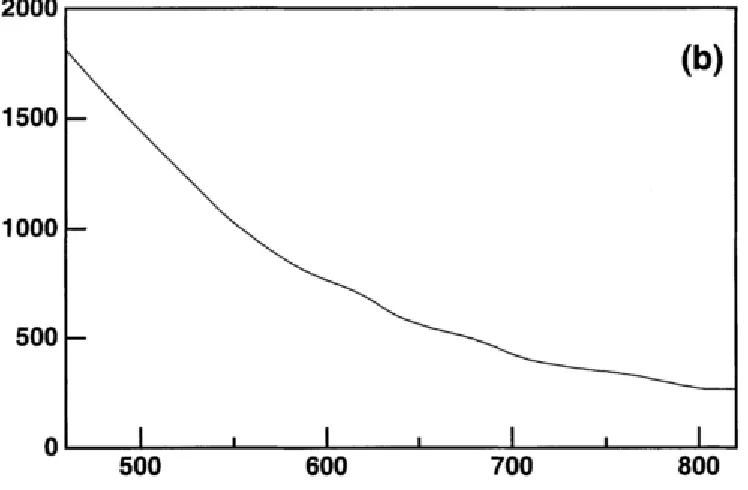
Melanin is found in the epidermis, approximately the top 50-100 µm of the
skin. Melanin is largely responsible for the variation in skin color across the human
population. The concentration of melanin in human skin ranges from low (Type I;
light Caucasian skin) to high (Type VI; black African skin). Additionally, UV radiation
provokes temporary increases in melanin concentration. Melanin absorbs light
strongly in the ultraviolet and low-visible range (see Figure 2-3), which lends to its
[image:17.612.118.488.157.407.2]Figure 2-3. Molecular extinction coefficient spectra of melanin. From Zonios et al. (2001).
While melanin concentration is relatively stable over time, Hemoglobin
concentration and oxygenation are transient, able to fluctuate significantly over short
periods of time. Dilation of the blood vessels, which increases the volume fraction of
the blood in the dermis, can be caused by a range of stimulation, including pressure,
temperature, vasoactive drugs, and psychological stress (Piérard, 1998).
Changes in hemoglobin concentration and oxygenation is responsible for skin
color changes due to dilation of blood vessels. Changes in these two variables lead to
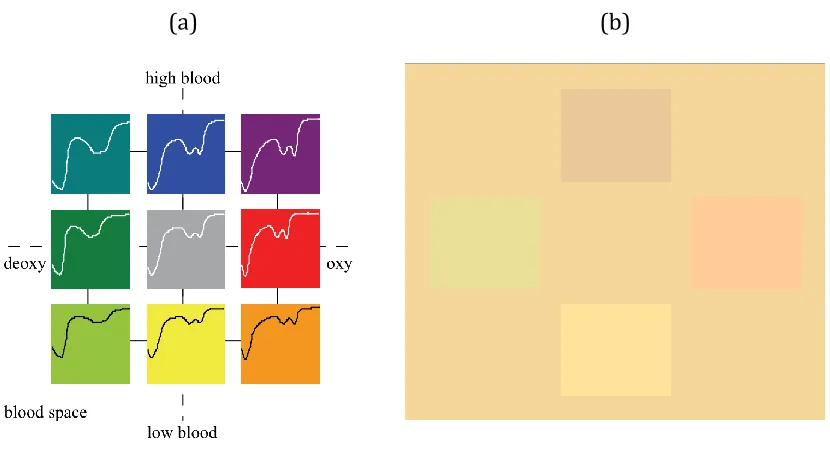
predictable changes in the reflectance and color of skin. Skin reflectance in the visible
range contains a characteristic ‘W’ feature (~525-575 nm) due to the absorptive
properties of oxygenated hemoglobin. Greater hemoglobin oxygenation leads to a
more prominent ‘W’ feature, increasing L-cone activation relative to the M-cone,
entire ‘W’ feature, increasing M- and L-cone activation relative to the S-cone, resulting
in bluer skin (see Figure 2-4; Changizi, Zhang, & Shimojo, 2006).
[image:19.612.104.519.153.383.2](a) (b)
Figure 2-4. Example of skin spectral reflectance (a) and color (b) modulations as a function of hemoglobin properties. From Changizi et al. (2006) and Changizi & Rio (2010).
The purpose of the current research is to test the functionality of the system
(ColourWorker) to accurately estimate skin reflectance and colorimetric data from
digital video taken from an RGB camera. As discussed previously, the accurate
estimation of reflectance and colorimetric data from digital cameras has many
applications across several domains (e.g., medical, cosmetic, graphic arts, automated
systems, social science). Social science research, in particular, can benefit from
inexpensive and non-invasive measurements of skin color and spectral reflectance.
characteristics such as health, attractiveness, emotion, and personality. The accurate
color measurement of actual faces can facilitate our understanding of the relationship
between skin color and social perception. Further, because skin spectral reflectance
can be used to extract physiological variables (e.g., hemoglobin, melanin), we can gain
a much richer understanding of the influence of physiology on social perception,
guided by skin color. Therefore, Experiment 1 tests whether skin color and spectral
reflectance can be accurately estimated from camera RGB data. Finally, because some
social states (e.g., emotion) involve transient changes of physiology (e.g., hemoglobin
changes), the current research emphasizes measurements of change over time.
Therefore, Experiment 2 tests whether changes in skin color and spectral reflectance
can be accurately captured from camera RGB data.
In Experiment 1, subjects were video-recorded at rest, while ground-truth
measurements were taken from a spectroradiometer. The system provided estimates
of skin reflectance and CIELAB color values, which were compared to the
ground-truth data. In Experiment 2, subjects were video-recorded (and ground-ground-truth
measurements were taken with a spectroradiometer) while a blood-pressure cuff
was used to manipulate the hemoglobin concentration and oxygenation of the skin.
The system again provided estimates of skin reflectance and CIELAB color values,
which were compared to the ground-truth data.
3. Experiment 1
Experiment 1 aimed to demonstrate the ability of ColourWorker (see section
ColourWorker was used to generate estimates of skin reflectance from subjects at
rest, which were compared to ground-truth measurements of skin reflectance taken
simultaneously.
3.1. Methods
3.1.1. Subjects
Five volunteers (2 male, 3 female; 4 Caucasian, 1 Asian, 1 Middle-Eastern)
agreed to be video-recorded for the current experiment.
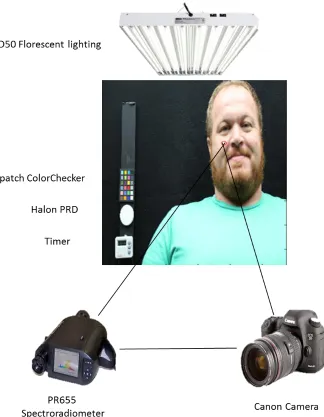
3.1.2. Apparatus
Subjects were seated in room with no natural lighting, facing a PR655
Spectroradiometer and a Canon 5D Mark III digital camera with 24-105mm lens. D50
fluorescent was used as overhead lighting. The spectroradiometer and camera were
situated approximately 25 cm apart, at eye-level to the subject, and had roughly equal
measurement distance to the target (approx. 60 cm). A 24-patch X-rite ColorChecker
was included the frame in order to estimate the camera model. A halon PRD was
included to measure the radiance of the source lighting. A digital timer was included
to synchronize video data with spectral measurements. A black cloth was placed in
the background to reduce extraneous reflection. See Figure 3-1 for an illustration of
the apparatus. See Figure 3-2 for the spectral radiance of the source illuminant. See
Figure 3-1: Example illustration of the experimental apparatus.
Figure 3-2: Normalized radiance of the source illuminant, measured by a PR655 spectroradiometer.
[image:23.612.192.415.393.650.2]3.1.3. Procedure
For each session, subjects were told that their faces would be video-recorded.
They were instructed to remain still and to breathe regularly during the recording,
but were otherwise given no further instructions.
Once the subject was ready to begin, the digital timer was started and the
camera began recording at 30 frames per second. While the camera was recording,
the experimenter took 4 measurements using the spectroradiometer, each
approximately 20 seconds apart. The experimenter recorded the timestamp from the
digital timer for each measurement. The video was saved as a MOV file.
3.1.4. Measured Reflectance Spectra
Before recording, the spectroradiometer was focused on the Halon PRD to
measure the radiance of the source illuminant. Following this measurement, the
spectroradiometer was focused on the subject’s cheek for the remainder of the
session. Each spectroradiometer measurement provided the radiance of the skin. The
spectral reflectance of the skin was derived by dividing the skin measurement by the
source measurement.
3.1.5. Estimated reflectance spectra
Still-frames corresponding to the timestamp of each spectroradiometer
measurement were read from the camera recording and were saved as TIF files
(dimensions 1080 x 1920). The functionality of ColourWorker (see section 2.2) was
used to computationally estimate the reflectance spectra of the cheek area for each
frame. In some cases, specular highlights in this area caused excessive noise that
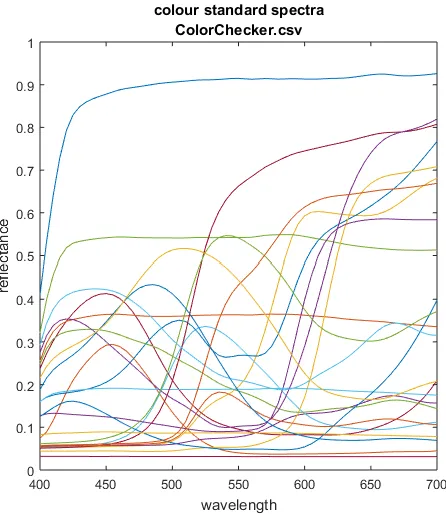
adjusted. This method involves two primary steps. First, it accounts for variation in
illumination and camera response sensitivities by incorporating the measured
reflectance spectra of an in-frame color standard (a 24-patch X-Rite Macbeth
ColorChecker). Second, it uses a set of target-relevant reference spectra (in this case,
skin reflectance) and linear modeling to estimate the specific spectrum likely to have
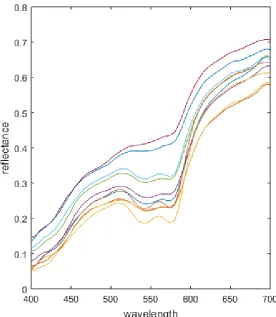
been produced by the RGB camera signal. The reference spectra used in the current
experiment were measured spectral reflectance curves from the back of a human
(Caucasian) hand during blanching, caused by applying surface pressure. See Figure
3-4 for the reference spectra used in the current experiment. Additionally, it was
found that applying an additive scaling factor of 0.095 slightly improved the fit of the
results (This value was derived post hoc from the average distance between measured
Figure 3-4: Reference spectra used in Experiment 1. Measured spectral reflectance curves from the back of a human hand during blanching caused by applying surface pressure.
[image:26.612.165.441.78.395.2]3.2. Results and Discussion
3.2.1. Results
1.1 1.2
1.3 1.4
[image:28.612.95.523.70.644.2]1.5
Table 3-1: Correlation (r) and root-mean-square-error (RMSE) for each subject’s estimated versus
measured reflectance.
Subject r RMSE
1.1 0.9979 0.0419
1.2 0.9962 0.1533
1.3 0.9946 0.0962
1.4 0.9943 0.0684
1.5 0.999 0.1420
[image:29.612.94.519.149.253.2]Mean 0.9964 0.10036
[image:29.612.92.523.315.570.2]Figure 3-7. Mean+/-SD of a* error between measured and estimated colorimetric data for each of 5 subjects.
Table 3-2. CIELAB values for each subject’s estimated versus measured colorimetric data.
Subject L*meas L*est a*meas a*est b*meas b*est Δ L* Δ a* Δ b* Δ E*
1.1 66.09 61.73 16.76 19.17 23.05 22.35 4.36 2.41 0.71 5.03
1.2 75.40 57.48 15.95 14.29 25.13 21.04 17.93 1.66 4.09 18.47
1.3 75.45 60.54 17.94 26.52 25.38 25.22 14.91 8.57 0.16 17.20
1.4 76.73 67.75 21.11 17.85 22.47 20.08 8.98 3.26 2.39 9.85
1.5 78.97 63.42 18.57 22.07 22.72 23.45 15.55 3.50 0.73 15.96
Mean 12.35 3.88 1.62 13.05
3.2.2 Discussion
The results revealed some inconsistency between the estimated and measured
reflectance spectra. The most obvious source of error is in the scaling of the estimated
data. This error was attenuated by uniformly applying an additive scaling factor to
the data (0.095), but a large scaling difference was still evident (see Table 3-1; RMSE
= .10). This difference was also evident in the comparison between estimated and
measured CIELAB L* values (See Table 3-2; Δ L*mean = 12.35). However, the estimation
of the reflectance curve shape performed better (see Table 3-1; r = .996), as did the
estimation of CIELAB a* and b* values (See Table 3-2; Δ a*mean = 3.88; Δ b*mean = 1.62).
A potential and likely source of error was the set of reference spectra used.
Since the linear modeling involved in the functionality of ColourWorker involves
constraining the estimated reflectance to match the patterns of the reference spectra,
it is clear that the choice of input reference spectra is critical to estimate variation in
observed reflectance spectra. The reference spectra used in the current experiment
were generated by applying pressure to the skin and measuring the resulting spectra
due to changes in hemoglobin properties under the skin site. However, skin
reflectance is largely influenced by melanin content as well as hemoglobin. Further,
primarily to differences in melanin content. Therefore, it is reasonable to assume that
estimates of skin reflectance for the current sample could be improved by instead
utilizing reference spectra that incorporate changes in melanin content.
4. Experiment 2
Experiment 2 aimed to demonstrate the ability of ColourWorker to reliably
estimate changes in the reflectance spectra of human skin that are due to changes in
blood flow. The functionality of ColourWorker was used to generate estimates of skin
reflectance from subjects at three physiological events related to changes in blood
flow: baseline, occlusion, and hyperaemia. These estimates were compared to
ground-truth measurements of skin reflectance taken simultaneously.
4.1. Methods
4.1.1. Subjects
Six additional volunteers (3 male, 3 female; Caucasian) agreed to be
video-recorded for the current experiment.
4.1.2. Apparatus
Subjects were seated in a room with no natural lighting, and placed their hand
face-down on a flat table. The same PR655 Spectroradiometer and Canon camera
were used in the current experiment. D50 fluorescent lighting was used as overhead
lighting. The spectroradiometer and camera were situated approximately 25 cm
apart, approximately 40 cm above the subject’s hand, and had roughly equal
measurement distance to the target (approx. 40 cm). A 24-patch X-rite ColorChecker
included to measure the radiance of the source lighting. A digital timer was included
to synchronize video data with spectral measurements. A black board was placed on
the table top to reduce extraneous reflection. See Figure 4-1 for an illustration of the
apparatus. The spectral reflectance of the ColorChecker patches and spectral radiance
of the illuminant were the same as in Experiment 1. To manipulate the blood flow to
4.1.3. Procedure
For each session, subjects were told that their hands would be video-recorded.
They were instructed to remain still and to breathe regularly during the recording.
Additionally, they were briefed on how the blood pressure cuff would be used. Prior
to recording, the subject’s systolic blood pressure was measured from the arm of the
subject (that was not recorded). After this measurement, the subject was informed
that the cuff would be inflated for approximately 4 minutes during the course of the
recording, in order to temporarily occlude blood flow to the hand. The subject was
told that they would have full control over the cuff’s manual air-release valve after
the cuff was inflated, so that they could release the pressure in the event that the
occlusion became uncomfortable. The subject was then shown how the cuff and
release valve worked. No subject felt it necessary to use the valve during the
experiment, and none reported more than minor discomfort.
Once the subject was ready to begin, the digital timer was started and the
camera began recording at 30 frames per second. The blood pressure cuff was used
to alter the blood flow to the subject’s arm, using a method similar to Zonios et al.,
(2001). After approximately 10 seconds, the blood pressure cuff was inflated to a
pressure 50 mmHg higher than the subject’s resting systolic arterial pressure. This
pressure was maintained for 4 minutes in order to occlude blood flow to the hand.
After 4 minutes, the pressure was released. While the camera was recording, the
experimenter took 3 measurements using the spectroradiometer, corresponding to
three specific physiological events: baseline (at approx. 5s), occlusion (at approx.
hemodynamics involved during the time course of the experiment. The experimenter
recorded the timestamp from the digital timer for each measurement. The video was
saved as a MOV file.
[image:36.612.92.523.218.541.2]4.1.4. Measured Reflectance Spectra
Before recording, the spectroradiometer was focused on the Halon PRD to
measure the radiance of the source illuminant. Following this measurement, the
spectroradiometer was focused on the back of the subject’s hand (between the thumb
and first finger) for the remainder of the session. The measurements were made at
the time points described above. Each spectroradiometer measurement provided the
radiance of the skin. The spectral reflectance of the skin was derived by dividing the
skin measurement from the source measurement.
4.1.5. Estimated Reflectance Spectra
Still-frames corresponding to the timestamp of each spectroradiometer
measurement were read from the camera recording and were saved as TIF files
(dimensions 1080 x 1920). The functionality of ColourWorker (see section 2.2) was
used to computationally estimate the reflectance spectra of the skin area for each
frame, in a similar way as in Experiment 1. In some cases, specular highlights in this
area caused excessive noise that prevented reliable reflectance estimation, so the
sampled location was slightly adjusted. However, for this experiment, a different set
of reference spectra, which reflected the dynamic changes in skin blood flow over
time, were used. The reference spectra used in the current experiment were the
average measured spectral reflectance curves from the back of 3 human (Caucasian)
hands undergoing the same blood pressure cuff manipulation as described above. See
Figure 4-3: Reference spectra used in Experiment 2. Average measured spectral reflectance curves from the back of 3 human hands taken during the baseline, occlusion, and hyperaemia periods of the
blood pressure cuff manipulation. The characteristic ‘W’ shape of skin reflectance (~525-575 nm), which is due to the absorption properties of oxyhemoglobin in this range, is noticeable during baseline.
The ‘W’ shape is lost during occlusion (because of the decrease of oxyhemoblin), but is accentuated
during hyperaemia (because of the substantial increase of oxyhemoglobin).
[image:38.612.108.502.77.470.2]4.2. Results and Discussion
4.2.1. Results
For each frame, the back of the hand was sampled and a reflectance estimate
was created for each pixel in a 10-pixel radius of the sampled area. The mean and
standard deviation of the estimated reflectance spectra were calculated for each of
the frames corresponding to the 3 physiological states sampled during the session
(see Figures 4-4 to 4-6). The estimated reflectance spectra data were compared to the
mean and standard deviation of the PR655-measured reflectance data for each
subject using Pearson’s correlation (r) and root-mean-squared-error (see Table 4-1).
Additionally, CIELAB L*, a*, and b* values, corresponding to Lightness, redness, and
yellowness, respectively, were calculated for measured and estimated data (see Table
4-2, Figures 4-7 to 4-9). Finally, because the current experiment was primarily
interested in the estimation of skin color changes over time, CIELAB ΔL*, Δa* and Δb*
values (reflecting changes in skin color across physiological states) were calculated
Figure 4-4: Estimated reflectance spectra (M+/-SD) against Measured reflectance spectra (M+/-SD) for all subjects during baseline measurement. For both measured and estimated reflectance spectra, the
Figure 4-5: Estimated reflectance spectra (M+/-SD) against Measured reflectance spectra (M+/-SD) for all subjects during occlusion measurement. For both measured and estimated reflectance spectra, the
Figure 4-6: Estimated reflectance spectra (M+/-SD) against Measured reflectance spectra (M+/-SD) for all subjects during hyperaemia measurement. For both measured and estimated reflectance spectra,
the ‘W’ shape is accentuated during hyperaemia because of the substantial increase of oxyhemoglobin.
Table 4-1: Correlation (r) and root-mean-square-error (RMSE) for the estimated versus measured reflectance at each physiological state.
r RMSE
Baseline 0.9992 0.012
Occlusion 0.9986 0.004
Hyperaemia 0.9996 0.006
[image:42.612.94.520.551.626.2]CIELAB L*
CIELAB a*
[image:43.612.140.472.65.672.2]CIELAB b*
Figure 4-7: Mean+/-SD of CIELAB values. Difference between measured and estimated colorimetric data for each of 6 subjects at baseline.
0.00 10.00 20.00 30.00 40.00 50.00 60.00 70.00
1 2 3 4 5 6
Baseline
Measured L* Estimated L*
0.00 5.00 10.00 15.00 20.00 25.00
1 2 3 4 5 6
Baseline
Measured a* Estimated a*
0.00 5.00 10.00 15.00 20.00 25.00 30.00
1 2 3 4 5 6
Baseline
CIELAB L*
CIELAB a*
[image:44.612.139.471.67.674.2]CIELAB b*
Figure 4-8: Mean+/-SD of CIELAB values. Difference between measured and estimated colorimetric data for each of 6 subjects at occlusion.
0.00 10.00 20.00 30.00 40.00 50.00 60.00 70.00
1 2 3 4 5 6
Occlusion
Measured L* Estimated L*
0.00 5.00 10.00 15.00 20.00
1 2 3 4 5 6
Occlusion
Measured a* Estimated a*
0.00 5.00 10.00 15.00 20.00 25.00 30.00
1 2 3 4 5 6
Occlusion
CIELAB L*
CIELAB a*
[image:45.612.139.471.68.654.2]CIELAB b*
Figure 4-9: Mean+/-SD of CIELAB values. Difference between measured and estimated colorimetric data for each of 6 subjects at hyperaemia.
0.00 10.00 20.00 30.00 40.00 50.00 60.00 70.00
1 2 3 4 5 6
Hyperaemia
Measured L* Estimated L*
0.00 5.00 10.00 15.00 20.00 25.00
1 2 3 4 5 6
Hyperaemia
Measured a* Estimated a*
0.00 5.00 10.00 15.00 20.00 25.00 30.00
1 2 3 4 5 6
Hyperaemia
Table 4-2: CIELAB values for each subject’s estimated versus measured colorimetric data during each
physiological state.
Subj L*meas L*est a*meas a*est b*meas b*est Δ L* Δ a* Δ b* Δ E*
Baseline 2.1 64.72 60.21 16.13 15.45 27.09 19.46 4.51 0.68 7.63 8.89
2.2 60.79 60.53 10.44 17.96 22.10 19.76 0.26 7.52 2.35 7.88
2.3 57.41 55.97 13.88 13.72 23.74 21.59 1.45 0.16 2.15 2.60
2.4 49.83 52.57 13.18 12.74 23.27 16.98 2.74 0.44 6.29 6.87
2.5 49.92 48.97 13.62 13.12 20.07 16.68 0.95 0.50 3.40 3.57
2.6 59.93 55.08 13.63 13.49 21.98 18.49 4.84 0.14 3.49 5.97
M 57.10 55.56 13.48 14.41 23.04 18.83 2.46 1.57 4.22 5.13
0.00
Occlusion 2.1 63.21 58.38 15.13 13.35 24.05 14.77 4.83 1.78 9.27 10.60
2.2 59.32 61.75 9.60 7.79 20.84 18.10 2.43 1.82 2.73 4.08
2.3 53.28 58.95 13.40 13.61 19.96 19.57 5.67 0.21 0.39 5.69
2.4 48.67 53.93 12.15 9.59 21.60 18.33 5.26 2.55 3.26 6.69
2.5 45.23 45.79 12.81 11.58 16.80 12.88 0.57 1.23 3.93 4.16
2.6 56.81 49.93 13.07 12.32 18.81 13.69 6.88 0.76 5.12 8.61
M 54.42 54.79 12.69 11.37 20.34 16.22 4.27 1.39 4.12 6.09
0.00
Hyperaemia 2.1 63.83 60.53 20.20 17.96 26.76 19.76 3.30 2.24 7.00 8.06
2.2 57.32 59.60 16.25 17.88 21.62 20.36 2.28 1.62 1.26 3.07
2.3 53.84 54.93 19.01 21.01 22.29 21.67 1.09 2.00 0.62 2.36
2.4 48.19 52.89 15.78 15.06 22.47 18.99 4.70 0.72 3.48 5.89
2.5 46.28 46.03 16.62 16.76 19.37 15.30 0.25 0.14 4.07 4.08
2.6 55.68 51.84 20.29 20.11 20.84 17.99 3.84 0.18 2.85 4.79
M 54.19 54.30 18.03 18.13 22.22 19.01 2.58 1.15 3.21 4.28
8.89
M 3.10 1.37 3.85 5.13
[image:46.612.91.574.125.677.2]For both measured and estimated data, skin redness (a*) decreases from baseline to occlusion, and then increases from occlusion to hyperaemia.
[image:47.612.125.489.90.310.2]For both measured and estimated data, skin yellowness (b*) decreases from baseline to occlusion, and then increases from occlusion to hyperaemia.
Table 4-3: Pairwise comparisons of measured vs. estimated changes in CIELAB values across physiological states.
Meas
ΔL* Est ΔL* ΔL* (error) Meas Δa* Δa* Est Δa* (error) Meas Δb* Est Δb* Δb* (error)
baseline occlusion 2.68 0.77 1.91 0.79 3.04 2.25 2.7 2.61 0.09
hyperaemia 2.91 1.26 1.65 4.55 3.72 0.83 0.82 0.18 0.64
occlusion hyperamia 0.23 0.49 0.26 5.34 6.76 1.42 1.88 2.79 0.91
Mean 1.27 1.50 0.55
4.2.2. Discussion
The results revealed high consistency between the estimated and measured
reflectance spectra. The curve shapes and absolute reflectance values show good fit
at each physiological state (see Table 4-1; RMSEbaseline = 0.012, rbaseline > 0.99;
RMSEocclusion = 0.004, rocclusion > 0.99 ; RMSEhyperaemia = 0.006, rhyperaemia > 0.99). The
comparison between estimated and measured CIELAB L* values also showed a good
(see Table 4-2; Δ L*mean= 3.10; Δ a*mean= 1.37; Δ b*mean = 3.85). Finally, the results
showed that the estimated data were able to reliably predict changes in skin color
across the three physiological states (see Table 4-3; MΔL*error = 1.27; MΔa*error = 1.50;
MΔb*error = 0.55).
5. Summary, Conclusions, and Future Directions
improvement in estimating reflectance and colorimetric values with high accuracy. These results support the notion that performance with spectral estimation methods is positively related to the similarity of the reference data to the test data (Li et al., 2003). Further, the results show that the ColourWorker method can reliably capture changes in skin color and reflectance that are due to changes in blood flow characteristic of physiological states.
Given the results of the current work, the ColourWorker methodology is a promising tool for investigating skin color and spectral reflectance changes over time, which can be used to extract physiological parameters such as melanin and hemoglobin properties. Future work should aim to incorporate more comprehensive reference spectra databases in order to improve the results. Future work should additionally test whether the methodology has good performance in estimating changes in skin reflectance when the physiological changes are more subtle and ecologically valid (e.g., during varying, naturally occurring, emotional states), rather than manipulated with a blood pressure cuff.
6. References
(Anderson et al., 2015)
Anderson, J. C., Hallam, M.-J., Nduka, C., & Osorio, D. (2015). The challenge of objective scar colour assessment in a clinical setting: using digital photography. Journal of Wound Care, 24(8), 379–87.
(Berns, 2000)
Berns, R. S. (2000). Billmeyer and Saltzman's principles of color technology. New York: Wiley.
(Burriss et al., 2015)
Burriss, R. P., Troscianko, J., Lovell, P. G., Fulford, A. J. C., Stevens, M., Quigley, R., … Rowland, H. M. (2015). Changes in Women’s Facial Skin Color over the Ovulatory Cycle are Not Detectable by the Human Visual System. Plos One,
(Changizi & Rio, 2010)
Changizi, M., & Rio, K. (2010). Harnessing color vision for visual oximetry in central cyanosis. Medical Hypotheses, 74, 87–91.
(Changizi et al., 2006)
Changizi, M., Zhang, Q., & Shimojo, S. (2006). Bare skin, blood and the evolution of primate colour vision. Biology Letters, 2(2), 217–21.
(Charkoudian et al., 1999)
Charkoudian, N., Stephens, D. P., Pirkle, K. C., Kosiba, W. A., & Johnson, J. M. (1999). Influence of female reproductive hormones on local thermal control of skin blood flow. Journal of Applied Physiology, 87(5), 1719–1723.
(Chiao et al., 2000)
Chiao, C. C., Osorio, D., Vorobyev, M., & Cronin, T. W. (2000). Characterization of natural illuminants in forests and the use of digital video data to reconstruct illuminant spectra. Journal of the Optical Society of America. A, Optics, Image Science, and Vision, 17(10), 1713–1721.
(Drummond, 1994)
Drummond, P. (1994). The effect of anger and pleasure on facial blood flow. Australian Journal of Psychology, 46(2), 95–99.
(Gegenfurtner & Kiper, 2003)
(Goldstein et al., 2004)
Goldstein, E. B., Humphreys, G. W., Shiffrar, M., & Yost, W. A. (2004). Blackwell handbook of sensation and perception. John Wiley & Sons.
(Hsu, 2002)
Hsu, R. (2002). Face detection in color images. IEEE Transactions on Pattern Analysis
and Machine Intelligence, 24(5), 1–23. http://doi.org/10.1109/34.1000242
(Imai & Berns, 1999)
Imai, F. H., & Berns, R. S. (1999). Spectral estimation using trichromatic digital cameras. Proceedings of the International Symposium on Multispectral Imaging and Color Reproduction for Digital Archives, 42, 42–49.
(Johnson, 1998)
Johnson, J. M. (1998). Physical training and the control of skin blood flow. Medicine and Science in Sports and Exercise, 30(3), 382–386.
(Kikuchi et al., 2013)
Kikuchi, Masuda, & Hirao (2013). Imaging of hemoglobin oxygen saturation ratio in the face by spectral camera and its application to evaluate dark circles. Skin
Research and Technology, 19(4), 499–507.
(Li et al., 2003)
Li, C., Cui, G., & Luo, M. R. (2003). The accuracy of polynomial models for characterising digital cameras. Proc. AIC Interim. Meet, 166-170.
(Nishidate et al., 2004)
Nishidate, I., Aizu, Y., & Mishina, H. (2004). Estimation of melanin and hemoglobin in skin tissue using multiple regression analysis aided by Monte Carlo simulation. Journal of Biomedical Optics, 9(4), 700–710.
(Piérard, 1998)
Piérard, G. . E. (1998). EEMCO guidance for the assessment of skin colour. Journal of
the European Academy of Dermatology and Venereology : JEADV, 10(1), 1–11.
(Re et al., 2011)
Re, D. E., Whitehead, R. D., Xiao, D., & Perrett, D. I. (2011). Oxygenated-blood colour change thresholds for perceived facial redness, health, and attractiveness. PloS One, 6(3), e17859.
(Stephen et al., 2009)
(Stephen et al., 2012)
Stephen, I. D., Oldham, F. H., Perrett, D. I., & Barton, R. a. (2012). Redness Enhances Perceived Aggression, Dominance and Attractiveness in Men’s Faces. Evolutionary Psychology, 10(3), 562–572.
(Sun & Fairchild, 2002)
Sun, Q., & Fairchild, M. D. (2002). Statistical Characterization of Face Spectral Reflectances and Its Application to Human Portraiture Spectral Estimation. Journal of Imaging Science and Technology, 46(6), 498–506.
(Yip & Sinha, 2002)
Yip, A. W., & Sinha, P. (2002). Contribution of color to face recognition. Perception, 31(8), 995–1003.
(Young et al., 2016)
Young, S. G., Thorstenson, C. A., & Pazda, A. D. (2016). Facial redness, expression, and masculinity influence perceptions of anger and health. Cognition and Emotion, 1-12.
(Zhang et al., 2017)
Zhang, X., Wang, Q., Li, J., Zhou, X., Yang, Y., & Xu, H. (2017). Estimating spectral reflectance from camera responses based on CIE XYZ tristimulus values under multi-illuminants. Color Research & Application, 42(1), 68–77.
(Zonios et al., 2001)