Practical and Visual Aids in Teaching Basic Mathematics Principles
MEHRYAR NOORIAFSHAR
University of Southern Queensland, Toowoomba, Australia [email protected]
Abstract
This paper presents procedures and findings of an experiment on teaching basic mathematics concepts to Business undergraduate students by employing very practical aids. The main objectives of this experiment were to provide the students with skills and abilities to:
1. identify and formulate an appropriate model (linear or non-linear) by viewing the scatterdiagram for forecasting purposes; and
2. plot straight lines represented by the constraints and objective function of two-variable Linear Programming models for optimization purposes.
The equipment used included basic scientific calculators, protractors and a flexi-curve. This experiment was based on the idea of guiding the students towards finding the answers instead of simply giving them the information. It also placed an emphasis on the visual aspects of teaching and learning methods. The effectiveness of the method was tested by identifying and measuring students’ performance and learning preferences; and making comparisons between students from different mathematical backgrounds. The findings of this study suggest that students, regardless of their background in mathematics, have a preference for visual methods of learning mathematical concepts. It was also demonstrated that most students who participated in the study, enjoyed learning mathematics and believed that they would benefit from it in their future studies and career.
Key words: Teaching Mathematics, Basic Principles, Practical, Visual
Introduction
A group of twenty first-year undergraduate students were selected for the purposes of an experiment on the effectiveness of teaching basic mathematics concepts via practical teaching aids. These students were from different mathematical backgrounds and the majority did not have a very strong background in quantitative fields.
The Experiment
The meaning of dependency of one variable on another was explained via an analogy. This analogy was deliberately chosen in such a way that most students could relate to it. It was based on the idea of how performance in a sporting activity can change (increase) as the amount of time/effort spent on training increases. A polynomial equation of the first degree (straight line) was written down on the board. This equation was then broken down into a number of main components. These included the coefficient of the variable with the highest power; the sign and the magnitude of this coefficient, the sign and the value of the constant term in the equation. It was explained to the students that the highest power of the variable on the right hand side is an indicator of the number of bends (humps) on the curve. It was explained that this value is achieved by subtracting one (1) from the number of bends. For instance in the case of a polynomial of the first degree (such as y = x 1), if we subtract one (1) from the highest power of the independent variable (one in this case), we would get zero. Hence, our curve will have zero bends. And we all know that a curve with no bends (humps) is a straight line. This finding was then related to a visual example represented by the flexi curve. The dependent and independent axes were displayed on the whiteboard. The flexi-curve was straightened and placed on the axes. It was then rotated in different directions to demonstrate that our line can have different slopes which may be positive (growth) or negative (decay).
In order to help with remembering, the analogy of writing a description of a holiday (on the back of a post card) versus showing or sending images (photographs) was used. It was also explained that the latter is a pictorial (graphical) representation of the former. Hence, a pictorial (graphical) approach may also be adopted to illustrate a mathematical relationship such as the sports performance and training. In other words, the equation is like the description on the postcard and the graph is similar to the photograph.
At this stage, students were asked to work out TAN -1of one (the coefficient of the explanatory variable in y = 1 x 1) on their calculators. And they all reported that they had 45 degrees. So, they realized that our line was a straight line which went through the origin and made a 45 degrees angle with the horizontal axis. A protractor was used to mark 45 degrees on the axes. The straightened flexi-curve was held against the whiteboard on the axes in such a way that it passed through the origin and made a 45 degrees angle with the horizontal axis. They were then asked to think about changing the angle by increasing the coefficient from one (1) to, for example, two (2). When they re-calculated the angle, they realized that it was just over 63 degrees (larger than 45 degrees). So a pattern started to emerge which suggested that further increases would also increase the angle. This was confirmed by trying different values. Students were asked to decrease the value from one (1) to, for example, 0.5. This decrease resulted in a smaller angle (about 26.5 degrees). Hence, the students could see how the rotation of the flexi-curve on the whiteboard was causing changes in the value of the coefficient of the independent (explanatory) variable.
and the curve, the flexi-curve was turned upside down. To demonstrate the relationships between the graph and the equation, the ends of the flexi-curve were pulled out to open the up the curve. Therefore, the students were able to see the same ideas as with a straight line. The students were also asked to re-consider how learning a sporting activity relates to the amount of time or effort spent. They were encouraged to predict what would eventually happen to performance if the amount of effort (time) spent kept increasing. For example, would performance keep going up as more effort (time) was spent? Most of the students replied that it could not keep on increasing. This finding by students was a result of a guided or constructivist approach and paved the way for introducing logarithmic models.
Let us take a brief look at this way of learning before we proceed any further. Constructivist approach to learning encourages the learner to construct their own meanings rather than simply memorizing someone else’s. It should be remembered that the general concept of “constructivism” is quite simple and practical and the underlying theory, perhaps, goes back to the Socratic times. The concept of guiding and leading the learner to find out the solution or the right answer to a problem was discussed by Plato (the ancient scholar) almost 2400 years ago. If we analyse Plato’s famous “dialogue” Meno, we will realise that Socrates demonstrates to Meno how a mathematically ignorant person solves a geometrical problem through a controlled guidance procedure rather than being told directly. For an appropriate definition of learning under constructivism see Bruner (n.d.) who considers learning as an active process in which the new ideas or concepts are constructed based on the existing ones. Teaching mathematics thematically which is also based on constructivist ideas is reported by Handal and Bobis (2003).
Next, the good old flexi-curve was shaped as a typical logarithmic curve and placed on the axes on the whiteboard. So, the students could see how the curve starts to level off towards the end of the curve. This would indicate that only a very small or no increase in performance could occur as the effort (time) spent increased.
Finally, the exponential growth was introduced as the reverse of logarithmic models in which the leveling off occurs at the beginning. Natural phenomena such as population growth were used as examples. The flexi-curve was again used to demonstrate the idea on the axes.
Analysis of Results
In order to determine the effectives of the visual method of teaching the basic concepts, a specially designed instrument was used. The main purpose was to collect information on the following:
• Part A:
1. students’ background;
2. students’ perceptions and preferences for learning styles; and
• Part B:
A very small number (only one) of students indicated that they did not have a strong background in mathematics and a preference for text in learning materials. A much larger proportion (nine) of students reported that they had a strong background in mathematics with a preference for visual features in learning materials. See Table 1.
Table 1 – Mathematics background and modal preferences of students
Modal Preference Mathematics
Background Text Visual
Not Very Strong 1 5
Strong 5 9
Hence, there is definitely a preference for visual features regardless of the students’ background. To confirm this finding, a Chi-Square hypothesis test was carried out as follows:
• H0 : There is no relationship between students’ background in mathematics and their learning modal preference.
• H1 : There is a relationship between students’ background in mathematics and their learning modal preference.
• The Test Statistic of 0.724 falls outside the Critical Region (Tabulated Chi-Square value of 3.84 with 1 degree of freedom and 5% level of significance). Hence, the null hypothesis is not rejected. It is concluded that there is no relationship between students’ background in mathematics and their learning modal preference.
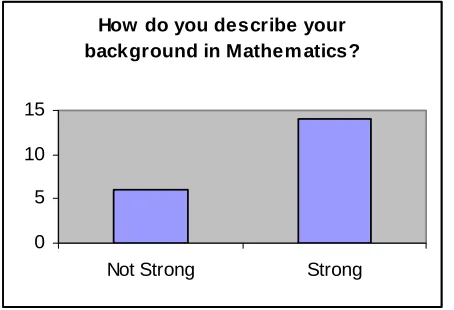
Most of the students who participated in the experiment reported that they had a strong background in mathematics. It must be emphasized that this perception is relative as these students were mainly Business (and not mathematics) undergraduate students. See Figure 1.
How do you describe your background in Mathem atics?
0 5 10 15
Not Strong Strong
Figure 1 – Students’ Background in Mathematics
[image:4.595.186.413.511.666.2]How do you rate your level of enjoying learning m athem atical topics such as those presented to
you?
0 5 10 15
[image:5.595.186.412.74.233.2]Low Average High
Figure 2 – Students’ Level of Enjoyment of Learning Mathematics
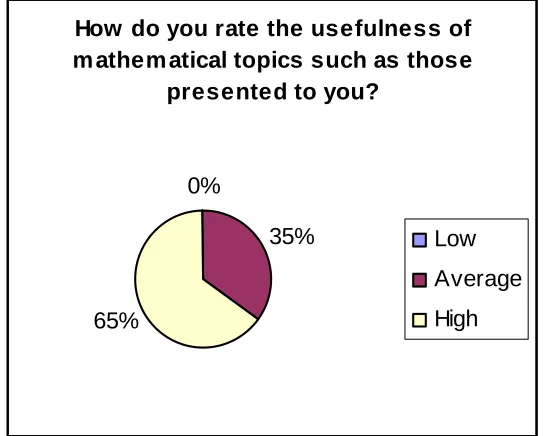
As Figure 3 shows all of the students have rated the usefulness of a mathematical subject in their future studies and career either as High (65%) or Average (35%). This finding demonstrates that students held high respect for mathematics and its applications.
How do you rate the usefulness of m athem atical topics such as those
presented to you?
0%
35%
65%
Low
Average
High
Figure 3 – Students’ Perception of Usefulness of Mathematics
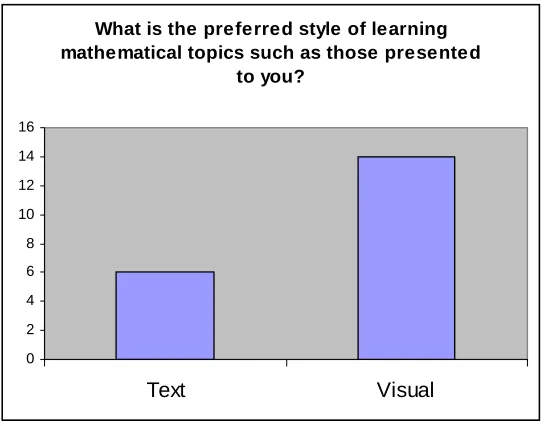
[image:5.595.161.433.326.544.2]What is the preferred style of learning mathematical topics such as those presented
to you?
0 2 4 6 8 10 12 14 16
[image:6.595.169.441.73.286.2]Text Visual
Figure 4 – Students’ Preference for Learning Styles
For Part B, about 10 students were selected randomly and then were tested on the concepts provided to them. The performance of these students was quite satisfactory. The marks considered by the author ranged between 70% and 95%. This was achieved by asking students different questions based on the materials presented to them.
Conclusions
The majority of the students who participated in the study reported in this paper have indicated their preference for visual features. Theses features represent mathematical concepts, relationships and patterns which were demonstrated to them visually. Most of the students rate the usefulness of mathematical subjects such as those presented in the experiment as high in their future studies and profession. It should be noted that most of the students who participated in this study regard learning mathematical topics enjoyable.
Finally, it should be noted that methods of teaching quantitative subjects have certainly been influenced by modern computing (multimedia and online). They will change even more dramatically in the years to come. One thing however remains the same; and that is the ability of the teacher to convey the underlying concepts to the learner. This can even be achieved by using traditional and very practical aids such as a flexi-curve. The main purpose is to make it possible for the learner to build new meanings without simply memorizing pieces of information received from the teacher.
References
Funderstanding: Right Brain vs. Left Brain (n.d.) Retrieved August 11, 2004 from http://www.funderstanding.com/constructivism.cfm
Handal B. and Bobis J. (2003), "Instructional Styles in the Teaching of
Mathematics Thematically ", International Journal for Mathematics Teaching and Learning, October Issue.
Nooriafshar M. and Todhunter B. (2004), "Designing a Web Enhanced
Multimedia Learning Environment (WEMLE) for Project Management ", Journal of Interactive Learning Research (JILR), (2004) 15(1), 33-41.