*■*■*
• *
+ * *
T h e m e 2
Economy and finance Series Β
Short-term statistics
ISSN 1024-4239
eurostat
ECU-EMS Information
& Central Bank Interest Rates
7 □ 1998
Monthly
Bilateral fluctuations of the ERM currencies
Graph 1 on page 5 shows the bilateral fluctuations in the ERM currencies between 4 May 1998 and 30 June 1998, calculated on a daily basis, and thus the position of each of those currencies in relation to the others.
The graph shows that the ERM has been stable over the whole of the period in question.
Since it joined the ERM on 16 March 1998, the GRD has been the strongest currency in the ERM grid. Over the past two months, it has strengthened slightly in relation to the other European currencies. Owing to the strength of the GRD, the band within which the ERM currencies were moving at the end of June 1998 widened from 5.37% (end of May) to 6.66%. In contrast, the band excluding the GRD, which had been 1.51% at the end of May, had narrowed only marginally by the end of June (1.44%),
A look at the longer-term fluctuations in bilateral rates - over the first six months of this year - shows that the band excluding the GRD has narrowed considerably. At the beginning of January, it was almost 6% and it is now under 1.5%.
Central bank interest rates
In the United Kingdom, the base rate rose by 25 bp during June and is now standing at 7.50%. This was the first time this year that the Bank of England had raised its leading rate; the previous rise being on 6 November 1997, when the base rate had been raised by 25 bp to 7.25%. The Bank of England gave as the reason for its decision the excessively high increases in private sector wages and salaries and the need to dampen domestic demand.
In Northern Europe, interest rates also changed in Norway and Sweden.
Norges Bank raised its lending rate by 25 bp to 6.50%. The last rate rise had been in May, when it had been raised by 50 bp. The Bank explained its action by pointing out that
Norwegian monetary policy was geared towards
maintaining the stability of its currency vis-à-vis the other European currencies and that the change was in response to recent developments on the foreign exchange markets.
In Sweden, on the other hand, the Central Bank lowered its repurchase rate by 25 bp to 4.10%. The previous change had been in December 1997, when the Central Bank had raised the repo rate from 4.10% to 4.35%. According to the Riksbank, this decision was taken in the light of monetary policy conclusions forecasting lower inflationary pressure than at the end of last year.
eurostat
STATISTICAL OFFICE OF THE EUROPEAN COMMUNITIES
L-2920 Luxembourg — Tél. 4301-1 —Télex COMEUR LU 3423
B-1049 Bruxelles, rue de la Loi 200 — Tél. 299 1111
Note
For any
TEL:
FAX:
information on the statistics
+352 434020-20
+352 434020-22 ou 25
+4301-32929
in this bulletin contact Luxembourg:
ASCOLI L. / SCHMITZ R.
WARTON-WOODS S. / DELOBBE O.
(Central Bank Interest Rates)
EUROSTAT
Monetary and Financial Statistics
Jean Monnet Building
APC C4/04
L-2920 Luxembourg
European Communities, 1998
Reproduction is authorized provided the source is acknowledged.
TABLE OF CONTENTS
Comments 1
European Monetary System
Table I. Central rates and intervention limit rates 4
Graph 1. Bilateral fluctuations of the ERM currencies 5
Graph 2. Divergence indicator of the ERM currencies 5
ECU exchange rates
Table II. ECU exchange rates 6
Change in the purchasing power of the ECU
Table III. Harmonised indices of consumer prices adjusted for ECU exchange rate changes 8
Table IV. Non-Harmonised indices of consumer prices adjusted for ECU exchange rate changes 10
ECU bond market
Table V. ECU bond issues 12
Table VI. Last month's ECU bond issues 12
Table VII. Outstanding amount of ECU bonds 13
Table VIII. Total of the secondary market turnover and % of market taken by ECU securities 13
ECU interest rates
Table IX. Operation rates of the EMI and interest rates and yields of ECU investments 14
Graph 3. ECU yield curve 15
Graph 4. Evolution of ECU yields 15
Central bank interest rates
Table X. Central Bank interest rates 16
Graphs Evolution of central bank interest rates over the last 12 months 19
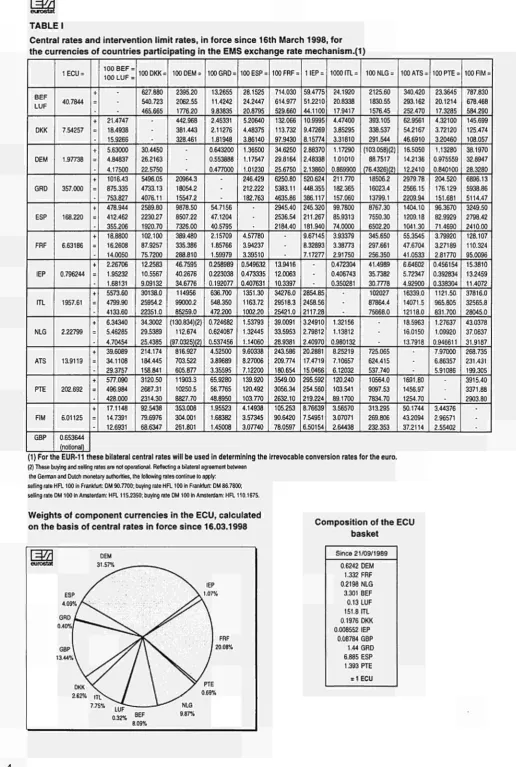
TABLE I
Central rates and intervention limit rates, in force since 16th March 1998, for the currencies of countries participating in the EMS exchange rate mechanism.(l)
BEF LUF DKK DEM GRD ESP FRF IEP ITL NLG ATS PTE FIM GBP
1 E C I U
40.7844 7.54257 1.97738 357.000 168.220 6.63186 0.796244 1957.61 2.22799 13.9119 202.692 6.01125 0.653644 (notional) + + + + + + + + + + + +
100 BEF = 100 LUF =
-21.4747 18.4938 15.9266 5.63000 4.84837 4.17500 1016.43 875.335 753.827 478.944 412.462 355.206 18.8800 16.2608 14.0050 2.26706 1.95232 1.68131 5573.60 4799.90 4133.60 6.34340 5.46285 4.70454 39.6089 34.1108 29.3757 577.090 496.984 428.000 17.1148 14.7391 12.6931
100 DKK =
627.880 540.723 465.665
-30.4450 26.2163 22.5750 5496.05 4733.13 4076.11 2589.80 2230.27 1920.70 102.100 87.9257 75.7200 12.2583 10.5567 9.09132 30138.0 25954.2 22351.0 34.3002 29.5389 25.4385 214.174 184.445 158.841 3120.50 2687.31 2314.30 92.5438 79.6976 68.6347
100 DEM =
2395.20 2062.55 1776.20 442.968 381.443 328.461
•
20964.3 18054.2 15547.2 9878.50 8507.22 7326.00 389.480 335.386 288.810 46.7595 40.2676 34.6776 114956 99000.2 85259.0 (130.834)(2) 112.674 (97.03251(2) 816.927 703.522 605.877 11903.3 10250.5 8827.70 353.008 304.001 261.801100 GRD =
13.2655 11.4242 9.83835 2.45331 2.11276 1.81948 0.643200 0.553888 0.477000
-54.7156 47.1204 40.5795 2.15709 1.85766 1.59979 0.258989 0.223038 0.192077 636.700 548.350 472.200 0.724682 0.624087 0.537456 4.52500 3.89689 3.35595 65.9280 56.7765 48.8950 1.95523 1.68382 1.45008
100 ESP =
28.1525 24.2447 20.8795 5.20640 4.48375 3.86140 1.36500 1.17547 1.01230 246.429 212.222 182.763
-4.57780 3.94237 3.39510 0.549632 0.473335 0.407631 1351.30 1163.72 1002.20 1.53793 1.32445 1.14060 9.60338 8.27006 7.12200 139.920 120.492 103.770 4.14938 3.57345 3.07740
100 FRF =
714.030 614.977 529.660 132.066 113.732 97.9430 34.6250 29.8164 25.6750 6250.80 5383.11 4635.86 2945.40 2536.54 2184.40
-13.9416 12.0063 10.3397 34276.0 29518.3 25421.0 39.0091 33.5953 28.9381 243.586 209.774 180.654 3549.00 3056.34 2632.10 105.253 90.6420 78.0597 1IEP = 59.4775 51.2210 44.1100 10.9995 9.47269 8.15774 2.88370 2.48338 2.13860 520.624 448.355 386.117 245.320 211.267 181.940 9.67145 8.32893 7.17277
-2854.85 2458.56 2117.28 3.24910 2.79812 2.40970 20.2881 17.4719 15.0466 295.592 254.560 219.224 8.76639 7.54951 6.50154
1000 ITL =
24.1920 20.8338 17.9417 4.47400 3.85295 3.31810 1.17290 1.01010 0.869900 211.770 182.365 157.060 99.7800 85.9313 74.0000 3.93379 3.38773 2.91750 0.472304 0.406743 0.350281
-1.32156 1.13812 0.980132 8.25219 7.10657 6.12032 120.240 103.541 89.1700 3.56570 3.07071 2.64438
100 NLG =
2125.60 1830.55 1576.45 393.105 338.537 291.544 (103.058)(2) 88.7517 (76.4326)(2) 18506.2 16023.4 13799.1 8767.30 7550.30 6502.20 345.650 297.661 256.350 41.4989 35.7382 30.7778 102027 87864.4 75668.0
-725.065 624.415 537.740 10564.0 9097.53 7834.70 313.295 269.806 232.353
100 ATS =
340.420 293.162 252.470 62.9561 54.2167 46.6910 16.5050 14.2136 12.2410 2979.78 2566.15 2209.94 1404.10 1209.18 1041.30 55.3545 47.6704 41.0533 6.64602 5.72347 4.92900 16339.0 14071.5 12118.0 18.5963 16.0150 13.7918
•
1691.80 1456.97 1254.70 50.1744 43.2094 37.2114100 PTE =
23.3645 20.1214 17.3285 4.32100 3.72120 3.20460 1.13280 0.975559 0.840100 204.520 176.129 151.681 96.3670 82.9929 71.4690 3.79920 3.27189 2.81770 0.456154 0.392834 0.338304 1121.50 965.805 831.700 1.27637 1.09920 0.946611 7.97000 6.86357 5.91086
-3.44376 2.96571 2.55402
100 FIM =
787.830 678.468 584.290 145.699 125.474 108.057 38.1970 32.8947 28.3280 6896.13 5938.86 5114.47 3249.50 2798.42 2410.00 128.107 110.324 95.0096 15.3810 13.2459 11.4072 37816.0 32565.8 28045.0 43.0378 37.0637 31.9187 268.735 231.431 199.305 3915.40 3371.88 2903.80
(1) For the EUR-11 these bilateral central rates will be used in determining the irrevocable conversion rates for the euro. (2) These buying and selling rates are not operational. Reflecting a bilateral agreement between
the German and Dutch monetary authorities, the following rates continue to apply: selling rate HFL 100 in Frankfurt: DM 90.7700; buying rate HFL 100 in Frankfurt: DM 86.7800; selling rate DM 100 in Amsterdam: HR 115.2350; buying rate DM 100 in Amsterdam: HFL 110.1675.
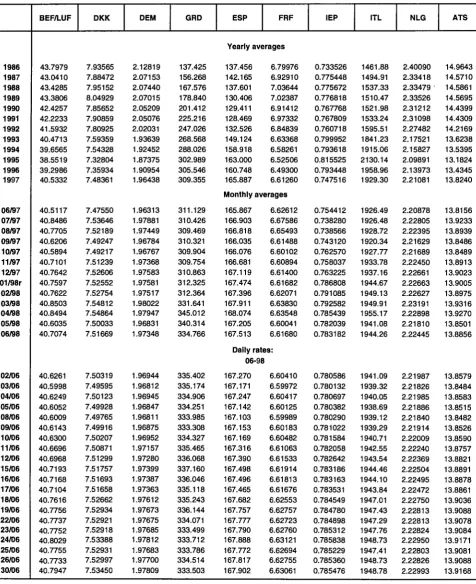
Weights of component currencies in the ECU, calculated
on the basis of central rates in force since 16.03.1998 Composition of the ECU basket
I4/H
eurostat
ESP / 4 . 0 9 % A GRD L ^ ^ 0.40%f""" GBP\ 13.44%\ DKK 2.62% DEM 31.57% ,
I T L \ ^ / 7.75% 7 <
-0.32% BEF β.09%
=Ξ
eurostat
Graph 1 : Bilateral fluctuations of the ERM currencies
7%
6%
5%
4%
3%
2%
1%
--0%
- 1 %
-2%
-3%
-4%
-5%
-6%
-7%
4-5-98 22-5-98
GRD
DEM FRF
τ 7%
6%
5%
+ 4%
3%
2%
4 - 1 %
0%
- 1 %
-2%
-3%
-4%
-5%
-6%
-7%
11-6-98 30-6-98
Graph 2: Divergence indicator
75
6045
30
--15
0
-15 +
-30
-45 +
-60
I I I I I I I I ι ι / ι i\ ι I \ I ι \ i ι \ ~ i " ι /
N l ρ \ \ DKK \ PTE /
N l£ \ DEM FRF /
BEF ATS FIM
-75 -L
4-5-98 22-5-98 11-6-98
τ 75
60
30
15
0
-15
- -30
45
- -60
30
[image:6.595.75.552.100.685.2]eurostat
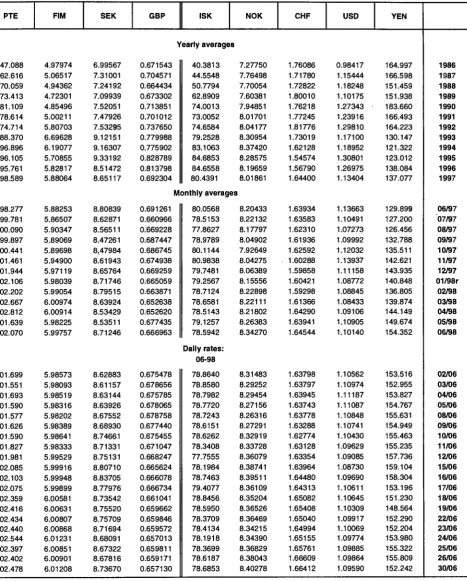
TABLE II
Ecu exchange rates
1986 1987 1988 1989 1990 1991 1992 1993 1994 1995 1996 1997 06/97 07/97 08/97 09/97 10/97 11/97 12/97 01/98Γ 02/98 03/98 04/98 05/98 06/98 02/06 03/06 04/06 05/06 08/06 09/06 10/06 11/06 12/06 15/06 16/06 17/06 18/06 19/06 22/06 23/06 24/06 25/06 26/06 30/06 BEF/LUF 43.7979 43.0410 43.4285 43.3806 42.4257 42.2233 41.5932 40.4713 39.6565 38.5519 39.2986 40.5332 40.5117 40.8486 40.7705 40.6206 40.5894 40.7101 40.7642 40.7597 40.7622 40.8503 40.8494 40.6035 40.7074 40.6261 40.5998 40.6249 40.6052 40.6009 40.6143 40.6300 40.6696 40.6968 40.7193 40.7168 40.7104 40.7616 40.7756 40.7737 40.7752 40.8029 40.7755 40.7733 40.7947 DKK 7.93565 7.88472 7.95152 8.04929 7.85652 7.90859 7.80925 7.59359 7.54328 7.32804 7.35934 7.48361 7.47550 7.53646 7.52189 7.49247 7.49217 7.51239 7.52606 7.52552 7.52754 7.54812 7.54864 7.50033 7.51669 7.50319 7.49595 7.50123 7.49928 7.49765 7.49916 7.50207 7.50871 7.51299 7.51757 7.51693 7.51658 7.52662 7.52934 7.52921 7.52918 7.53388 7.52931 7.52997 7.53450 DEM 2.12819 2.07153 2.07440 2.07015 2.05209 2.05076 2.02031 1.93639 1.92452 1.87375 1.90954 1.96438 1.96313 1.97881 1.97449 1.96784 1.96767 1.97368 1.97583 1.97581 1.97517 1.98022 1.97947 1.96831 1.97348 1.96944 1.96812 1.96945 1.96847 1.96811 1.96875 1.96952 1.97157 1.97280 1.97399 1.97387 1.97363 1.97612 1.97673 1.97675 1.97685 1.97812 1.97683 1.97700 1.97809 GRD 137.425 156.268 167.576 178.840 201.412 225.216 247.026 268.568 288.026 302.989 305.546 309.355 311.129 310.426 309.469 310.321 309.904 309.754 310.863 312.325 312.364 331.641 345.012 340.314 334.766 335.402 335.174 334.906 334.251 333.985 333.308 334.327 335.465 336.068 337.160 336.046 335.118 335.243 336.144 334.071 333.499 333.712 333.786 334.514 333.503
ESP FRF
^ a
eurostatTABLE II
Ecu exchange rates
PTE 147.088 162.616 170.059 173.413 181.109 178.614 174.714 188.370 196.896 196.105 195.761 198.589 198.277 199.781 200.090 199.897 200.441 201.461 201.944 202.106 202.202 202.667 202.812 201.639 202.070 201.699 201.551 201.693 201.590 201.577 201.626 201.590 201.827 201.981 202.085 202.103 202.075 202.359 202.416 202.434 202.440 202.544 202.397 202.402 202.478 FIM 4.97974 5.06517 4.94362 4.72301 4.85496 5.00211 5.80703 6.69628 6.19077 5.70855 5.82817 5.88064 5.88253 5.86507 5.90347 5.89069 5.89698 5.94900 5.97119 5.98039 5.99054 6.00974 6.00914 5.98225 5.99757 5.98573 5.98093 5.98519 5.98316 5.98202 5.98389 5.98641 5.98333 5.99529 5.99916 5.99948 5.99899 6.00581 6.00631 6.00807 6.00868 6.01231 6.00851 6.00901 6.01208 SEK 6.99567 7.31001 7.24192 7.09939 7.52051 7.47926 7.53295 9.12151 9.16307 9.33192 8.51472 8.65117 8.80839 8.62871 8.56511 8.47261 8.47984 8.61943 8.65764 8.71746 8.79515 8.63924 8.53429 8.53511 8.71246 8.62883 8.61157 8.63144 8.63926 8.67552 8.68930 8.74661 8.71331 8.75131 8.80710 8.83705 8.77976 8.73542 8.75520 8.75709 8.71694 8.68091 8.67322 8.67816 8.73670
GBP ISK NOK
eurostat
TABLE III
Change in the purchasing power of the ECU
(Harmonised indices of consumer prices adjusted for ECU exchange rate changes)
1996=100
1995 1996 1997
1995 01 02 03 04 05 06 07 08 09 10 11 12 1996 01
02 03 04 05 06 07 08 09 10 11 12 1997 01
02 03 04 05 06 07 08 09 10 11 12 1998 01 02 03 04 05 EUR-11 96.9«! 100.0 99.9 95.80 96.2 95.6« 95.70 96.5 96.80 97.10 97.5 97.70 97.60 98.0 98.30 98.70 99.2 99.70 100.00 100.4 100.30 100.30 100.4 100.50 100.50 100.0 100.10 100.2 99.9 99.9 99.7 100.0 99.9 99.4 99.7 100.2 100.2 100.0 100.0 99.8 100.0 99.8 100.1 100.9p EU-15 96.60 100.0 102.9 96.10 96.3 95.50 95.50 96.3 96.50 96.40 97.1 97.50 97.20 97.4 97.90 98.00 98.5 99.10 99.60 100.2 100.30 100.10 100.0 100.50 101.00 101.1 101.60 102.0 102.1 102.1 102.4 102.7 102.9 103.3 103.4 103.5 103.5 103.6 103.8 103.6 103.8 104.0 104.2 104.4p ERM* 99.80 100.0 99.9 97.60 98.5 99.40 100.10 99.9 100.10 100.30 100.0 100.10 100.30 100.5 100.60 99.80 100.1 100.40 100.40 100.2 99.90 100.10 100.2 100.10 99.90 99.6 100.10 100.2 99.9 99.9 99.7 100.0 99.9 99.4 99.7 100.2 100.2 100.0 100.0 99.8 100.0 99.8 99.9 100.7p ECU 98.50 100.0 101.8 97.10 97.6 98.20 98.60 98.5 98.70 98.60 98.6 98.90 98.90 99.0 99.10 98.90 99.3 99.80 100.00 100.1 100.10 100.00 100.0 100.30 100.50 100.5 100.70 101.0 101.2 101.3 101.4 101.7 101.8 102.0 102.2 102.2 102.2 102.4 102.4 102.2 102.6 102.7 103.0 103.3p Β 100.2 100.0 98.4 98.1 98.9 100.6 101.1 100.7 100.7 100.7 100.1 100.0 100.5 100.4 100.4 100.5 100.5 100.5 100.5 100.2 99.8 99.7 100.2 100.0 99.8 99.4 99.1 99.0 98.7 98.4 98.3 98.8 98.5 97.9 97.9 98.4 98.6 98.4 98.0 98.1 98.3 97.9 98.5 99.6 DK 98.4 100.0 100.3 95.3 96.1 96.9 98.9 99.3 99.2 98.7 98.5 99.0 99.7 99.7 99.6 99.2 99.7 100.2 100.1 99.8 99.8 99.8 100.2 100.6 100.6 100.2 99.8 99.7 99.9 100.3 100.2 101.0 100.9 99.5 99.9 100.7 100.6 100.4 100.0 100.1 100.5 100.4 100.6 101.7 D 100.7 100.0 98.6 98.3 99.5 101.4 101.6 101.3 101.4 101.4 100.4 100.3 101.0 100.6 100.7 100.4 100.8 100.6 100.1 99.9 99.9 100.3 100.7 100.0 99.5 99.0 98.7 98.8 99.0 99.0 98.5 98.9 98.8 98.3 98.6 98.7 98.6 98.2 98.3 98.3 98.6 98.1 98.4 99.4 EL 93.5 100.0 104.1 92.3 91.4 92.3 93.2 94.2 94.8 92.5 92.8 94.6 94.2 93.9 95.1 94.7 94.1 97.6 99.8 101.5 101.9 100.2 99.5 101.9 103.4 102.6 103.0 102.7 102.1 104.2 104.2 103.8 104.6 102.6 103.2 104.7 105.3 105.8 106.2 104.8 104.2 100.9 98.3 100.0 E 95.3 100.0 98.7 92.7 93.3 91.1 93.0 95.2 95.8 96.3 96.8 96.6 96.5 97.3 98.4 99.5 99.7 99.9 101.0 100.8 99.6 99.7 100.0 100.5 100.1 99.7 99.5 99.5 98.4 98.4 98.5 98.6 98.3 97.8 98.4 99.3 99.3 99.0 99.1 99.0 98.8 98.6 98.7 99.4 F 97.5 100.0 99.4 95.8 96.1 96.5 97.6 96.5 97.0 97.5 98.3 98.4 98.0 99.1 99.0 99.3 99.3 100.2 100.7 100.7 100.3 100.3 99.8 99.9 100.3 99.7 99.6 99.4 99.5 99.8 99.5 99.6 99.2 98.3 98.9 99.7 99.8 99.9 99.8 99.4 99.7 99.7 99.9 100.5 IRL 95.20 100.0 107.4 95.80 95.5 93.70 94.00 95.1 95.20 94.60 95.9 96.40 95.30 95.0 95.60 95.80 96.6 97.00 97.70 99.2 100.10 99.80 99.9 101.40 102.10 104.2 106.60 106.8 108.9 108.9 108.6 105.6 106.6 108.7 108.3 108.2 105.6 106.6 106.2 102.3 102.3 102.6 104.1 105.0 I 88.5 100.0 103.4 91.4 90.4 83.4 81.3 86.0 86.6 87.5 90.6 91.4 89.9 91.0 92.5 94.4 95.7 97.1 98.7 100.9 101.6 101.1 100.9 101.9 102.6 102.2 103.5 104.0 102.8 102.0 102.6 103.2 103.6 103.6 103.4 104.0 104.0 104.0 103.9 103.8 103.9 104.0 103.9 104.8 L 100.8 100.0 98.3 98.7 99.6 101.3 101.7 101.3 101.4 101.1 100.2 100.4 101.2 101.2 101.0 100.7 100.7 100.6 100.3 99.9 99.7 99.8 100.4 100.0 99.5 99.4 98.9 98.5 98.5 98.5 98.1 98.2 98.1 97.4 97.8 98.5 98.7 98.6 98.4 98.5 98.4 98.3 98.1 99.0
p=provisional n.a. = not available r=revised ø=estimated
TABLE III
Change in the purchasing power of the ECU
(Harmonised indices of consumer prices adjusted for ECU exchange rate changes)
1996=100 NL 100.5 100.0 98.6 98.0 99.2 101.9 102.2 101.6 101.2 100.2 99.5 100.4 101.1 100.8 100.1 99.9 100.4 101.4 101.2 100.4 99.6 99.3 99.6 100.3 99.9 99.3 98.7 98.1 98.1 99.0 98.8 99.0 98.1 97.4 97.9 99.3 99.4 99.1 98.6 98.0 98.7 99.5 100.0 100.3p A 100.2 100.0 98.3 98.2 99.0 101.1 101.1 100.8 100.8 100.6 99.8 99.8 100.4 100.2 99.9 100.6 100.8 100.9 100.3 99.7 99.9 100.1 100.3 99.8 99.4 99.3 99.1 98.5 98.8 99.0 98.5 98.6 98.3 97.5 97.8 98.1 98.2 98.2 98.3 98.4r 98.7 98.5 . 98.7 99.0p Ρ 97.0 100.0 100.5 95.7 96.5 97.2 97.3 97.1 96.6 96.6 97.5 97.2 97.2 97.4 97.2 98.3 . 98.5 98.9 100.0 99.8 99.5 100.0 100.9 101.0 101.2 101.0 100.7 101.5 101.0 101.2 101.0 101.3 100.5 99.8 100.1 100.1 99.7 99.7 99.7 99.5 99.2 99.3 100.0 101.3 FIN 101.0 100.0 100.3 98.0 98.9 100.0 100.6 101.2 101.0 101.2 102.7 102.3 102.2 102.3 101.6 100.7 99.0 98.6 97.4 98.5 99.9 100.3 101.3 101.3 101.5 100.3 100.7 100.6 100.6 100.5 100.1 99.9 100.4 100.7 100.3 100.6 100.7 99.7 99.3 99.3 99.1 99.0 99.5 100.1 S 90.7 100.0 100.2 89.9 90.0 87.8 85.9 87.8 87.5 87.3 89.4 92.4 94.3 97.5 98.1 97.1 95.4 98.6 100.6 100.9 101.8 100.8 99.8 101.4 102.9 100.8 100.0 99.6 99.0 97.6 98.4 98.3 98.4 100.2 101.1 103.5 103.5 101.6 101.2 100.1 99.1 101.2 102.8 103.1 UK 95.70 100.0 119.7 98.8 97.7 95.7 95.0 95.6 95.3 93.9 95.7 96.7 95.2 94.1 94.7 94.9 95.8 96.3 97.4 99.0 100.3 99.0 98.4 100.6 103.0 106.6 109.2 111.7 114.4 114.8 117.3 117.6 119.9 125.0 124.1 121.2 121.4 123.6 124.9 124.8 125.4 127.9 128.7 124.5 IS 97.8 100.0 107.2 97.7 98.2 97.2 97.4 97.8 97.9 97.7 98.2 98.3 98.0 97.6 97.8 97.9 98.2 98.8 99.9 100.8 100.6 99.9 100.0 100.4 101.1 100.9 101.5 102.8 104.0 104.4 105.7 106.2 107.4 109.7 110.9 109.8 108.7 107.4 108.9 110.0 110.6 111.0 111.4 110.8 Ν 98.2 100.0 104.9 96.9 97.4 98.4 97.8 98.0 98.4 98.2 98.3 99.0 99.1 98.7 98.3 97.7 98.3 98.7 99.4 99.7 100.0 100.3 99.7 100.5 101.5 101.9 102.3 106.6 108.4 107.4 105.0 103.5 102.7 102.0 102.4 104.5 106.4 105.0 104.8 104.1 103.4 104.1 104.2 103.5 CH" 100.6 100.0 95.9 96.3 97.1 100.6 101.9 100.6 100.9 100.0 99.9 101.8 102.9 102.9 102.6 102.5 101.7 102.3 101.7 100.0 99.5 99.8 101.6 100.4 99.3 96.4 94.6 93.2 93.1 93.6 94.3 95.7 96.1 96.1 97.1 97.3 97.0 98.2 98.6 98.3 99.1 97.7 96.0 96.1 US** 94.3 100.0 114.7 98.0 97.0 93.0 91.6 93.2 92.7 91.8 94.9 96.3 94.1 93.9 95.3 96.7 97.3 98.4 100.0 101.6 101.2 100.0 99.2 100.6 101.8 100.5 102.7 105.9 110.9 112.6 113.2 112.8 114.1 117.6 121.3 118.7 116.7 114.8 117.4 120.2 120.4 121.1 120.6 118.8
J P "
112.7 100.0 102.7 111.5 111.2 115.4 122.7 123.2 122.7 117.2 111.6 107.0 103.6 102.1 103.6 100.7 100.8 101.3 102.1 104.5 101.3 99.4 99.6 99.3 98.1 96.5 97.2 96.5 96.3 98.0r 98.0 103.7 108.7 110.6 111.4 106.8 104.9 99.0 97.9 100.0 102.8 101.0 98.1 94.8 1995 1996 1997 1995 01 02 03 04 05 06 07 08 09 10 11 12 1996 01 02 03 04 05 06 07 08 09 10 11 12 1997 01 02 03 04 05 06 07 08 09 10 11 12 1998 01 02 03 04 05 p=provisional n.a. " Important: This data refers to
= not available
the non-harmonised consumer price r=revised
TABLE IV
Change in the purchasing power of the ECU
(Non-harmonised indices of consumer prices adjusted for ECU exchange rate changes)
1985=100 1991 1992 1993 1994 1995 1996 1997 1995 01 02 03 04 05 06 07 08 09 10 11 12 1996 01 02 03 04 05 06 07 08 09 10 11 12 199701 02 03 04 05 06 07 08 09 10 11 12 1998 01 02 03 04 05 EU-15 124.7 128.2 128.2 131.1 132.8 138.0 142.5 132.0 132.2 130.8 130.8 132.1 132.5 132.5 133.6 134.2 133.7 134.0 134.6 135.2 135.8 136.6 137.4 138.1 138.4 138.3 138.1 138.9 139.5 139.7 140.3 141.0 141.2 141.1 141.6 142.0 142.4 143.0 143.2 143.4 143.4 143.7 143.8 143.7 144.1rp 144.2 144.6 144.9p ERM* 123.4 128.1 132.5 135.6 140.7 142.6 141.8 137.5 138.6 139.9 141.0 140.7 141.1 141.4 141.2 141.2 141.5 141.9 142.0 142.3 142.6 143.0 143.1 142.8 142.4 142.8 143.0 142.8 142.5 141.9 142.0 142.1 141.8 141.6 141.4 141.9 141.7 141.2 141.7 142.3 142.2 142.1 142.0 141.9 142.2rp 141.8r 142.0 143.1 ρ ECU 122.2 126.8 131.0 134.6 138.0 141.1 143.9 136.2 136.8 137.2 137.7 137.9 138.1 138.2 138.5 138.8 138.8 138.9 139.2 139.5 140.1 140.5 140.9 141.1 141.1 141.3 141.3 141.6 141.8 141.8 142.1 142.6 143.0 143.0 143.2 143.6 143.7 144.1 144.4 144.7 144.7 144.9 145.0 144.8 145.5rp 145.4 146.0 146.4p Β 121.9 126.7 133.8 139.8 146.0 146.1 144.0 142.8 144.1 146.5 147.3 146.5 146.6 147.0 146.1 145.6 146.4 146.5 146.2 146.9 147.1 146.9 146.4 145.4 145.2 146.2 147.1 146.3 145.7 145.3 144.8 145.1 144.6 144.1 143.4 143.7 143.6 143.5 144.0 144.0 144.1 144.0 143.7 143.7 143.9 143.4 144.0 145.6 DK 125.8 130.1 135.5 139.1 146.2 148.6 149.4 141.4 142.6 143.8 146.7 147.6 147.4 146.8 146.4 147.2 148.2 148.4 148.0 147.5 148.2 148.9 148.6 148.4 148.3 148.3 148.9 149.5 149.5 148.9 148.6 148.7 148.6 148.8 148.8 150.0 149.9 148.3 149.2 150.2 150.3 150.1 149.6 149.5 150.1 150.0 150.3 152.0 D 120.4 127.1 137.3 142.0 148.5 147.9 146.3 145.0 146.5 149.5 149.9 149.3 149.5 149.5 148.3 148.2 149.1 148.7 148.8 148.3 149.0 148.7 148.1 147.7 147.7 148.4 148.9 148.1 147.2 146.5 146.1 146.2 146.6 146.5 145.9 146.6 146.4 146.0 146.4 146.5 146.4 146.0 146.1 146.1 146.5 145.9r 146.3Γ 147.6 EL 122.9 129.9 136.7 141.3 146.8 158.0 164.7 144.4 143.1 145.1 146.6 147.8 149.2 144.8 145.1 148.9 148.8 148.1 149.2 149.0 147.8 154.1 157.9 160.3 161.6 157.9 156.8 161.6 164.2 162.2 162.4 161.8 160.6 164.7 165.1 164.2 165.8 161.9 162.7 165.9 167.4 167.7 167.8 165.2 164.0 159.9 156.0 158.6 E 145.5 149.6 139.3 136.4 139.3 146.2 144.5 135.5 136.4 133.1 135.9 139.2 140.2 140.9 141.5 141.3 141.3 142.4 143.9 145.6 145.9 146.2 147.7 147.4 145.6 145.7 146.3 146.9 146.3 145.7 145.4 145.5 144.0 143.9 144.2 144.4 143.8 143.3 143.9 145.3 145.3 145.0 145.0 145.0 144.7 144.4 144.7 145.7 F 117.1 122.1 128.7 131.8 135.4 138.8 137.9 133.0 133.5 134.1 135.4 134.1 134.8 135.5 136.5 136.6 136.0 137.5 137.4 137.9 137.8 138.9 139.7 139.7 139.2 139.3 138.4 138.6 139.1 138.3 138.1 137.9 137.9 138.3 137.9 138.1 137.6 136.3 137.1 138.2 138.5 138.5 138.4 137.9 138.3 138.2 138.5 139.5 IRL 113.0 117.6 113.6 117.0 116.8 122.1 131.4 118.3 117.1 114.4 115.6 116.7 116.6 116.7 117.8 118.1 116.9 116.3 116.8 117.8 118.0 118.0 119.6 121.1 122.0 122.5 121.9 123.1 124.7 127.2 129.5 130.3 133.0 133.0 132.6 129.2 130.4 133.1 132.8 132.6 129.5 130.8 130.3 125.6 125.6 125.9 127.7 128.7 p=provisional n.a. = not available r=revised' Greece is included in the March 1998 data
aa
TABLE IV Change in the purchasing power of the ECU (Non-harmonised Indices of consumer prices adjusted for ECU exchange rate changes)
1985=100 I 132.1 133.9 121.0 120.9 114.3 129.3 133.8 118.3 117.0 107.8 104.9 111.0 111.8 112.9 117.1 118.1 116.2 117.6 119.5 122.0 123.7 125.3 127.5 130.2 131.3 130.6 130.4 131.7 132.6 132.2 133.8 134.6 133.1 131.8 132.6 133.3 134.0 133.9 133.9 134.7 134.3 134.6 134.4 134.5 134.5 134.3 134.2 135.3 L 119.6 125.2 133.3 139.0 145.8 145.0 142.5 142.8 143.9 146.5 147.1 146.6 146.7 146.4 145.1 145.2 146.5 146.2 146.0 · 145.7 145.7 145.8 145.5 144.9 144.5 144.6 145.4 144.9 144.5 144.5 143.6 142.6 142.7 142.7 142.2 142.4 142.0 141.2 141.7 142.7 143.4 143.3 142.9 142.6 142.5 142.4 142.2 143.5 NL 117.7 123.3 132.3 137.1 143.7 143.9 142.4 139.9 141.5 145.1 145.5 144.7 144.2 143.8 142.8 143.9 144.9 144.5 143.8 143.8 144.2 145.2 144.7 143.8 142.8 143.3 143.9 144.6 144.1 143.4 142.5 142.1 142.1 142.8 142.3 142.8 141.7 141.2 141.7 143.5 143.5 143.2 142.6 142.2 145.4rp 143.7 144.0 144.5p A 124.7 131.7 142.4 147.5 154.9 154.8 152.5 150.9 152.5 156.0 156.2 155.6 155.9 156.7 156.2 154.7 155.3 154.8 154.3 154.6 155.2 155.6 154.6 153.6 154.3 155.9 157.5 155.6 154.3 153.8 153.0 152.4 152.7 153.2 152.4 152.3 152.2 152.2 153.5 152.5 152.3 152.0 151.7 152.2 152.5 152.5 152.7 153.0p Ρ 137.9 153.8 152.1 152.8 159.7 165.1 165.6 157.4 159.0 160.2 160.2 159.9 159.0 159.2 160.7 160.2 160.4 160.7 160.0 161.5 162.2 163.2 165.1 165.0 164.3 165.1 166.6 166.7 167.3 166.9 166.5 167.7 166.2 166.4 166.5 167.0 166.0 164.8 164.5 164.5 164.3 164.7 164.6 164.8 164.6 164.7 165.7 167.6 FIN 124.8 110.9 98.0 107.2 117.3 115.5 115.9 113.3 114.4 115.8 116.7 117.3 117.4 117.6 119.4 119.0 118.9 119.1 118.2 116.7 114.6 114.0 112.6 113.8 115.4 115.7 117.1 117.1 117.4 115.9 116.2 116.0 116.2 116.1 115.8 115.4 116.0 116.4 115.8 116.3 116.5 115.3 114.9 114.7 114.7 114.6 115.2 115.5 S 128.8 131.0 113.2 115.1 116.0 127.5 126.1 115.0 115.0 112.1 109.7 112.2 111.9 111.9 114.4 118.1 120.7 124.7 125.5 124.7 122.4 126.3 128.6 128.7 129.8 128.5 127.0 128.8 130.6 127.9 126.7 125.8 124.9 122.9 123.9 123.6 123.9 126.4 127.4 130.0 129.8 127.5 126.9 124.9 123.7 126.1 128.0 128.2 UK 118.5 117.2 112.2 115.6 111.9 116.9 141.7 115.2 114.1 111.5 111.1 111.8 111.6 110.0 112.1 113.2 111.2 110.0 110.6 110.7 111.9 112.3 113.8 115.6 117.1 115.9 115.0 117.5 120.5 124.6 127.8 131.1 134.5 135.0 138.3 138.7 141.7 148.2 147.3 144.1 144.5 147.1 148.7 149.2 150.2 153.3 154.9 150.1 IS n.a. 117.2 115.0 111.2 110.9 113.5 117.7 111.0 111.7 110.4 110.3 110.8 111.0 110.7 111.3 111.7 111.1 110.6 110.9 111.2 111.4 112.1 113.0 114.4 114.0 113.3 113.6 114.3 114.9 114.6 115.2 116.7 118.1 118.4 n.a. n.a. n.a. n.a. n.a. n.a. n.a. n.a. n.a. n.a. n.a. n.a. n.a. n.a. Ν 113.7 116.0 114.8 115.5 119.6 122.4 130.2 117.8 118.4 119.6 119.0 119.1 119.7 119.6 119.8 120.7 120.8 120.3 120.0 119.6 120.2 120.9 121.7 122.0 122.4 122.7 122.1 123.2 124.2 124.8 125.3 130.2 n.a. n.a. n.a. n.a. n.a. n.a. n.a. n.a. n.a. n.a. n.a. n.a. n.a. n.a. n.a. n.a. 1991 1992 1993 1994 1995 1996 1997 1995 01 02 03 04 05 06 07 08 09 10 11 12 1996 01 02 03 04 05 06 07 08 09 10 11 12 1997 01 02 03 04 05 06 07 08 09 10 11 12 1998 01 02 03 04 05 p=provisional n.a. = not available r=revised
euroetat
TABLE V
ECU bond issuesf)
(Mio ECU)
1991 1992 1993 1994 1995 199S 1997 1997 1 II III IV 1998 I 1998 03 04 05 06 TOTAL EURO 27163 19 242 6 870 6 485 5 596 3180 7 745 3295 1820 810 1820 15 930 6180 6 600 12 546 n.a. European Union Total 19 266 11675 5 020 5010 5 046 3180 6 745 3295 1670 810 970 14155 4 880 4 300 7 808 n.a. Business sector 6 581 4870 1565 1825 956 2215 3775 1745 670 710 650 7 030 1880 2 300 5 658 n.a. Govern-ments 7 900 2 475 250 1300 3075 115 1320 0 1000 0 320 5 000 1000 2 000 2150 n.a. Institu-tions 4785 4330 3 205 1885 1015 850 1650 1550 0 100 0 2125 2 000 0 0 n.a. Non-European Union Total 7897 7567 1850 1475 550 0 1000 0 150 0 850 1775 1300 2 300 4 738 n.a. Business sector 3932 3 902 250 1075 550 0 600 0 150 0 450 375 300 1250 1350 n.a. Govern-ments 3790 2 850 1600 400 0 0 400 0 0 0 400 1400 1000 750 3388 n.a. Organi-sations 175 815 0 0 0 0 0 0 0 0 0 0 0 300 0 n.a. Domestic" 3134 4151 6 508 7311 6 784 8 216 10 205 2 574 2160 3451 2 020 2 219 492 400 1237 n.a. EURO + DOMESTIC 30 297 23 393 13 378 13796 12 380 11396 17 950 5 869 3 980 4261 3 840 18149 6 672 7 000 13 783 n.a. {') Recording based on the payment date
provisional r=revised
TABLE VI
Last month's ECU bond issues
(") Only domestic Issues which can be assimilated with Eurobonds = not available
Issue Payment Date 04.06.1998 15.06.1998 04.06.1998 12.06.1998 04.06.1998 01.07.1998 05.06.1998 25.06.1998 05.06.1998 26.06.1998 08.06.1998 22.06.1998 10.06.1998 19.06.1998 10.06.1998 06.07.1998 10.06.1998 24.06.1998 11.06.1998 30.06.1998 12.06.1998 23.06.1998 16.06.1998 08.07.1998 17.06.1998 30.06.1998 18.06.1998 07.07.1998 18.06.1998 15.07.1998 22.06.1998 30.09.1998 23.06.1998 30.09.1998 23.06.1998 30.09.1998 24.06.1998 07.07.1998 24.06.1998 30.06.1998 24.06.1998 10.07.1998 30.06.1998 27.06.1998 30.06.1998 20.07.1998
Borrower & country
BEI (EO)
HELLENIC REP. OF (GB) SOCIETE GENERALE
ACCEPTANCE (FR) GENERAL ELECTRIC CAPITAL
CORPORATION (US)
LAFARGE (FR) RHEINISCHE HYPOTHEKENBANK (GE) BCH INTERNATIONAL FINANCE
(SP) PARIBAS (FR)
UNIBANK A/S (DK)
SABADELL INTERNATIONAL FINANCE (SP) REGION OF LAZIO (IT)
CCF(FR)
ASSOCIATES CORPORATION OF NORTH AMERICA (US)
IBERCAJA FINANCE (SP)
MEXICO CAPITAL PROTECTED INVESTMENT (MX)
EURO FREIGHT CAR RN (CH)
EURO FREIGHT CAR RN (CH)
EURO FREIGHT CAR RN (CH) SÜDWEST LB CAPITAL
MARKETS (GE) INTESA PREFERRED SECURITIES INVESTORS
GROUPIT) SGZ BANK (GE)
REGION ILE DE FRANCE (FR)
ALLGEMEINE HYPOTHEKENBANK AG (GE)
eurostat
TABLE VII
Outstandin
(D
31/05/98 30/04/98 31/03/98 31/12/97 31/12/96 31/12/95g amount of ECU bonds
Issuers GOV SUPRA Others Total GOV SUPRA Others Total GOV SUPRA Others Total GOV SUPRA Others Total GOV SUPRA Others Total GOV - SUPRA Others Total
Residual maturity In years <1 18 558 2 050 5 045 25 653 19 058 1950 4 590 25 598 19 058 1315 4 888 25 261 15 491 2 220 4 877 22 588 9 254 3 512 5 437 18 203 12 526 3 047 6 963 22 536 1-3 20446 6 035 9 908 36 389 20489 6 475 7 631 34 595 20489 6 460 7 383 34 332 23 349 5150 6 649 35148 30 681 4 950 8 864 44 495 25 589 5 732 9 954 41275 3-5 10440 3 615 10 065 24120 10440 3 675 6 922 21037 9 230 4 325 6 687 20 242 14 568 5 850 6 652 27 070 13 927 6 620 6 474 27 021 19 483 5150 6 099 30 732 5-7 8 013 2 000 10 276 20 289 7 513 2 000 9 276 18 789 6 592 2 000 6 693 15 285 6 592 2 000 3 698 12 290 6 929 1500 1632 10 061 10 746 4 900 4 337 19 983 7-10 19 787 2 825 3 705 26 317 15 431 2 825 3 705 21961 13 094 825 3 210 17129 11594 700 2 360 14 654 9 992 700 2 436 13128 7 468 700 1438 9 606 >10 11 175 400 1763 13 338 11000 400 1525 12 925 12718 2100 1975 16 793 4 000 100 225 4 325 4 750 600 625 5 975 4 750 600 1325 6 675
(Mio ECU)
Total 88 418 16 925 40 762 146105 83 930 17325 33 649 134 904r 81180 17 025 30 836 129 041 75 593 16 020 24 461 116 074 75 533 17 882 25 468 118 883 80 562 20129 30116 130 807 GOV = Central governments(1) June not yet available
SUPRA = Supranational institutions
TABLE VIII
Total secondary market turnover and % of market taken by ECU securities
n
1991 1992 1993 1994 1995 1996 1997 1997 1 2 3 4 5 6 7 8 9 10 11 12 1998 1 2 3 4 5 Turnover All currencies7 543 435 12 817 697 21 147 243 26 885 805 32 410 622 44 633 301 49 592103
3 949 284 3 825 231 4 062 392 3 899 815 3 559 238 4 313 629 4 498 891 3 861 874 4 417 712 4 859 602 4 256 071 4 088 364 4 308 537 4 309 370 5190 474 4 697 213
n.a.
in millions of USD
of which
ECU
1 299 480 1 795 023 1 396 407 1 760 679 2 281 559 2 040 722 2 029 361 174 392 150 546 135 394 154 051 127 621 144 345 136 725 105 739 108 832 126 777 105 222 98 239 101 144 226 590 220 900 273 557 n.a. USD
2 024 440 2471247 3 381 535 4 726177 5 718 454 8 311709 12166 646 818 577 886 764 974 487 898121 943 729 1 074 070 1164 972 1068133 1069 910 1 281 583 1 092 279 894 021 670 930 901 108 1 068 857 1013 065
n.a.
% of market held by ECU securities by instrument
Eurobonds straights 25.69 23.15 11.14 11.16 8.45 5.65 3.11 4.45 4.37 2.56 4.81 3.34 3.28 3.01 2.94 2.03 1.94 2.38 3.26 2.83 6.19 9.02 7.58 n.a. Others straights 11.71 8.66 3.76 3.72 4.52 3.37 3.21 4.19 3.81 3.57 3.96 3.96 3.48 3.08 2.79 2.50 2.75 2.46 2.20 2.13 2.84 3.39 5.60 n.a. Converti-bles 1.26 2.76 1.78 1.20 0.77 0.89 0.40 0.31 0.49 0.52 0.56 0.68 0.21 0.97 0.13 0.14 0.40 0.11 0.10 0.18 0.12 3.68 1.67 n.a. Floating rate notes 2.49 3.94 1.96 0.69 1.48 1.18 0.69 0.99 0.80 0.82 1.07 0.57 0.61 0.41 0.44 0.74 0.71 0.78 0.43 0.60 0.69 0.69 1.17 n.a. Certificates of deposit 4.52 6.47 6.70 0.34 0.37 0.00 0.00 0.00 0.00 0.00 0.00 0.00 0.00 0.00 0.00 0.00 0.00 0.00 0.00 0.00 0.00 0.00 0.00 n.a. Short- & med. term notes 19.30 20.83 17.22 23.65 26.95 16.97 5.75 10.00 7.54 6.26 5.48 5.03 5.74 5.54 4.66 4.84 5.16 4.77 4.56 5.03 23.74 5.13 8.06 n.a. n.a. = not available
(*) Yearly figures are calculated as a total of quarterly figures; there may be some differences with the total of monthly data
[image:13.595.72.526.439.765.2]eurostat
TABLE IX
Interest rates and yields of ECU investments (%)
1992 1993 1994 1995 1996 1997 1 2 3 4 5 6 7 8 9 10 11 12 1998 1 2 3 4 5 6 EMI* 10.29 8.21 5.92 5.88 4.35 4.00 3.75 3.75 4.00 4.00 4.00 4.00 4.00 4.00 4.00 4.25 4.25 4.25 4.25 4.00 4.25 4.25 4.25
Deposits (maturity in months)"
1 10.43 8.27 5.95 5.85 4.34 4.01 4.04 4.12 4.05 4.01 4.02 4.09 4.20 4.16 4.27 4.38 4.27 4.18 4.24 4.14 4.13 n.a. n.a. 3 10.41 7.99 5.98 5.90 4.31 3.99 4.03 4.13 4.07 4.05 4.05 4.11 4.25 4.22 4.37 4.49 4.35 4.22 4.24 4.13 4.13 n.a. n.a. 6 10.27 7.65 6.05 5.98 4.32 3.98 4.02 4.16 4.11 4.09 4.09 4.15 4.32 4.32 4.46 4.56 4.44 4.28 4.25 4.13 4.13 n.a. n.a. 12 10.01 7.11 6.21 6.15 4.39 3.98 4.02 4.21 4.19 4.16 4.15 4.21 4.39 4.41 4.59 4.66 4.52 4.31 4.26 4.13 4.13 n.a. n.a.
Yield on ECU bonds (maturity in years)
1 7.28 6.35 6.23 4.45 4.02 4.02 4.26 4.23 4.18 4.19 4.24 4.47 4.49 4.65 4.70 4.57 4.33 4.26 4.16 4.18 4.19 4.16 2 6.87 6.77 6.66 4.79 4.13 4.13 4.45 4.46 4.35 4.31 4.33 4.62 4.62 4.82 4.84 4.68 4.38 4.28 4.18 4.23 4.26 4.19 3 6.74 7.01 6.99 5.17 4.39 4.35 4.69 4.74 4.60 4.54 4.50 4.80 4.79 4.98 4.98 4.82 4.50 4.38 4.29 4.36 4.39 4.30 4 6.78 7.13 7.25 5.55 4.71 4.62 4.97 5.05 4.88 4.82 4.73 4.99 4.97 5.13 5.13 4.96 4.65 4.53 4.45 4.50 4.55 4.43 5 6.91 7.24 7.46 5.90 5.05 4.91 5.25 5.35 5.17 5.11 4.97 5.18 5.15 5.27 5.26 5.09 4.80 4.68 4.60 4.63 4.68 4.54 6 7.04 7.39 7.63 6.18 5.35 5.18 5.50 5.62 5.43 5.37 5.19 5.36 5.31 5.39 5.39 5.18 4.90 4.79 4.71 4.72 4.77 4.62 7 7.14 7.55 7.76 6.40 5.60 5.41 5.72 5.85 5.66 5.59 5.39 5.52 5.46 5.51 5.50 5.26 4.99 4.89 4.79 4.79 4.83 4.68 8 7.20 7.66 7.85 6.57 5.81 5.62 5.91 6.04 5.85 5.79 5.57 5.69 5.61 5.61 5.60 5.34 5.08 4.98 4.87 4.87 4.91 4.75 9 7.22 7.69 7.88 6.72 5.98 5.78 6.07 6.19 6.01 5.96 5.74 5.85 5.74 5.70 5.69 5.43 5.20 5.09 4.98 4.98 5.04 4.88 10 7.19 7.56 7.86 6.85 6.14 5.90 6.20 6.30 6.14 6.11 5.90 6.00 5.88 5.80 5.78 5.56 5.38 5.25 5.14 5.15 5.26 5.10
Daily rates
1.06.98 2.06.98 3.06.98 4.06.98 5.06.98 8.06.98 9.06.98 10.06.98 11.06.98 12.06.98 15.06.98 16.06.98 17.06.98 18.06.98 19.06.98 22.06.98 23.06.98 24.06.98 25.06.98 26.06.98 29.06.98 30.06.98 n.a. n.a. n.a. n.a. n.a. n.a. n.a. n.a. n.a. n.a. n.a. n.a. n.a. n.a. n.a. n.a. n.a. n.a. n.a. n.a. n.a. n.a. n.a. n.a. n.a. n.a. n.a. n.a. n.a. n.a. n.a. n.a. n.a. n.a. n.a. n.a. n.a. n.a. n.a. n.a. n.a. n.a. n.a. n.a. n.a. n.a. n.a. n.a. n.a. n.a. n.a. n.a. n.a. n.a. n.a. n.a. n.a. n.a. n.a. n.a. n.a. n.a. n.a. n.a. n.a. n.a. n.a. n.a. n.a. n.a. n.a. n.a. n.a. n.a. n.a. n.a. n.a. n.a. n.a. n.a. n.a. n.a. n.a. n.a. n.a. n.a. n.a. n.a. 4.16 4.14 4.17 4.17 4.19 4.19 4.19 4.17 4.19 4.14 4.12 4.16 4.15 4.18 4.18 4.18 4.17 4.16 4.15 4.12 4.12 4.10 4.20 4.18 4.20 4.22 4.23 4.22 4.24 4.22 4.20 4.19 4.17 4.19 4.20 4.20 4.22 4.19 4.18 4.17 4.17 4.15 4.14 4.14 4.31 4.30 4.31 4.33 4.33 4.33 4.35 4.33 4.29 4.29 4.27 4.28 4.30 4.30 4.32 4.29 4.28 4.27 4.27 4.25 4.24 4.25 4.44 4.44 4.45 4.45 4.46 4.46 4.48 4.46 4.43 4.42 4.38 4.39 4.43 4.44 4.45 4.42 4.41 4.41 4.40 4.38 4.37 4.38 4.57 4.57 4.57 4.57 4.58 4.59 4.60 4.58 4.55 4.53 4.48 4.50 4.54 4.56 4.57 4.54 4.53 4.53 4.51 4.50 4.48 4.49 4.66 4.65 4.65 4.66 4.67 4.66 4.69 4.66 4.63 4.61 4.56 4.58 4.62 4.63 4.64 4.61 4.60 4.59 4.59 4.57 4.56 4.57 4.73 4.71 4.71 4.73 4.73 4.72 4.76 4.72 4.68 4.67 4.63 4.64 4.69 4.68 4.69 4.65 4.65 4.64 4.64 4.63 4.62 4.63 4.81 4.78 4.79 4.81 4.81 4.80 4.83 4.79 4.74 4.73 4.71 4.72 4.77 4.76 4.76 4.72 4.72 4.71 4.72 4.71 4.70 4.72 4.94 4.92 4.93 4.94 4.92 4.92 4.94 4.90 4.86 4.83 4.81 4.85 4.88 4.89 4.89 4.86 4.86 4.84 4.86 4.86 4.85 4.86 5.14 5.16 5.17 5.14 5.11 5.12 5.10 5.09 5.07 4.99 4.97 5.04 5.05 5.12 5.12 5.13 5.11 5.07 5.11 5.12 5.11 5.10n.a. = not available
' Operation rates of the EMI: see explanatory notes
eurostat
Graph 3: ECU yield curve
6.5
6.0
5.5
■Ό Φ
5.0
4.5
4.0
J . . . . . . . . J
1 2 3 4 5 6 7 Maturity (years)
30-jun-97
29-may-98 30-jun-98
8 9 10
Graph 4: Evolution of ECU yields over the last 18 months
6.5
ω
10 years
3 years
Jan Feb Mar Apr May Jun Jul Aug Sep Oct Nov Dec Jan Feb Mar Apr May Jun
1997 1998
eurostat TABLE Χ
Centrai bank interest rates
Β
DKDR I REPO~1
DR | LR | REPO | 3D TB | DR | LR | OREL
DR AUCT AR
CR
CD
REPO I AR06/97 07/97 08/97 09/97 10/97 11/97 12/97 01/98 02/98 03/98 04/98 05/98 06/98
2.50 2.50 2.50 2.50 2.75 2.75 2.75 2.75 2.75 2.75 2.75 2.75 2.75
3.00 3.00 3.00 3.00 3.30 3.30 3.30 3.30 3.30 3.30 3.30 3.30 3.30
4.25 4.25 4.25 4.25 4.55 4.55 4.55 4.55 4.55 4.55 4.55 4.55 4.55
3.00 3.00 3.00 3.00 3.30 3.30 3.30 3.30 3.30 3.30 3.30 3.30 3.30
3.25 3.25 3.25 3.25 3.50 3.50 3.50 3.50 3.50 3.50 3.50 3.75 3.75
3.50 3.50 3.50 3.50 3.75 3.75 3.75 3.75 3.75 3.75 3.75 4.25 4.00
Rates at the end of: 3.50
3.50 3.50 3.50 3.75 3.75 3.75 3.75 3.75 3.75 3.75 4.00 4.00
2.50 2.50 2.50 2.50 2.50 2.50 2.50 2.50 2.50 2.50 2.50 2.50 2.50
4.50 4.50 4.50 4.50 4.50 4.50 4.50 4.50 4.50 4.50 4.50 4.50 4.50
3.00 3.00 3.00 3.00 3.30 3.30 3.30 3.30 3.30 3.30 3.30 3.30 3.30
3.10 3.10 3.10 3.10 3.10 3.10 3.10 3.10 3.10 3.10 3.10 3.10 3.10
14.50 14.50 14.50 14.50 14.50 14.50 14.50 14.50 14.50 14.50
-19.00 19.00 19.00 19.00 19.00 19.00 19.00 23.00 23.00 19.00 19.00 19.00 19.00
24.00 24.00 24.00 24.00 24.00* 24.00* 24.00* 24.00* 24.00* 22.00 22.00 22.00 22.00
5.25 5.25 5.25 5.25 5.00 5.00 4.75 4.75 4.50 4.50 4.50 4.25 4.25
5.30 5.30 5.30 5.30 5.05 5.05 4.80 4.80 4.55 4.55 4.55 4.30 4.30 Recent actual changes
01.05.98 04.05.98 05.05.98 06.05.98 07.05.98 08.05.98 11.05.98 12.05.98 13.05.98 14.05.98 15.05.98 18.05.98 19.05.98 20.05.98 21.05.98 22.05.98 25.05.98 26.05.98 27.05.98 28.05.98 29.05.98 01.06.98 02.06.98 03.06.98 04.06.98 05.06.98 08.06.98 09.06.98 10.06.98 11.06.98 12.06.98 15.06.98 16.06.98 17.06.98 18.06.98 19.06.98 22.06.98 23.06.98 24.06.98 25.06.98 26.06.98 29.06.98 30.06.98
4.00 4.25 4.25
3.75 4.00
4.00
4.25 4.30
Please see explanatory notes at the end of the publication for the key to the various rates. Data series with the same abbreviation are not necessarily internationally comparable.
TABLE Χ Central bank interest rates
IRL NL
AR I SPR I LR
A
IK
AUCT REPO STF DR I LR I REPO|R-REPÕ DR REPO PR R I SFR I DR R I PRO | PRO
3.10 3.10 3.10 3.10 3.30 3.30 3.30 3.30 3.30 3.30 3.30 3.30 3.30
4.60 4.60 4.60 4.60 4.60 4.60 4.60 4.60 4.60 4.60 4.60 4.60 4.60
6.75 6.75 6.75 6.75 6.75 6.75 6.75 6.75 6.75 6.75 6.75 6.75 6.75
6.25 6.25 6.25 6.25 6.25 6.25 5.50 5.50 5.50 5.50 5.00 5.00 5.00
7.75 7.75 7.75 7.75 7.75 7.75 7.00 7.00 7.00 7.00 6.50 6.50 6.50
6.26 6.27 6.71 6.61 6.79 6.21 6.16 6.29 6.07 6.15 5.63 5.51 6.50 5.48 4.92
Rates at the end of:
2.50 2.50 2.50 2.50 2.75 2.75 2.75 2.75 2.75 2.75 2.75 2.75 2.75
2.90 3.00 3.00 3.00 3.30 3.30 3.30 3.30 3.30 3.30 3.30 3.30 3.30
4.50 4.50 4.50 4.50 4.50 4.50 4.50 4.50 4.50 4.50 4.50 4.50 4.50
2.50 2.50 2.50 2.50 2.50 2.50 2.50 2.50 2.50 2.50 2.50 2.50 2.50
4.75 4.75 4.75 4.75 4.75 4.75 4.75 4.75 4.75 4.75 4.75 4.75 4.75
3.00 3.00 3.00 3.00 3.20 3.20 3.20 3.20 3.20 3.20 3.20 3.20 3.20
6.000 5.703 5.501 5.501 5.502 5.300 5.308 5.308 5.100 4.700 4.700 4.500 4.500
7.70 7.40 7.20 7.20 7.20 6.90 6.90 6.80 6.60 6.40 6.40 6.20 6.20
5.70 5.40 5.20 5.20 5.20 4.90 4.90 4.80 4.60 4.40 4.40 4.20 4.20
5.700 5.400 5.200 5.200 5.200 4.900 4.900 4.800 4.600 4.400 4.400 4.200 4.200
6.000 5.702 5.500 5.500 5.500 5.300 5.327 5.300 5.104 4.700 4.700 4.500 4.520
06/97 07/97 08/97 09/97 10/97 11/97 12/97 01/98 02/98 03/98 04/98 05/98 06/98
Recent actual changes
5.60
5.58
5.57
5.48
4.707
6.20 4.20 4.500
4.504
4.500
4.727 4.708
4.700 4.716
4.505
4.200 4.510
4.500
01.05.98 04.05.98 05.05.98 06.05.98 07.05.98 08.05.98 11.05.98 12.05.98 13.05.98 14.05.98 15.05.98 18.05.98 19.05.98 20.05.98 21.05.98 22.05.98 25.05.98 26.05.98 27.05.98 28.05.98 29.05.98
4.505 5.35
4.520
5.31
5.26 4.92
4.500
4.520
01.06.98 02.06.98 03.06.98 04.06.98 05.06.98 08.06.98 09.06.98 10.06.98 11.06.98 12.06.98 15.06.98 16.06.98 17.06.98 18.06.98 19.06.98 22.06.98 23.06.98 24.06.98 25.06.98 26.06.98 29.06.98 30.06.98
eurostat TABLE Χ
Central bank interest rates FIN
TR | AR DR I AR I REPO I IBR~
UK IS CH US JP
BR BR AR REPO CD AR DR LR DR I FED DR
06/97 07/97 08/97 09/97 10/97 11/97 12/97 01/98 02/98 03/98 04/98 05/98 06/98
4.00 4.00 4.00 4.00 4.00 4.00 4.00 4.00 4.00 4.00 4.00 4.00 4.00
3.00 3.00 3.00 3.25 3.25 3.25 3.25 3.25 3.25 3.40 3.40 3.40 3.40
5.00 5.00 5.00 5.25 5.25 5.25 5.25 5.25 5.25 5.40 5.40 5.40 5.40
2.50 2.50 2.50 2.50 2.50 2.50 2.50 2.50 2.50 2.50 2.50 2.50 2.50
5.25 5.25 5.25 5.25 5.25 5.25 5.25 5.25 5.25 5.25 5.25 5.25 5.25
4.10 4.10 4.10 4.10 4.10 4.10 4.35 4.35 4.35 4.35 4.35 4.35 4.10
Rates at the end of:
6.04 5.58 5.58 5.88 6.09 6.09 6.35 5.68 5.68 5.47 5.37 5.42 5.42
6.50 6.75 7.00 7.00 7.00 7.25 7.25 7.25 7.25 7.25 7.25 7.25 7.25
-8.50 8.50 8.50 8.50
6.90 6.90 6.90 6.90 6.90 7.20 7.20 7.20 7.20 7.20 7.20 7.20 7.20
6.70 6.70 6.70 6.70 6.70 7.00 7.00 7.00 7.00 7.00 7.00 7.00 7.00
5.25 5.50 5.50 5.50 5.50 5.50 5.50 5.50 5.50 5.75 5.75 6.25 6.50
1.00 1.00 1.00 1.00 1.00 1.00 1.00 1.00 1.00 1.00 1.00 1.00 1.00
3.875 3.625 3.375 3.875 3.875 3.750 3.750 3.000 2.750 3.375 3.500 3.750 4.625
5.00 5.00 5.00 5.00 5.00 5.00 5.00 5.00 5.00 5.00 5.00 5.00 5.00
5.50 5.50 5.50 5.50 5.50 5.50 5.50 5.50 5.50 5.50 5.50 5.50 5.50
0.50 0.50 0.50 0.50 0.50 0.50 0.50 0.50 0.50 0.50 0.50 0.50 0.50
Recent actual changes 01.05.98
04.05.98 05.05.98 06.05.98 07.05.98 08.05.98 11.05.98 12.05.98 13.05.98 14.05.98 15.05.98 18.05.98 19.05.98 20.05.98 21.05.98 22.05.98 25.05.98 26.05.98 27.05.98 28.05.98 29.05.98 01.06.98 02.06.98 03.06.98 04.06.98 05.06.98 08.06.98 09.06.98 10.06.98 11.06.98 12.06.98 15.06.98 16.06.98 17.06.98 18.06.98 19.06.98 22.06.98 23.06.98 24.06.98 25.06.98 26.06.98 29.06.98 30.06.98
5.42
4.10
7.50
6.25
6.50
3.625
3.750 3.625
3.750
3.625 3.750 3.875 4.000 4.250 4.000 3.875 3.750
3.875 3.750
3.875 4.000 4.500 4.625
eurostat
Evolution of central bank interest rates over the last 12 months
10 τ
4
--1
DR •CR
10 τ
1
-DR CD
1.7.97 30.9.97 30.12.97 31.3.98 30.6.98 1.7.97 30.9.97 30.12.97 31.3.98 30.6.98
10
7
4
--Θ
-DR-LR Repo
28
23
18
13
■DR LR OR
1
1.7.97 30.9.97 30.12.97 31.3.98 30.6.98 1.7.97 30.9.97 30.12.97 31.3.98 30.6.98
10 τ
io -,
7
4
-- Id
i
-^JL_
Repo AR
1
a
-AuctRepo
1.7.97 30.9.97 30.12.97 31.3.98 30.6.98 1.7.97 30.9.97 30.12.97 31.3.98 30.6.98
10
7 --.
•STF
10
7
-4 - — DR
Repo LR
L_
\
Q
ι
" I
1
1.7.97 30.9.97 30.12.97 31.3.98 30.6.98 1.7.97 30.9.97 30.12.97 31.3.98 30.6.98
10 τ
1
a
SPR -AR •LR10 χ
7
4
--1
Q
-DR-LR Repo
1.7.97 30.9.97 30.12.97 31.3.98 30.6.98 1.7.97 30.9.97 30.12.97 31.3.98 30.6.98
eurostat
Evolution of central bank interest rates over the last 12 months
10 τ
[Θ
— DROPRO
"""* u—
10 τ
1 1.7.97
10 j
7
--BJ
BR -TR30.9.97 30.12.97 31.3.98 30.6.98
4
--3
AR -Repo1
1.7.97 30.9.97 30.12.97
10
31.3.98 30.6.98
4
--1
1.7.97 30.9.97
ίο τ fis
-BR
30.12.97 31.3.98 30.6.98
7 - .
4 -■
1
Repo
1 1.7.97 10
30.9.97 30.12.97 31.3.98 30.6.98
4
-1
a
•AR1.7.97 30.9.97 30.12.97 31.3.98 30.6.98 1.7.97 30.9.97 30.12.97 31.3.98 30.6.98
10
a
6
4
2
-- [CHJ
— DRLR
10
4
-•DR FED
1.7.97 30.9.97 30.12.97 31.3.98 30.6.98
10 τ
1.7.97 30.9.97 30.12.97 31.3.98 30.6.98
8 6 --4 2
a
-DR1.7.97 30.9.97 30.12.97 31.3.98 30.6.98
EXPLANATORY NOTES
Exchange rate grid (Table I)
The intervention limit rates fixed in the official grid do not correspond exactly to + or - 15 % of the central rates, since for each currency pair (whose exchange rates are inversely proportional to one another) the lower limit of one corresponds to the upper limit of the other.
Bilateral fluctuations of the ERM currency
(Graph 1 on page 5)
The daily market exchange rates of all currencies are compared with the relevant bilateral central rates and the differentials between the two calculated.
The graph is divided symmetrically by a horizontal axis along which the points would be plotted if all currencies were at their bilateral central rate and there were therefore no fluctuations.
The curves are drawn by linking the daily points showing the relative positions of each currency. These should be compared in pairs. To find the differential between two currencies, subtract the (positive or negative) values along the y-axis corresponding to each currency.
The graph is drawn with the curve of the stronger currency above that of the weaker. It shows therefore the relative position of each currency vis-à-vis the other currencies.
When two curves intersect or merge over a period of time there is no differential between the two currencies and their market exchange rate equals their bilateral central rate.
The maximum spread recorded between two currencies is signified by the band, symmetrical with the horizontal axis. The fluctuations of the other currencies in relation to either of the two currencies in question are shown within the maximum spread.
The divergence indicator (Graph 2 on page 5)
The divergence indicator (DI) measures the degree of movement of a specific EMS currency against its maximum divergence spread. In effect, the DI is a mechanism which detects the EMS currencies that deviate upwards or downwards from the Community average as represented by the ECU.For a given currency the divergence indicator is obtained:
(I) first by calculating the appreciation or depreciation of the market rate of the ECU in terms of that currency against its ECU-related central rate;
(ii) and then by comparing the result obtained with the maximum divergence spread (MDS), which is the intervention limit, corrected by the weight of each
currency in the basket in such a way that an increase in the weight of a currency reduces its maximum divergence spread.
In order to permit a comparison of movements in the divergence indicators for each of the EMS currencies, the MDS is expressed as an index number ranging between +/-100. At an absolute index number of 75, a currency reaches its divergence threshold. When a currency crosses its "threshold of divergence", this results in a presumption that the authorities concerned will correct this situation by taking adequate measures.
ECU exchange rates (Table II)
The exchange rates for the ECU against the national currencies of the member states of the Community, the USD and yen are shown as annual averages, monthly averages (for the current year), and daily rates (for the latest available month).
Change in the purchasing power of the ECU (Harmonised indices of consumer prices adjusted for ECU exchange rate changes)
(Table III)
For each country the index of harmonised consumer prices in ECUs is calculated by multiplying the national harmonised consumer price index (HICP) by the average movement of the national currency in relation to the ECU during the month. It measures the change in the purchasing power of one ECU in the country concerned. A rise in the index means a fall in the purchasing power of the ECU.
Four composite indices are calculated, the first covering all the Member States of the Community (EU-15), the second covering 11 Member States forming the monetary union on 1 January 1999 (EUR-11), the third covering 13 Member States whose currencies participate in the European Monetary System exchange rate mechanism (ERM), and the fourth covering the 12 member countries whose currencies go to make up the ECU.
These four indices are calculated as weighted arithmetic means (chain indices). The weightings are defined as follows: for the EU-15, EUR-11 and ERM indices, the relative share of each member state in the final consumption of households for the group of countries in question (EU-15, EUR-11 or ERM), at current prices and exchange rates (annual weighting). For the ECU index, the relative share of each member state's currency in the calculation of the ECU (monthly weighting).
The base year is 1996. These indices may be used for indexing new contracts in ECU.
Ξ3
eurostat
ECU-EMS Information and central bank interest rates Explanatory notes
Harmonised Indices of Consumer Prices (HICPs) are designed to facilitate international comparisons of consumer price inflation. The focus lies on comparability among the indices of the different Member States as well as the relative movements. They will form the basis of the Monetary Union Index of Consumer Prices (MUICP) to be used for the monitoring of inflation in the euro-area.
HICPs are harmonized not only on coverage but also in several methodological aspects (details are given in the Eurostat news release "Harmonising the way the EU measures inflation", No 21/97, of 5 March 1997, and in Regulations (EC) No 2494/95, No 1749/96, No 2214/96, and No 2454/97). HICPs provide the best statistical basis for international comparisons of consumer price Inflation and very considerable progress has been made in harmonizing methodologies.
The HICPs are compiled using a version of the international "Classification of individual consumption by purpose" which has been specially adapted for the HICPs and is known as COICOP/HICP. Since March 1997 the Commission (Eurostat) has been disseminating every month about 100 sub-indices and their weights.
Change in the purchasing power of the ECU
(Non-harmonised indices of consumer prices
adjusted for ECU exchange rate changes) (Table IV)
For each country the non harmonised index of consumer prices in ECUs ¡s calculated by multiplying the national non harmonised consumer price index by the average movement of the national currency in relation to the ECU during the month. It measures the change in the purchasing power of one ECU in the country concerned. A rise in the index means a fall in the purchasing power of the ECU. Three composite indices are calculated, the first covering all the member states of the Community (EU-15), the second covering 13 member states whose currencies participate in the European Monetary System exchange rate mechanism (ERM), and the third covering the 12 member countries whose currencies go to make up the ECU. (Although the peseta has been participating in the exchange rate mechanism since 19/06/89 and has been included in the calculation of the ECU since 21/09/89, it is only taken into account in the indices relating to the ERM which are included in this bulletin for data after 30/09/89).
These three indices are calculated as weighted arithmetic means (chain indices). The weightings are defined as follows: for the EU-15 and ERM indices, the relative share of each member state in the final consumption of households for the group of countries in question (EU-15 or ERM), expressed in ECUs at current prices and exchange rates (annual weighting). For the ECU index, the relative share of each member state's currency in the calculation of the ECU (monthly weighting).
The base year is 1985. These indices may be used for indexing existing contracts In ECU; for new contracts the new harmonised CPI in ECU may be used instead. The non harmonised price indices in ECU will be published until December 1998.
ECU bond issues (Tables V & VI)
In table V, issues are recorded as at the payment date. This bulletin covers ECU issues in the Eurobond market, which includes international and foreign issues and domestic issues which can be assimilated with Eurobond issues. More specifically, the domestic issues should be free of withholding tax in the hands of non-residents and subject to similar clearing and settlement procedures. This includes ECU issues offering the option of conversion into other currencies. Main source: International Financing Review. Table V shows, under the headings:
— Business sector and Governments: national issuers, both private and public.
— Institutions: the European Investment Bank and the Commission of the European Communities (EEC, ECSC, Euratom).
— Organisations: the specialist institutions of the United Nations, the World Bank, the Council of Europe, etc.... Table VI shows detailed information on the latest known issues, irrespective of the payment date.
Outstanding amount of ECU bonds (Table VII)
This table shows the bonds in ECUs outstanding at the end of the last three months and at the end of the last three years. These statistics are taken from a particularly comprehensive database and measure the volume of ECU bonds in circulation. The overall figure is broken down in two ways - by residual maturity and by type of issuer.
Total of the secondary market turnover and % of
market taken by ECU securities (Table VIII)
This table shows the volume of transactions on securities conducted by the international clearing houses Cedel and Euroclear. The market shares of the various types of instrument are calculated. These statistics do not cover all transactions throughout the world, since internal movements are not included. They do, however, give a realistic idea of market developments.
Interest rates and yields on ECU investments
(Table IX)
The interest rates for 1, 3, 6 and 12 months deposits are calculated on the basis of the London market rates LIBID as follows:
— until October 1993: source: Financial Times, Friday rate. — from November 1993: source : Bank of England, British
Banker's Association, daily rates.
Explanatory notes ECU-EMS Information and central bank interest rates
eurostat
The yields of ECU bonds at 1 -10 years are those provided by Eurostat's yield curve. These are redemption yields. Eurostat's yield curve, which portrays the interest rate structure of maturities ranging from 1 to 10 years, is based on highest quality issues with a triple-Α rating of at least ECU 500 million outstanding, with a very high liquidity (bid-offer spread less than 50 basis points). The curve Is calculated daily by fitting a third order polynomial function by regression to the price/yield values of bonds provided by ISMA (International Securities Market Association, London). These values reflect the mean of bid and offer prices communicated by a comprehensive range of financial institutions. The monthly figures included in the table are the arithmetic average of daily figures and the yearly figures are the arithmetic average of daily figures.
Operation rates of the EMI (Table IX)
The interest rate for transactions of the EMI (European Monetary Institute) in ECUs is the weighted average of the most representative rates on the domestic money market of the countries whose currencies make up the ECU basket. It is based on the weighting of the currencies in the ECU basket as derived from the ECU central rates in force. The rate thus calculated for a given month applies to EMI transactions for the following month. In table VII, this rate relates to the month upon which the calculations are based and not to the (following) month during which it is used by the EMI.
ECU yield curve
These graphs show the trend in yields on ECU bonds. Graph 3 shows the ECU yield for bonds due at the end of the last month, at the end of the preceding month and one year previously. Graph 4 shows the development in yields for maturities of 3 and 10 years over the last 12 months. The difference between these two curves reflects the gradient of the rates curve.
Central Bank Interest Rates in the EEA countries,
in the US, Japan and Switzerland (Table X)
BELGIUMOfficial intervention rates:
Discount rate (DR): rate at which credit institutions can discount commercial paper at the BNB within the ceilings fixed individually according to balance sheet items.
1-week credit granted by tender (AUCT): rate at which the BNB grants cash by tender to credit institutions. The duration of these loans is generally 1 week but can be longer under particular circumstances.
Advances to meet daily deficits (AR): rate at which credit institutions receive money from the BNB within quotas which vary between credit institutions according to balance sheet items and to turnover in the secondary market for government debt-securities.
Central Bank rate (CR): rate at which Primary dealers1
receive overnight money, up to a fixed maximum which is the same for each Primary dealer, from the BNB. This rate will be the next rate applied to the 1 -week credit granted by tender.
DENMARK
Intervention rates:
Discount rate (DR): indicative rate which is not attached to any facility with the Danmarks Nationalbank. Within quotas based on the size of the individual bank, deposits on banks' current account with the Danmarks Nationalbank are remunerated by the folio rate. This rate has been equal to the discount rate since the introduction of the present liquidity instruments in April 1992.
Certificates of deposit (CD): rate on 14-day certificates of deposit issued on the last banking day of each week by the Nationalbank.
Repurchase agreements (REPO): rate at which the banks have access to enter into 14-day repurchase agreements in government paper with the Nationalbank. These transactions take place on the penultimate banking day of each week, affecting bank liquidity the following day. The interest rate on repos has equalled the rate on CDs since April 1992.
GERMANY
Intervention rates:
Discount rate (DR): rate at which the Bundesbank discounts eligible trade bills within the limits of the rediscount quotas.
Lombard rate (LR): rate at which the Bundesbank grants loans to banks against certain securities. These loans have a maturity of up to 90 days and are granted against collateral of government and public sector securities.
Rate on repurchase agreements (REPO): rate applied to the Bundesbank's repurchase facility. The Bundesbank buys bonds eligible as collateral for Lombard loans and short-term Treasury discount paper from those banks subject to minimum reserve requirements. These transactions are usually offered by fixed-rate tender or by variable-rate tender for a period of 14, 28 or 35 days.
Other rate:
3-day Treasury bills (3D TB): rate on bills that can be bought or sold by a specific list of banks. This establishes a floor for the cost of short-term money in addition to the fixed amount provided by the discount window.
GREECE
Intervention rates:
Rediscount rate (DR): rate at which the Bank of Greece rediscounts commercial bills. This facility is subject to overall quotas which are allocated among credit institutions
Primary dealers are market makers for government linear bonds (OLO) and Treasury certificates.