• * • • *
* + •
Theme 2
Economy and finance
Series Β
Short-term statistics
ISSN 1024-4239
eurostat
ECU-EMS information
and central bank interest rates
12 D 1996
Monthly
Bilateral fluctuations of the ERM currencies
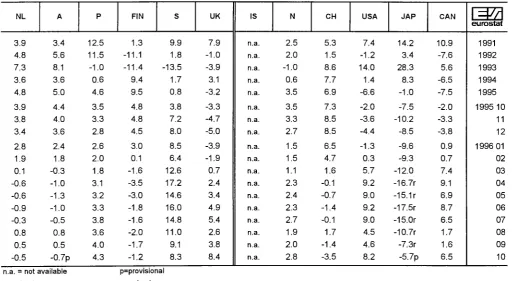
Graph 1 on page 4 shows the trends in the bilateral fluctuation of ERM currencies between 1 October 1996 and 29 November 1996 calculated on a daily basis.This graph shows that during the whole period under consideration, there were no tensions in the bilateral fluctuation of all but one ERM currency. Specifically, the IRL, the strongest and most volatile currency in the ERM grid during the period considered, continued to strengthen markedly, in line with UKL and the USD after 30 October. This caused the width of the band within which all ERM currencies moved to increase from 2.86% on 31 October 1996 to 7.87% on 29 November 1996. It is important to notice that since the last week of November, the FF has weakened slightly against the DM and the other ERM currencies. By the end of November, all ERM currencies but the IRL moved within a band of 2.71%, which is slightly wider than at the end of the previous month (2.12%, if the IRL is excluded).
The graph includes the bilateral fluctuations of the LIT. The LIT which was forced out of the exchange rate mechanism along with UKL in September 1992, re-joined the ERM on 25 November 1996. The ECU central rate for the LIT is LIT 1906.48 and its bilateral central rate against the DM is LIT 990.004 (see the new exchange rate grid, with the new ECU central rates in table 1). Like other member currencies of the ERM, the fluctuation limits are set at ±15%. Since 25 November the LIT was trading near its DM bilateral central rate and ended the month at LIT 986.137 per DM.
Consumer price indices in ECU
Owing mainly to the sharp appreciation of LIT and SKR against the ECU, the indices of Italy and Sweden continued to climb, and rose in the 12 months to October by 14.1% and 8.3% respectively. The indices of the United Kingdom and Ireland also continued on a strong upward trend. In the 12 months to October these indices rose by 8.4% and 6.2% respectively, partly due to their
corresponding inflation rates and partly to the sharp appreciation of the IRL and UKL against the ECU over the 12 month period.
In the 12 months to October the indices of Greece, Spain, France and Portugal, rose by 10.3%, 3.5%, 2.3% and 4.3% respectively. These increases in the national CPIs expressed in ECU mostly reflect increases in the corresponding inflation rates in national currency. The index of Denmark rose slightly, by 0.9%, reflecting an increase in inflation which was partly offset by a slight depreciation of the DKR against the ECU, from October 1995 to October 1996.
Because of the larger depreciation of the BFR, DM, LUF, HFL, OS, and FMK against the ECU relative to the low rate of growth of the respective CPIs in national currencies from October 1995 to October 1996, the index of Belgium, Germany, Luxembourg, the Netherlands, Austria and Finland fell by 0.5%, 1.3%, 1.4%, 0.5%, 0.7% and 1.2% respectively.
ECU yields continue to fall
There was a noticeable fall in ECU yields in November 1996, continuing the downward trend noted since January 1995. As at 3 December 1996, yields for up to 7 years were at an all-time low. Yields for up to 10 years were still 60 bp above the rate at the beginning of January 1994, when they reached their lowest level. Long-term ECU rates have fallen less than short-term rates, and this has raised the slope of the curve. As measured by the yield gap between 10 and 2 years, the graph peaked at 220 bp in May 1996 before dropping to 180 bp at the beginning of December. This fall in ECU yields has gone hand-in-hand with a decline in money market rates. The 1-, 3- and 6 month Libor rates for the ECU are now barely above 4%, an unprecedented low. ECU interest rates and yields have benefited from the widespread bearish cycle in Europe and also from the tendency for rates to converge on those of the most stable EMS currencies. For example, the 10-year yield gap against the Bund or OAT is now only around 35 bp as against 120 bp in January 1996.
eurostat
OFICINA ESTADÍSTICA DE LAS COMUNIDADES EUROPEAS DE EUROPÆISKE FÆLLESSKABERS STATISTISKE KONTOR STATISTISCHES AMT DER EUROPÄISCHEN GEMEINSCHAFTEN ΣΤΑΤΙΣΤΙΚΗ ΥΠΗΡΕΣΙΑ ΤΩΝ ΕΥΡΩΠΑΪΚΩΝ ΚΟΙΝΟΤΗΤΩΝ STATISTICAL OFFICE OF THE EUROPEAN COMMUNITIES
OFFICE STATISTIQUE DES COMMUNAUTÉS EUROPÉENNES
ISTITUTO STATISTICO DELLE COMUNITÀ EUROPEE
BUREAU VOOR DE STATISTIEK DER EUROPESE GEMEENSCHAPPEN SERVIÇO DE ESTATÍSTICA DAS COMUNIDADES EUROPEIAS
L-2920 Luxembourg - Tél. 43 01-1 - Télex COMEUR LU 3423 B-1049 Bruxelles, rue de la Loi 200 - Tél. 299 11 11
Note
For any
TEL:
FAX:
information on the statistics
+352
+352
+352
346991-337
346991-334 or 341
4301-32929
in this bulletin contact Luxembourg:
F. GARCIA-VALERO / R. SCHMITZ
S. WARTON-WOODS / 0. DELOBBE
(Central bank interest rates)
Eurostat
Monetary and Financial Statistics
Jean Monnet Building
APC C4/04
L-2920 Luxembourg
ECSC-EC-EAEC, Brussels · Luxembourg, 1996
Reproduction is authorized, except for commercial purposes, provided the source is acknowledged.
TABLE OF CONTENTS
COMMENTS 1
EUROPEAN MONETARY SYSTEM
Table I.
Central rates and intervention limit rates 4
Graph
1. Bilateral fluctuations of the ERM currencies 5
Graph
2. Divergence indicator of the ERM currencies 5
ECU EXCHANGE RATES
Table II.
ECU exchange rates 6
CONSUMER PRICE INDICES
Table III.
Consumer price indices in national currency 8
Table IV.
Consumer price indices in ECU 10
ECU BOND MARKET
Table V.
ECU bond issues 12
Table VI.
Last month's ECU bond issues 12
Table VII.
Outstanding amount of ECU bonds 13
Table
VIM.
Total of the secondary market turnover and % of market taken by ECU securities 13
ECU INTEREST RATES
Table IX.
Operation rates of the EMI and interest rates and yields of ECU investments
14
Graph 3.
ECU yield curve 15
Graph 4.
Evolution of ECU yields 15
CENTRAL BANK INTEREST RATES
Table X.
Central Bank interest rates 16
Graphs.
Evolution of central bank interest rates over the last 12 months 19
TABLE I dl
CENTRAL RATES AND INTERVENTION LIMIT RATES, IN FORCE SINCE 25TH NOVEMBER 1996, FOR THE CURRENCIES OF COUNTRIES PARTICIPATING IN THE EMS EXCHANGE RATE MECHANISM.
I=M
eurostat BLF DKR DM PTA FF IRL LIT HFL ÖS ESC FMK DR UKL1 ECU =
39.7191 7.34555 1.92573 163.826 6.45863 0.798709 1906.48 2.16979 13.5485 197.398 5.85424 295.269 (notional) 0.793103 (notional) +
=
-+
=
-+
=
-+
=
-+
=
-+
=
-+
=
-+
=
-+
=
-+
=
-+
=
-100 BLF=
-21.4747 18.4938 15.9266 5.63000 4.84837 4.17500 478.944 412.461 355.206 18.8800 16.2608 14.0050 2.33503 2.01090 1.73176 5573.60 4799.91 4133.60 6.34340 5.46286 4.70454 39.6089 34.1107 29.3757 577.090 496.984 428.000 17.1148 14.7391 12.6931
100 DKR =
627.880 540.723 465.665
-30.4450 26.2162 22.5750 2589.80 2230.27 1920.70 102.100 87.9257 75.7200 12.6261 10.8734 9.36403 30138.0 25954.2 22351.0 34.3002 29.5389 25.4385 214.174 184.444 158.841 3120.50 2687.31 2314.30 92.5438 79.6976 68.6347 (1 (2) The
selling
100 DM =
2395.20 2062.55 1776.20 442.968 381.443 328.461
-9878.50 8507.18 7326.00 389.480 335.386 288.810 48.1696 41.4757 35.7143 114956 99000.4 85259.0 (130.834)(2) 112.673 (97.0325)(2) 816.927 703.550 605.877 11903.3 10250.5 8827.70 353.008 304.000 261.801 ) Table prepar »e buying and
he German an rate HFL 100 i
100 PTA =
28.1525 24.2447 20.8795 5.20640 4.48376 3.86140 1.36500 1.17548 1.01230
-4.57780 3.94237 3.39510 0.566120 0.487537 0.419859 1351.30 1163.72 1002.20 1.53793 1.32445 1.14060 9.60338 8.27008 7.12200 139.920 120.493 103.770 4.14938 3.57345 3.07740 ed by the E selling rates d Dutch mo π Frankfurt:
100 FF =
714.030 614.977 529.660 132.066 113.732 97.9430 34.6250 29.8164 25.6750 2945.40 2536.54 2184.40
-14.3599 12.3666 10.6500 34276.0 29518.3 25421.0 39.0091 33.5953 28.9381 243.586 209.773 180.654 3549.00 3056.35 2632.10 105.253 90.6422 78.0597
1 IRL =
57.7445 49.7289 42.8260 10.6792 9.19676 7.92014 2.80000 2.41105 2.07600 238.175 205.113 176.641 9.38950 8.08631 6.96400
-2771.70 2386.95 2055.61 3.15450 2.71662 2.33952 19.6971 16.9629 14.6082 286.983 247.145 212.838 8.51107 7.32960 6.31217
1000 LIT
24.1920 20.8337 17.9417 4.47400 3.85294 3.31810 1.17290 1.01010 0.869900 99.7800 85.9311 74.0000 3.93379 3.38773 2.91750 0.486472 0.418944 0.360789
-1.32156 1.13811 0.980132 8.25219 7.10655 6.12032 120.240 103.541 89.1700 3.56570 3.07071 2.64438 ι/ΙΙ following notification by the ce
are not operational. Reflecting a letary authorities, the following r DM 90.77C )0; buying rate HFL 1C
100 HFL =
2125.60 1830.54 1576.45 393.105 338.537 291.544 (103.058)(2) 88.7526 (76.4326)(2) 8767.30 7550.30 6502.20 345.650 297.661 256.350 42.7439 36.8105 31.7007 102027 87864.7 75668.0
-725.065 624.417 537.740 10564.0 9097.55 7834.70 313.295 269.806 232.353
100 ÖS =
340.420 293.163 252.470 62.9561 54.2170 46.6910 16.5050 14.2136 12.2410 1404.10 1209.18 1041.30 55.3545 47.6706 41.0533 6.84544 5.89521 5.07688 16339.0 14071.5 12118.8 18.5963 16.0149 13.7918
-1691.80 1456.97 1254.70 50.1744 43.2094 37.2114
100 ESC =
23.3645 20.1214 17.3285 4.32100 3.72119 3.20460 1.13280 0.975561 0.840100 96.3670 82.9927 71.4690 3.79920 3.27188 2.81770 0.469841 0.404620 0.348453 1121.50 965.805 831.700 1.27637 1.09920 0.946611 7.97000 6.86356 5.91086
-3.44376 2.96570 2.55402 ntral banks concerned,
bilateral agreement between ates continue to apply:
0 in Frankfurt: DM 86.7800;
100 FMK =
787.830 678.468 584.290 145.699 125.474 108.057 38.1970 32.8948 28.3280 3249.50 2798.41 2410.00 128.107 110.324 95.0096 15.8424 13.6433 11.7494 37816.0 32565.8 28045.0 43.0378 37.0636 31.9187 268.735 231.431 199.305 3915.40 3371.88 2903.80
-selling rate DM 100 in Amsterdam: HFL 115.2350; buying rate DM 100 in Amsterdam: HFL 110.1675.
WEIGHTS OF COMPONENT CURRENCIES IN THE ECU, CALCULATED ON THE BASIS OF CENTRAL RATES IN FORCE
SINCE 25.11.1996 COMPOSITION OF THE ECU BASKET
euroslat
PTA /ítiíí 4 . 2 0 % / * 4 ¿ Í Í
DR J E Î J J S ^
0 .49% / ^S t 5= UKL 1 11.0β%\
DKR \ 2.69% \
LIT 7.96%
DM 32.41%
LFR 0.33% BFR
8.31%
HFL 10.13%
IRL K 1.07%
Wm FF
Mié 20.62%
ESC 0.71%
Since 21/09/1989
[image:4.595.36.301.525.744.2]GRAPH 1 : BILATERAL FLUCTUATIONS OF THE ERM CURRENCIES
7.5% χ
6.0%
4.5%
3.0%
1.5%
0.0%
-1.5%
-3.0%
-4.5%
-6.0%
-7.5%
7.5%
6.0%
4.5%
3.0%
1.5%
0.0%
-1.5%
-3.0%
-4.5%
-- -6.0%
^ -7.5%
1.10.96 22.10.96 12.11.96 29.11.96
GRAPH 2: DIVERGENCE INDICATOR
TABLE II
ECU EXCHANGE RATES
=
Jf
eurostat 1985 1986 1987 1988 1989 1990 1991 1992 1993 1994 1995 95/11 95/12 96/01 96/02 96/03 96/04 96/05 96/06 96/07 96/08 96/09 96/10 96/11 01/11 04/11 05/11 06/11 07/11 08/11 11/11 12/11 13/11 14/11 15/11 18/11 19/11 20/11 21/11 22/11 25/11 26/11 27/11 28/11 29/11 B/LFR 44.9137 43.7979 43.0410 43.4285 43.3806 42.4257 42.2233 41.5932 40.4713 39.6565 38.5519 38.5585 38.6335 38.7976 38.8389 38.9145 39.1033 39.2952 39.3649 39.3623 39.1954 39.3520 39.6079 39.7803 39.7381 39.6984 39.7410 39.7329 39.6917 39.7228 39.6915 39.6664 39.7186 39.7561 39.7645 39.7774 39.7750 39.7941 39.8260 39.8169 39.8808 39.8622 39.8841 39.9191 39.9286 DKR 8.01876 7.93565 7.88472 7.95152 8.04929 7.85652 7.90859 7.80925 7.59359 7.54328 7.32804 7.26867 7.28126 7.30159 7.30591 7.31364 7.34389 7.37931 7.37905 7.36763 7.35381 7.36091 7.37211 7.41390 7.41046 7.40549 7.41123 7.40749 7.40661 7.41139 7.40631 7.39413 7.40050 7.40671 7.40985 7.41030 7.41105 7.41494 7.42171 7.42108 7.42849 7.42600 7.42896 7.43336 7.42576 DM 2.22632 2.12819 2.07153 2.07440 2.07015 2.05209 2.05076 2.02031 1.93639 1.92452 1.87375 1.87561 1.87967 1.88745 1.88865 1.89331 1.90332 1.91165 1.91356 1.91083 1.90229 1.91115 1.92291 1.93039 1.92897 1.92692 1.92890 1.92839 1.92627 1.92772 1.92594 1.92491 1.92761 1.92951 1.92972 1.92974 1.92983 1.93072 1.93225 1.93182 1.93509 1.93413 1.93539 1.93702 1.93740 DR 105.739 137.425 156.268 167.576 178.840 201.412 225.216 247.026 268.568 288.026 302.989 309.630 310.527 310.628 312.084 309.481 305.900 303.239 302.636 302.052 303.998 303.798 301.784 304.419 302.958 303.784 303.800 303.716 304.061 304.501 304.140 304.713 304.428 304.404 304.796 304.663 305.150 304.901 304.947 304.884 304.425 304.233 304.396 305.057 304.846
PTA FF
TABLE II
ECU EXCHANGE RATES
ESC 130.251 147.088 162.616 170.059 173.413 181.109 178.614 174.714 188.370 196.896 196.105 196.722 197.087 195.831 196.340 195.961 195.426 196.450 197.066 196.501 195.336 195.200 194.313 195.164 195.017 194.895 195.259 194.896 194.915 195.006 195.103 194.982 195.000 195.052 195.086 195.037 195.076 195.080 195.168 195.370 195.221 195.198 195.507 195.800 195.786 FMK 4.69423 4.97974 5.06517 4.94362 4.72301 4.85496 5.00211 5.80703 6.69628 6.19077 5.70855 5.61417 5.65231 5.73832 5.86509 5.89839 5.98340 5.93167 5.85009 5.82689 5.74750 5.75969 5.75156 5.81198 5.77992 5.78254 5.79395 5.79849 5.82226 5.81699 5.81417 5.80747 5.80599 5.81031 5.81082 5.81190 5.81774 5.82188 5.83111 5.83085 5.82635 5.82277 5.82153 5.81549 5.80905 SKR 6.52133 6.99567 7.31001 7.24192 7.09939 7.52051 7.47926 7.53295 9.12151 9.16307 9.33192 8.73139 8.64892 8.69018 8.86460 8.63156 8.49279 8.47882 8.37071 8.43833 8.49551 8.42542 8.30499 8.46235 8.35818 8.39875 8.43040 8.40311 8.43429 8.45219 8.46134 8.48399 8.50168 8.47588 8.48787 8.49170 8.49252 8.50851 8.50959 8.51160 8.46505 8.45936 8.46439 8.46285 8.45602
UKL IKR NKR
TABLE III
CONSUMER PRICE INDICES IN NATIONAL CURRENCY
1985=100=M
eurostat 1991 1992 1993 1994 1995 1995 10 11 12 1996 01 02 03 04 05 06 07 08 09 10EUR 15** 129.7 135.1 139.7 144.0 148.5 149.5 149.7 150.0 150.3p 150.8p 151.4p 152.0p 152.3p 152.4p 152.3p 152.4p 152.9p 153.0p ERM** 121.6 126.4 130.5 134.0 137.1 137.7 137.8 138.0 138.4p 139.0p 139.5p 139.7p 140.0p 139.9p 140.2p 140.2p 140.4p 140.5p Β 114.6 117.3 120.6 123.4 125.3 125.4 125.7 125.8 126.9 127.2 127.3 127.5 127.3 127.3 128.1 128.4 128.1 128.5 DK 124.1 126.7 128.3 130.8 133.6 134.2 134.5 134.4 134.3 135.0 135.8 136.1 136.6 136.5 136.3 136.5 137.2 137.4 D* 110.9 115.3 119.5 122.7 125.0 125.3 125.3 125.6 125.7 126.4 126.5 126.6 126.8 126.9 127.4 127.2 127.1 127.1 GR 265.9 308.1 352.6 391.1 427.4 439.7 440.7 445.2 444.7 443.3 458.4 464.2 467.2 469.9 458.2 458.0 471.7 476.1 E 145.0 153.5 160.6 168.1 176.0 177.5 178.0 178.4 179.6 180.1 180.7 181.8 182.4 182.2 182.4 183.0 183.5 183.6 F 120.2 123.0 125.6 127.8 129.9 130.8 130.9 131.0 131.2 131.7 132.5 132.8 133.0 132.9 132.6 132.3 132.8 133.1 IRL 121.3 125.1 126.9 129.8 133.2 133.9 134.4 135.0 135.7 I 140.0 147.3 153.8 160.0 168.3 170.5 171.6 171.9 172.3p 172.8p 173.3p 174.2p 174.9p 175.3p 175.0p 175.2p 175.7p 175.8p L 112.4 115.9 120.1 122.7 125.1 125.5 125.5 125.6 125.9 126.0 126.3 126.6 126.7 126.7 126.8 126.9 127.0 127.4 NL 108.3 111.7 114.6 117.8 120.1 120.9 120.9 120.5 121.1 121.5 122.5 122.6 122.4 121.9 122.4 122.3 123.4 123.8
Annual rate of increase (%)
44
eurostal 1991 1992 1993 1994 1995 1995 10 11 12 1996 01 02 03 04 05 06 07 08 09 10EUR 15** 5.1 4.2 3.4 3.1 3.1 3.0 3.0 3.0 2.8p 2.7p 2.7p 2.7p 2.7p 2.5p 2.5p 2.3p 2.3p 2.4p ERM** 4.4 3.9 3.2 2.7 2.3 2.2 2.2 2.2 2.0p 2.0p 2.2p 2.1p 2.2p 2.1p 2.2p 1.9p 1.9p 2.0p Β 3.2 2.4 2.8 2.4 1.5 1.2 1.5 1.5 2.0 1.9 2.0 2.0 1.9 1.8 1.9 1.9 2.0 2.5 DK 2.4 2.1 1.3 2.0 2.1 1.9 1.9 1.8 1.7 1.8 2.1 2.0 1.9 2.0 2.3 2.4 2.3 2.4 D* 3.6 4.0 3.6 2.7 1.8 1.8 1.7 1.8 1.5 1.6 1.7 1.5 1.7 1.4 1.6 1.4 1.4 1.5 GR 19.5 15.9 14.5 10.9 9.3 8.3 8.2 8.1 8.4 8.5 9.1 9.2 9.1 8.8 8.6 8.5 8.5 8.3 E 6.0 5.9 4.6 4.7 4.7 4.4 4.5 4.3 3.9 3.7 3.4 3.5 3.8 3.6 3.7 3.7 3.5 3.5 F 3.2 2.4 2.1 1.7 1.8 1.8 1.9 2.1 2.0 2.0 2.3 2.4 2.4 2.3 2.3 1.6 1.6 1.8 IRL 3.1 3.1 1.4 2.3 2.6 2.4 2.0 1.4 1.4 I 6.3 5.2 4.5 4.0 5.2 5.5 5.7 5.6 5.4p 4.9p 4.5p 4.6p 4.4p 3.9p 3.6p 3.3p 3.4p 3.1p L 3.1 3.2 3.6 2.2 1.9 1.6 1.3 1.3 1.1 1.0 1.2 1.5 1.4 1.2 1.3 1.4 1.3 1.5 NL 3.9 3.2 2.6 2.8 1.9 1.3 1.6 1.7 1.9 1.8 2.1 2.0 2.0 1.8 2.2 1.9 2.0 2.4 p=provisional
* New Consumer Price Indices series for Germany, backdated, taking into account German reunification on 3 October 1990.
TABLE III
CONSUMER PRICE INDICES IN NATIONAL CURRENCY 1985=100 A 115.1 119.7 124.0 127.7 130.5 130.7 130.6 130.5 131.2 131.8 132.4 132.3 132.1 132.8 134.0 134.8 133.7 133.4p Ρ 189.6 206.7 220.0 231.5 241.1 243.0 243.2 242.7 243.4 245.1 246.1 248.3 249.5 249.2 249.7 250.4 250.4 250.2 FIN 132.8 136.7 139.7 141.2 142.6 142.9 142.5 142.4 142.6 143.1 143.3 143.5 143.8 143.8 143.7 143.4 143.7 143.9 S 147.8 151.1 158.2 161.6 165.7 167.1 167.0 166.5 166.2 166.4 167.2 167.5 167.3 166.7 166.3 165.5 166.5 166.4 UK 141.1 146.4 148.7 152.4 157.6 158.3 158.3 159.3 158.8 159.5 160.1 161.3 161.6 161.7 161.1 161.8 162.6 162.6 IS 267.5 278.1 289.5 294.0 298.8 302.1 301.0 300.8 302.1 302.6 303.1 303.6 305.5 305.2 305.5 307.4 308.1 308.3 Ν 140.0 143.3 146.5 148.6 152.2 153.0 152.9 152.9 152.2 152.3 153.0 153.5 153.7 153.9 154.5 154.4 155.1 155.7 CH 119.8 124.6 128.7 129.8 132.2 132.5 132.4 132.4 132.8 133.1 133.3 133.4 132.9 133.2 133.0 133.3 133.4 133.6 USA 126.6 130.5 134.3 137.8 141.7 142.9 142.8 142.7 143.6 144.0 144.8 145.3 145.6 145.7 146.0 146.3 146.7 147.2 JAP 110.4 112.3 113.8 114.6 114.4 114.4 114.2 114.3 114.2 114.0 114.2 115.Or 115.2r 114.8r 114.7r 114.4r 114.9r 114.5p CAN 131.4 133.4 135.8 136.1 139.0 139.3 139.6 139.4 139.7 140.0 140.5 140.9 141.3 141.2 141.2 141.3 141.5 141.8
=441
eurostat 1991 1992 1993 1994 1995 1995 10 11 12 1996 01 02 03 04 05 06 07 08 09 10Annual rate of increase (%) A 3.3 4.0 3.6 3.0 2.2 1.9 1.9 1.8 1.7 1.6 1.8 1.6 1.5 1.6 1.9 1.8 2.0 2.1p Ρ 10.9 9.0 6.4 5.2 4.1 4.0 3.9 3.4 2.5 2.5 2.4 2.9 3.5 3.6 3.9 3.6 3.4 3.0 FIN 4.3 2.9 2.2 1.1 1.0 0.3 0.3 0.3 0.5 0.5 0.6 0.7 0.8 0.4 0.5 0.4 0.5 0.7 S 9.6 2.6 4.7 2.3 2.9 2.7 2.7 2.6 2.0 1.7 1.7 1.3 1.0 0.8 0.6 0.3 0.2 -0.1 UK 5.9 3.7 1.6 2.5 3.4 3.2 3.1 3.2 2.9 2.7 2.7 2.4 2.2 2.1 2.2 2.1 2.1 2.7 IS 6.8 4.0 4.1 1.6 1.7 2.4 2.1 2.0 1.6 1.7 2.0 2.3 2.8 2.6 2.4 2.6 2.5 2.1 Ν 3.4 2.3 2.3 1.4 2.5 2.3 2.1 2.2 1.2 0.9 0.7 1.0 1.0 0.9 1.3 1.5 1.3 1.7 CH 5.8 4.0 3.3 0.9 1.8 1.9 1.9 1.9 1.5 0.8 0.9 0.9 0.7 0.7 0.7 0.6 0.6 0.8 USA 4.2 3.0 3.0 2.6 2.8 2.8 2.6 2.5 2.7 2.7 2.8 2.9 2.9 2.8 3.0 2.9 3.0 3.0 JAP 3.3 1.7 1.3 0.7 -0.1 -0.7 -0.7 -0.3 -0.4 -0.2 0.1 0.4r 0.3r O.Or 0.6r 0.2r -0.1r 0.1p CAN 5.6 1.5 1.8 0.2 2.2 2.4 2.1 1.7 1.6 1.3 1.4 1.4 1.5 1.4 1.2 1.4 1.5 1.8
1=441
eurostat 1991 1992 1993 1994 1995 1995 10 11 12 1996 01 02 03 04 05 06 07 08 09 10n.a. = not available r=revised
TABLE IV
CONSUMER PRICE INDICES IN ECU
1985=100=ty
eurostat 1991 1992 1993 1994 1995 1995 10 11 12 1996 01 02 03 04 05 06 07 08 09 10 EUR 15** 124.7 128.2 128.2 131.1 132.8 133.7 134.0 134.6 135.1p 135.7p 136.5p 137.4p 138.1p 138.4p 138.2p 138.1p 138.9p 139.5p ERM** 123.4 128.1 132.5 135.6 140.7 141.5 141.9 142.0 142.3p 142.6p 143.0p 143.1p 142.8p 142.4p 142.8p 143.0p 142.8p 142.5p ECU** 122.2 126.8 131.0 134.6 138.0 138.8 138.9 139.2 139.5p 140.0p 140.5p 140.9p 141.1p 141.1p 141.3p 141.3p 141.6p 141.8p Β 121.9 126.7 133.8 139.8 146.0 146.4 146.5 146.2 146.9 147.1 146.9 146.4 145.4 145.2 146.2 147.1 146.3 145.7 DK 125.8 130.1 135.5 139.1 146.2 148.2 148.4 148.0 147.5 148.2 148.9 148.6 148.4 148.3 148.3 148.9 149.5 149.5 D* 120.4 127.1 137.3 142.0 148.5 149.1 148.7 148.8 148.3 149.0 148.7 148.1 147.7 147.7 148.4 148.9 148.1 147.2 GR 122.9 129.9 136.7 141.3 146.8 148.8 148.1 149.2 149.0 147.8 154.1 157.9 160.3 161.6 157.9 156.8 161.6 164.2 E 145.5 149.6 139.3 136.4 139.3 141.3 142.4 143.9 145.6 145.9 146.2 147.7 147.4 145.6 145.7 146.3 146.9 146.3 F 117.1 122.1 128.7 131.8 135.4 136.0 137.5 137.4 137.9 137.8 138.9 139.7 139.7 139.2 139.3 138.4 138.6 139.1 IRL 113.0 117.6 113.6 117.0 116.8 116.9 116.3 116.8 117.8 118.0 118.0 119.6 121.1 122.0 122.5 121.9 123.1 124.1 I 132.1 133.9 121.0 120.9 114.3 116.2 117.6 119.5 121.8p 123.4p 125.2p 127.4p 130.2p 131.2p 130.5p 130.2p 131.7p 132.6p L 119.6 125.2 133.3 139.0 145.8 146.5 146.2 146.0 145.7 145.7 145.7 145.5 144.9 144.5 144.7 145.4 144.9 144.4Annual rate of increase (%)
M
eurostat 1991 1992 1993 1994 1995 1995 10 11 12 1996 01 02 03 04 05 06 07 08 09 10EUR 1 5 " 5.0 2.9 0.0 2.3 1.2 1.4 1.6 2.0 2.4p 2.7p 4.4p 5.0p 4.6p 4.5p 4.4p 3.3p 3.5p 4.3p ERM** 4.0 3.8 3.4 2.3 3.8 3.4 3.6 3.7 3.4p 2.9p 2.2p 1.5p 1.5p 0.9p 1.0p 1.3p 1.2p 0.7p ECU" 4.4 3.8 3.3 2.8 2.5 2.4 2.5 2.5 2.4p 2.4p 2.4p 2.3p 2.3p 2.1p 2.2p 2.0p 2.0p 2.2p Β 3.7 4.0 5.7 4.5 4.4 3.8 3.6 3.2 2.9 2.1 0.3 -0.6 -0.7 -1.0 -0.6 0.7 0.4 -0.5 DK 1.7 3.4 4.2 2.7 5.1 5.3 5.0 4.8 4.3 4.0 3.5 1.3 0.6 0.6 1.0 1.7 1.5 0.9 D* 3.7 5.6 8.1 3.4 4.6 4.3 3.8 3.5 2.2 1.6 -0.5 -1.2 -1.1 -1.2 -0.7 0.4 0.0 -1.3 GR 6.9 5.8 5.3 3.4 3.9 3.4 3.0 2.8 3.2 3.3 6.3 7.7 8.5 8.3 9.0 8.0 8.6 10.3 E 6.7 2.9 -6.9 -1.9 2.1 2.7 3.4 4.9 7.4 7.0 9.8 8.6 5.9 3.9 3.4 3.4 4.0 3.5 F 2.3 4.2 5.4 2.4 2.7 2.3 3.5 3.8 3.7 3.2 3.6 3.1 4.2 3.3 2.8 1.4 1.5 2.3 IRL 3.1 4.1 -3.4 3.1 -0.2 -0.7 -1.2 -1.0 -0.4 0.8 3.1 3.4 3.8 4.7 4.9 3.5 4.3 6.2 I 5.5 1.4 -9.5 0.0 -5.4 -3.0 -1.4 0.8 3.0p 5.4p 16.1p 21.4p 17.3p 17.4p 15.6p 11.2p 11.6p 14.1p L 3.6 4.7 6.5 4.3 4.9 4.1 3.5 3.0 2.1 1.2 -0.5 -1.1 -1.2 -1.5 -1.2 0.2 -0.2 -1.4 p=provisional
* New Consumer Price Indices series for Germany, backdated, taking into account German reunification on 3 October 1990.
" These aggregates are new series, backdated, taking into account the new German CPI and Incorporating new weights for Germany.
TABLE IV
CONSUMER PRICE INDICES IN ECU
1985=100 NL 117.7 123.3 132.3 137.1 143.7 144.9 144.5 143.8 143.8 144.2 145.2 144.7 143.8 142.8 143.3 143.9 144.6 144.1 A 124.7 131.7 142.4 147.5 154.9 155.3 154.8 154.3 154.6 155.2 155.6 154.6 153.6 154.3 155.9 157.5 155.6 154.3p Ρ 137.9 153.8 152.1 152.8 159.7 160.4 160.7 160.0 161.5 162.2 163.2 165.1 165.0 164.3 165.2 166.6 166.7 167.3 FIN 124.8 110.9 98.0 107.2 117.3 118.9 119.1 118.2 116.7 114.6 114.0 112.6 113.8 115.4 115.7 117.1 117.1 117.4 S 128.8 131.0 113.2 115.1 116.0 120.7 124.7 125.5 124.7 122.4 126.3 128.6 128.7 129.8 128.5 127.0 128.8 130.6 UK 118.5 117.2 112.2 115.6 111.9 111.2 110.0 110.6 110.7 111.9 112.3 113.8 115.6 117.1 115.9 115.0 117.5 120.5 IS n.a. n.a. n.a. n.a. n.a. n.a. n.a. n.a. n.a. n.a. n.a. n.a. n.a. n.a. n.a. n.a. n.a. n.a. Ν 113.7 116.0 114.8 115.5 119.6 120.8 120.3 120.0 119.6 120.2 120.9 121.7 122.0 122.4 122.7 122.1 123.2 124.2 CH 125.4 127.2 138.1 148.6 158.7 162.3 162.4 161.8 161.7 160.3 161.3 160.5 157.6 156.9 157.5 160.3 158.4 156.6 USA 77.7 76.4 86.9 87.9 82.1 81.9 81.7 82.9 84.2 84.7 85.6 87.1 88.5 88.1 87.0 86.3 87.6 88.6 JAP 119.9 123.6 158.3 170.4 168.7 155.0 152.9 155.4 151.0 151.1 151.9 153.1r 156.8r 151.8r 149.0r 149.2r 148.7r 146.2p CAN 96.0 88.2 92.9 86.8 80.1 80.9 80.6 80.7 81.8 81.6 83.0 84.8 85.5 85.3 83.9 82.9 84.1 86.2
1=441
eurostat 1991 1992 1993 1994 1995 1995 10 11 12 1996 01 02 03 04 05 06 07 08 09 10Annual rate of increase (%)
NL 3.9 4.8 7.3 3.6 4.8 3.9 3.8 3.4 2.8 1.9 0.1 -0.6 -0.6 -0.9 -0.3 0.8 0.5 -0.5 A 3.4 5.6 8.1 3.6 5.0 4.4 4.0 3.6 2.4 1.8 -0.3 -1.0 -1.3 -1.0 -0.5 0.8 0.5 -0.7p Ρ 12.5 11.5 -1.0 0.6 4.6 3.5 3.3 2.8 2.6 2.0 1.8 3.1 3.2 3.3 3.8 3.6 4.0 4.3 FIN 1.3 -11.1 -11.4 9.4 9.5 4.8 4.8 4.5 3.0 0.1 -1.6 -3.5 -3.0 -1.8 -1.6 -2.0 -1.7 -1.2 S 9.9 1.8 -13.5 1.7 0.8 3.8 7.2 8.0 8.5 6.4 12.6 17.2 14.6 16.0 14.8 11.0 9.1 8.3 UK 7.9 -1.0 -3.9 3.1 -3.2 -3.3 -4.7 -5.0 -3.9 -1.9 0.7 2.4 3.4 4.9 5.4 2.6 3.8 8.4 IS n.a. n.a. n.a. n.a. n.a. n.a. n.a. n.a. n.a. n.a. n.a. n.a. n.a. n.a. n.a. n.a. n.a. n.a. Ν 2.5 2.0 -1.0 0.6 3.5 3.5 3.3 2.7 1.5 1.5 1.1 2.3 2.4 2.3 2.7 1.9 2.0 2.8 CH 5.3 1.5 8.6 7.7 6.9 7.3 8.5 8.5 6.5 4.7 1.6 -0.1 -0.7 -1.4 -0.1 1.7 -1.4 -3.5 USA 7.4 -1.2 14.0 1.4 -6.6 -2.0 -3.6 -4.4 -1.3 0.3 5.7 9.2 9.0 9.2 9.0 4.5 4.6 8.2 JAP 14.2 3.4 28.3 8.3 -1.0 -7.5 -10.2 -8.5 -9.6 -9.3 -12.0 -16.7r -15.1r -17.5r -15.0r -10.7r -7.3r -5.7p CAN 10.9 -7.6 5.6 -6.5 -7.5 -2.0 -3.3 -3.8 0.9 0.7 7.4 9.1 6.9 8.7 6.5 1.7 1.6 6.5
=441
eurostat 1991 1992 1993 1994 1995 1995 10 11 12 1996 01 02 03 04 05 06 07 08 09 10n.a. = not available r=revised
p=provisional r=revised
TABLE
V
ECU BOND ISSUES (Mio ECU) *
OL
eurostat
1989 1990 1991 1992 1993 1994 1995
1994 IV
1995 I II III IV
1996 I II III
1996 9 10 11
TOTAL EURO
11 127 15 040
27 163 19 242
6 870
6 485
5 596
1 315
2 375 281
2 375 565
605 870
1 330
605 165 55
European Union
Total
6 461 10 525 19 266 11 675 5 020 5010 5 046
915
2 075 31 2 375 565
605 870 1 330
605 165 55
Business sector 4 400 3 990 6 581 4 870 1 565 1 825 956
350
525 31 50 350
605 315 1 030
455 55 55
Govern-ments 500 5 000 7 900 2 475 250 1 300 3 075
0
900 0 2 175 0
0 55 0
0 60 0
Institu-tions 1 561 1 535 4 785 4 330 3 205 1 885 1 015
565
650 0 150 215
0 500 300
150 50 0
Non-European Union
Total
4 666 4515 7 897 7 567 1 850 1 475 550
400
300 250 0 0
0 0 0
0 0 0
Business sector 4141 3 565 3 932 3 902 250 1 075 550
400
300 250 0 0
0 0 0
0 0 0
Govern-ments 425 550 3 790 2 850 1 600 400 0
0
0 0 0 0
0 0 0
0 0 0
Organi-sations
100 400 175 815 0 0 0
0
0 0 0 0
0 0 0
0 0 0
Domestic**
1 652 2 857
3 134 4151 6 508 7311 6 784
1 033
2 939 1 075 2 050 720
2 073 2 247 1 905
589 1 139
517
EURO + DOMESTIC
12 779 17 897
30 297 23 393 13 378 13 796 12 380
2 348
5 314 1 356
4 425 1 285
2 678 3117 3 235
1 194 1 304 572
(*) Recording based on the payment date (**) Only domestic issues which can be assimilated with Eurobonds
TABLE VI
LAST MONTH'S ECU BOND ISSUES
sa
eurostat
Issue Payment
Date
14.11.1996 28.11.1996
14.11.1996 28.11.1996
15.11.1996 1212.1996
22.11.1996 10.01.1997
28.11.1996 16.01.1997
Borrower & country
France OAT
France OAT
ANTS (UK)
Amount Issued
(Mio Ecu)
335
182
100
CNCA(FR) 100
Crédit Local de France 100
I
Issue Price
105.07
Coupon
7
100.23 Í 6
I
I
101.055 < 5
72.918
101.40 zero
5.5
Term (years)
9+5m
7+5m
4
6
5+11m
Maturity
25.04.2006
25.04.2004
12.12.2000
10.01.2003
16.12.2002
Yield %
6.26
5.95
4.70
5.40
5.22
Lead Manager
Auct
Auct
Paribas
CNCA/KB
BIL et Crédit Communal
de Belgique
Listing
PA
PA
LN
LU
LU
Notice
FG
FG
IS
CSI S
TABLE VII
OUTSTANDING AMOUNT OF ECU BONDS (IN MILLIONS OF ECU)
=4^
eurostat 29/11/96 31/10/96 30/09/96 31/12/95 31/12/94 31/12/93 Issuers GOV SUPRA Others Total GOV SUPRA Others Total GOV SUPRA Others Total GOV SUPRA Others Total GOV SUPRA Others Total GOV SUPRA Others Total <1 9446 2 934 5 537 17 917 10 155 2 799 6 158 19 112 10 361 3 349 6 494 20 204 12 526 3 047 6 963 22 536 11 288 2610 9315 23 213 9 942 3 125 10 567 23 634 1-3 30 694 5 290 7 907 43 891 29 208 5 340 7 807 42 355 28 708 5 040 7 842 41590 25 5895 732
9 954
41275
20 359
6 359 12 235
38 953
22 316
5 457 16 094
43 867
Residual ma 3-5 13 782
7 005
7 411
28 198
15 282
5 855
7 511
28 648
14 468
6 155
6 441
27 064
19 483
5 150
6 099
30 732
21 093
4 900
7 654
33 647
15 040
5 657
8 254
28 951
urity in years
5-7
6 929
1 595
1 632
10 156 6 929
2 845
1 582
11356 7 429
2 845
2 842
13 116
10 746
4 900
4 337
19 983
10 021
5 170
5 134
20 325 6 263
3 480
4 099
13 842
7-10
9 802 700
2 381
12 883 9 285 700
2 376
12 361 8 960 700
2 321
11981 7 468 700 1 438 9 606 10 235 2 200 2 177 14 612 9 781 4 360 3 428 17 569 >10 4 750 600 625 5 975 4 750 600 625 5 975 4 750 600 625 5 975 4 750 600 1 325 6 675 5 750 600 1 325 7 675 7 048 1 000 2 426 10 474 Total
75 403 18 124 25 493 119 020 75 609 18 139 26 059 119 807 74 676 18 689 26 565 119 930 80 562 20 129
30 116 130 807 78 746 21 839
37 840 138 425 70 390
23 079 44 868 138 337
GOV = Central governments SUPRA = Supranational institutions
TABLE VIII
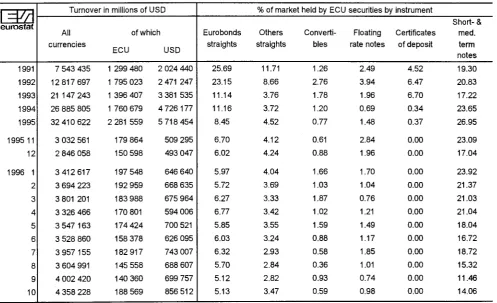
TOTAL SECONDARY MARKET TURNOVER AND % OF MARKET TAKEN BY ECU SECURITIES
=441
eurostat 1991 1992 1993 1994 1995 1995 11 12 1996 1 2 3 4 5 6 7 8 9 10 Turnover All currencies7 543 435 12 817 697 21 147 243 26 885 805 32 410 622
3 032 561 2 846 058
3 412 617 3 694 223 3 801 201 3 326 466 3 547 163 3 528 860 3 957 155 3 604 991 4 002 420 4 358 228
in millions of USD
of which
ECU
1 299 480 1 795 023 1 396 407 1 760 679 2 281 559
179 864 150 598 197 548 192 959 183 988 170 801 174 424 158 378 182 917 145 558 140 360 188 569 USD
2 024 440 2 471 247 3 381 535 4 726 177 5 718 454
509 295 493 047 646 640 668 635 675 964 594 006 700 521 626 095 743 007 688 607 699 757 856 512 Eurobonds straights 25.69 23.15 11.14 11.16 8.45 6.70 6.02 5.97 5.72 6.27 6.77 5.85 6.03 6.32 5.70 5.12 5.13
% of market held by ECU securities
TABLE IX
OPERATION RATES OF THE EMI (CALCULATION MONTH, APPLICABLE THE FOLLOWING MONTH) AND INTEREST RATES AND YIELDS OF ECU INVESTMENTS (%)
M
eurostat 1991 1992 1993 1994 1995 1995 6 7 8 9 10 11 12 1996 1 2 3 4 5 6 7 8 9 10 11 EMI* 10.10 10.29 8.21 5.92 5.88 6.00 6.00 5.75 5.50 5.50 5.75 5.25 5.25 4.75 4.50 4.50 4.25 4.25 4.25 4.25 4.25 4.00 4.00Deposits (maturity in months) 1 9.73 10.43 8.27 5.95 5.85 6.08 5.96 5.73 5.47 5.66 5.43 5.31 4.83 4.62 4.56 4.38 4.31 4.35 4.33 4.28 4.14 4.06 4.07 3 9.80 10.41 7.99 5.98 5.90 6.08 5.96 5.73 5.47 5.66 5.42 5.22 4.75 4.57 4.54 4.35 4.24 4.34 4.34 4.29 4.15 4.06 4.07 6 9.84 10.27 7.65 6.05 5.98 6.10 5.99 5.75 5.47 5.66 5.41 5.16 4.70 4.53 4.54 4.34 4.23 4.35 4.37 4.32 4.17 4.07 4.09 12 9.83 10.01 7.11 6.21 6.15 6.20 6.12 5.83 5.52 5.67 5.40 5.12 4.68 4.54 4.61 4.41 4.29 4.49 4.53 4.44 4.28 • 4.12 4.15 1 7.30 6.34 6.23 6.27 6.18 5.89 5.59 5.66 5.39 5.12 4.69 4.54 4.63 4.50 4.37 4.58 4.59 4.56 4.38 4.20 4.23 2 6.89 6.76 6.66 6.66 6.60 6.31 5.97 6.05 5.76 5.43 4.95 4.98 5.17 4.93 4.82 5.03 5.02 4.90 4.66 4.36 4.41
Yield on ECU bonds (maturity in years) 3 6.75 6.99 6.99 6.97 6.93 6.66 6.35 6.45 6.13 5.76 5.29 5.41 5.65 5.37 5.28 5.44 5.42 5.28 5.03 4.66 4.70 4 6.79 7.12 7.25 7.22 7.19 6.94 6.69 6.82 6.46 6.10 5.67 5.81 6.06 5.78 5.71 5.82 5.78 5.67 5.42 5.03 5.03 5 6.92 7.22 7.46 7.41 7.41 7.17 6.99 7.13 6.75 6.39 6.00 6.15 6.40 6.14 6.08 6.15 6.10 6.02 5.78 5.39 5.36 6 7.05 7.37 7.63 7.55 7.60 7.36 7.22 7.37 6.99 6.62 6.25 6.42 6.66 6.41 6.37 6.45 6.38 6.30 6.07 5.69 5.63 7 7.15 7.53 7.76 7.65 7.74 7.50 7.39 7.54 7.16 6.79 6.44 6.65 6.85 6.61 6.59 6.70 6.62 6.51 6.30 5.93 5.86 8 7.21 7.64 7.84 7.72 7.82 7.59 7.51 7.66 7.29 6.92 6.59 6.83 7.01 6.77 6.77 6.89 6.80 6.68 6.47 6.12 6.04 9 7.23 7.67 7.88 7.77 7.83 7.64 7.59 7.73 7.37 7.03 6.74 7.00 7.17 6.91 6.91 7.01 6.92 6.81 6.61 6.27 6.19 10 7.20 7.54 7.86 7.82 7.74 7.65 7.63 7.78 7.41 7.14 6.92 7.16 7.34 7.05 7.04 7.07 6.99 6.92 6.72 6.39 6.32
(*) See explanatory notes
DAILY RATES
M
eurostat 1.11.96 4.11.96 5.11.96 6.11.96 7.11.96 8.11.96 11.11.96 12.11.96 13.11.96 14.11.96 15.11.96 18.11.96 19.11.96 20.11.96 21.11.96 22.11.96 25.11.96 26.11.96 27.11.96 28.11.96 29.11.96Deposits (maturity in months)
1 4.06 4.07 4.10 4.06 4.06 4.06 4.06 4.06 4.06 4.06 4.06 4.06 4.06 4.06 4.06 4.06 4.06 4.06 4.06 4.13 4.11 3 4.06 4.08 4.13 4.06 4.06 4.06 4.06 4.06 4.06 4.06 4.06 4.06 4.06 4.06 4.06 4.07 4.06 4.07 4.06 4.07 4.07 6 4.09 4.11 4.13 4.09 4.09 4.08 4.09 4.09 4.09 4.09 4.09 4.07 4.06 4.08 4.09 4.09 4.09 4.09 4.09 4.09 4.09 12 4.16 4.17 4.19 4.14 4.17 4.14 4.14 4.14 4.16 4.15 4.16 4.13 4.13 4.13 4.16 4.16 4.16 4.16 4.15 4.16 4.13 1 4.26 4.29 4.26 4.25 4.24 4.25 4.21 4.24 4.24 4.21 4.18 4.20 4.15 4.20 4.26 4.24 4.24 4.23 4.21 4.23 4.15 2 4.42 4.48 4.46 4.42 4.42 4.43 4.41 4.42 4.42 4.42 4.39 4.36 4.36 4.39 4.43 4.43 4.43 4.39 4.39 4.39 4.33
GRAPH 3: ECU YIELD CURVE
sa
eurostat 8.0%
7.0%
--6.0%
5.0%
4.0%
Yield
4 5 6
Maturity (years)
■29-11-96 — — 3 1 - 1 0 - 9 6 30-11-95
10
GRAPH 4: EVOLUTION OF ECU YIELDS
ma
eurostat 8.0%
7.0%
6.0%
5.0%
--4.0%
12 1
I 1995 I
Yield
2 3 4 5 6 7
1996
8 9 10 11
• 2 y ears ""■""""~ 10 years
TABLE Χ
CENTRAL BANK INTEREST RATES
L ^
Β DK GRDR AUCT AR CR DR REPO CD DR LR REPO 3D TB DR LR OR REPO AR RATES AT THE END OF:
11/95 12/95 01/96 02/96 03/96 04/96 05/96 06/96 07/96 08/96 09/96 10/96 11/96
3.50 3.00 3.00 3.00 3.00 2.50 2.50 2.50 2.50 2.50 2.50 2.50 2.50
3.95 3.75 3.55 3.30 3.30 3.30 3.20 3.20 3.20 3.00 3.00 3.00 3.00
5.20 5.00 4.65 4.55 4.55 4.55 4.45 4.45 4.45 4.25 4.25 4.25 4.25
3.95 3.75 3.40 3.30 3.30 3.30 3.20 3.20 3.20 3.00 3.00 3.00 3.00
4.75 4.25 4.00 4.00 3.75 3.25 3.25 3.25 3.25 3.25 3.25 3.25 3.25
5.00 4.60 4.35 4.25 4.00 3.80 3.80 3.70 3.70 3.50 3.50 3.50 3.50
5.00 4.60 4.35 4.25 4.00 3.80 3.80 3.70 3.70 3.50 3.50 3.50 3.50
3.50 3.00 3.00 3.00 3.00 2.50 2.50 2.50 2.50 2.50 2.50 2.50 2.50
5.50 5.00 5.00 5.00 5.00 4.50 4.50 4.50 4.50 4.50 4.50 4.50 4.50
3.98 3.75 3.55 3.30 3.30 3.30 3.30 3.30 3.30 3.00 3.00 3.00 3.00
4.50 4.50 4.50 4.50 4.50 3.10 3.10 3.10 3.10 3.10 3.10 3.10 3.10
18.50 18.00 18.00 18.00 18.00 17.50 17.50 17.50 17.50 17.50 17.50 17.50 17.50
22.00 21.50 21.50 21.50 21.50 21.00 21.00 21.00 21.00 21.00 21.00 21.00 21.00
27.00 27.00 27.00 27.00 27.00 26.00 26.00 26.00 26.00 26.00 26.00 26.00 26.00
9.25 9.00 8.75 8.75 8.25 7.75 7.50 7.25 7.25 7.25 7.25 6.75 6.75
9.30 9.05 8.80 8.80 8.35 7.85 7.60 7.35 7.35 7.35 7.35 6.85 6.85
RECENT ACTUAL CHANGES
01.10.96 02.10.96 03.10.96 04.10.96 07.10.96 08.10.96 09.10.96 10.10.96 11.10.96 14.10.96 15.10.96 16.10.96 17.10.96 18.10.96 21.10.96 22.10.96 23.10.96 24.10.96 25.10.96 28.10.96 29.10.96 30.10.96 31.10.96 01.11.96 04.11.96 05.11.96 06.11.96 07.11.96 08.11.96 11.11.96 12.11.96 13.11.96 14.11.96 15.11.96 18.11.96 19.11.96 20.11.96 21.11.96 22.11.96 25.11.96 26.11.96 27.11.96 28.11.96 29.11.96
7.38 6.75 6.85
Please see explanatory notes at the end of the publication for the key to the various rates. Data series with the same abbreviation are not necessarily internationally comparable.
TABLE Χ
CENTRAL BANK INTEREST RATES
IRL I NL
[ΜΞ
AUCT REPO STF DR LR REPO R-REPO SPR AR DR LR REPO PRR SFR DRR DRO PRO 4.80
4.45 4.20 3.90 3.80 3.70 3.70 3.60 3.55 3.35 3.25 3.25 3.20
6.10 5.85 5.60 5.60 5.50 4.90 4.90 4.90 4.90 4.75 4.75 4.75 4.75
7.00 6.50 6.50 6.50 6.50 6.25 6.25 6.25 6.25 6.25 6.25 6.25 6.25
9.00 9.00 9.00 9.00 9.00 9.00 9.00 9.00 8.25 8.25 8.25 7.50 7.50
10.50 10.50 10.50 10.50 10.50 10.50 10.50 10.50 9.75 9.75 9.75 9.00 9.00
10.52 10.50 9.88 10.01 9.98 9.32 9.38 8.75 8.70 8.58 8.22 8.22 8.01
RATES AT THE END OF:
9.29 9.29 9.29 9.29 9.29 8.61 8.08
3.60 3.40 3.20 3.00 2.90 2.70 2.60 2.60 2.70 2.50 2.50 2.50 2.50
3.25 2.75 2.75 2.75 2.50 2.00 2.00 2.00 2.00 2.00 2.00 2.00 2.00
3.50 3.00 3.00 3.00 3.00 2.50 2.50 2.50 2.50 2.50 2.50 2.50 2.50
5.25 5.25 5.25 5.25 5.25 4.75 4.75 4.75 4.75 4.75 4.75 4.75 4.75
4.05 3.75 3.65 3.50 3.50 3.50 3.50 3.50 3.50 3.50 3.40 3.40 3.40
8.750 8.500 8.250 8.000 7.800 7.500 7.500 7.500 7.500 7.500 7.250 7.000
11.00 10.50 10.50 10.50 10.25 9.00 9.00 9.00 9.00 9.00 9.00 9.00
8.25 7.75 7.75 7.75 7.50 6.80 6.80 6.80 6.80 6.80 6.80 6.80
8.250 7.750 7.750 7.750 7.500 6.800 6.800 6.800 6.800 6.800 6.800 6.800
8.750 8.501 8.250 8.000 7.900 7.500 7.500 7.500 7.500 7.500 7.250 7.000
11/95 12/95 01/96 02/96 03/96 04/96 05/96 06/96 07/96 08/96 09/96 10/96 11/96 RECENT ACTUAL CHANGES
8.38
8.59
8.60
8.61
7.50 9.00
7.100
7.100
7.000
7.102 7.000
10.96 10.96 10.96 10.96 10.96 10.96 10.96 10.96 10.96 10.96 10.96 10.96 10.96 10.96 10.96 10.96 10.96 10.96 10.96 10.96 10.96 10.96 10.96
3.20
8.30 8.05
8.03
8.08
7.93 8.01
11.96 11.96 11.96 11.96 11.96 11.96 11.96 11.96 11.96 11.96 11.96 11.96 11.96 11.96 11.96 11.96 11.96 11.96 11.96 11.96 11.96
Please see explanatory notes at the end of the publication for the key to the various rates. Data series with the same abbreviation are not necessarily internationally comparable.
T A B L E Χ
CENTRAL BANK INTEREST RATES
^Δ
FIN UK IS CH US JAPBR TR AR DR AR REPO IBR BR DR REPO CD AR DR LR DR FED DR
11/95 12/95 01/96 02/96 03/96 04/96 05/96 06/96 07/96 08/96 09/96 10/96 11/96
5.00 4.75 4.75 4.50 4.50 4.50 4.50 4.50 4.50 4.50 4.00 4.00 4.00
4.75 4.25 4.25 4.25 3.75 3.75 3.75 3.60 3.50 3.25 3.10 3.00 3.00
6.75 6.75 6.25 6.25 5.75 5.75 5.75 5.60 5.50 5.25 5.10 5.00 5.00
7.00 7.00 6.00 6.00 6.00 5.50 5.50 5.50 4.50 4.50 4.50 3.50 3.50
9.50 9.50 9.50 9.00 8.25 8.25 7.50 6.75 6.75 6.25 6.25 5.75 5.75
8.91 8.91 8.45 8.05 7.40 6.90 6.50 6.10 5.55 5.25 5.05 4.60 4.35
RATES AT THE END OF:
9.40 9.40 8.40 8.30 7.90 7.75 7.75 7.25 7.25 7.25 6.95 6.05 6.05
6.75 6.50 6.25 6.25 6.00 6.00 6.00 5.75 5.75 5.75 5.75 6.00 6.00
5.60 5.60 5.60 5.60 5.60 5.60 5.60 5.60 5.60 5.60 5.60 6.00 6.00
6.50 6.50 6.50 6.50 6.50 6.50 6.50 6.50 6.50 6.50 6.90 6.90 6.90
4.40 4.40 4.40 4.40 4.40 4.40 4.40 4.40 4.40 4.40 5.70 5.70 5.70
6.75 6.75 6.75 6.75 6.50 6.50 6.50 6.50 6.50 6.50 6.50 6.50 6.00
2.00 1.50 1.50 1.50 1.50 1.50 1.50 1.50 1.50 1.50 1.00 1.00 1.00
4.375 5.375 3.875 3.500 4.125 3.750 4.875 5.125 4.625 4.000 3.500 3.750 4.000
5.25 5.25 5.00 5.00 5.00 5.00 5.00 5.00 5.00 5.00 5.00 5.00 5.00
5.75 5.50 5.25 5.25 5.25 5.25 5.25 5.25 5.25 5.25 5.25 5.25 5.25
0.50 0.50 0.50 0.50 0.50 0.50 0.50 0.50 0.50 0.50 0.50 0.50 0.50 RECENT ACTUAL CHANGES
01.10.96 02.10.96 03.10.96 04.10.96 07.10.96 08.10.96 09.10.96 10.10.96 11.10.96 14.10.96 15.10.96 16.10.96 17.10.96 18.10.96 21.10.96 22.10.96 23.10.96 24.10.96 25.10.96 28.10.96 29.10.96 30.10.96 31.10.96
3.00 5.00
3.50
4.95 6.05
6.00
4.85
5.75 4.60 6.00
3.375 3.500
3.625
3.500
3.625 3.750
01.11.96 04.11.96 05.11.96 06.11.96 07.11.96 08.11.96 11.11.96 12.11.96 13.11.96 14.11.96 15.11.96 18.11.96 19.11.96 20.11.96 21.11.96 22.11.96 25.11.96 26.11.96 27.11.96 28.11.96 29.11.96
6.00
4.35
3.625
3.750 3.625
3.750
3.625
3.875 4.125 4.000
Please see explanatory notes at the end of the publication for the key to the various rates. Data series with the same abbreviation are not necessarily internationally comparable.
[image:18.595.40.545.47.734.2]EVOLUTION OF CENTRAL BANK INTEREST RATES OVER THE LAST 12 MONTHS
V37Ä
eurostat
10
7
--DR -CR
0
7
4
-M
DR • CD~ ~ι- ^ - χ _ »™,«™-™
1
1.12.95 2.4.96 1.8.96 29.11.96 1.12.95 2.4.96 1.8.96 29.11.96
10
a
•DR•LR Repo
4
-1
•Repo -AR
30 -ι
25
20
-- £ H ]
—'
DR l
- LR ·
1
1.12.95 2.4.96 1.8.96 29.11.96
10T
LD
1.12.95 2.4.96 1.8.96 29.11.96
°T
a
T.
7 τ1
Auct — Repo
1.12.95 2.4.96 1.8.96 29.11.96 1.12.95 2.4.96 1.8.96 29.11.96
10 τ
-STF
13 10 7
4
-Q
v^ DR «——— Repo
LR
a-™™»
H™«™*«
\
\
1
1.12.95 2.4.96 1.8.96 29.11.96 1.12.95 2.4.96 1.8.96 29.11.96 10
1
— SPR AR
10
7
--1
a
— DR- L R — Repo
1.12.95 2.4.96 1.8.96 29.11.96 1.12.95 2.4.96 1.8.96 29.11.96
EVOLUTION OF CENTRAL BANK INTEREST RATES OVER THE LAST 12 MONTHS
eurostat
10 τ
7
--Θ
DROPRO 10 7
--1
1.12.95 2.4.96 1.8.96
10
1
- B R — TR
1
:.a
' — 1 — , _ ^AR Repo
! _
-^-Xl™* -——
^W M* ™ ™29.11.96 1.12.95
ιο
τΓυκΙ
10
7
4
-1
•Repo
10
8
6
4
2
•DR 'LR
.•^.fu/v»/*
10
8
6 τ
4
2
[JAP] •DR
1
•BR
10
1
Θ
•AR10 τ
'.<i...-"...-1
•DR •FED
1.12.95 2.4.96 1.8.96 29.11.96
2.4.96 1.8.96 29.11.96
1.12.95 2.4.96 1.8.96 29.11.96 1.12.95 2.4.96 1.8.96 29.11.96
1.12.95 2.4.96 1.8.96 29.11.96 1.12.95 2.4.96 1.8.96 29.11.96
1.12.95 2.4.96 1.8.96 29.11.96 1.12.95 2.4.96 1.8.96 29.11.96
Explanatory notes
EXPLANATORY NOTES
Exchange rate grid (Table I)
The intervention limit rates fixed in the official grid do not always correspond exactly to + or - 15 % of the central rates, since for each currency pair (whose exchange rates are inversely proportional to one another) the lower limit of one corresponds to the upper limit of the other.
Bilateral fluctuations of the ERM currency
(Graph 1 on page 5)
The daily market exchange rates of all currencies are compared with the relevant bilateral central rates and the differentials between the two calculated.
The graph is divided symmetrically by a horizontal axis along which the points would be plotted if all currencies were at their bilateral central rate and there were therefore no fluctuations.
The curves are drawn by linking the daily points showing the relative positions of each currency. These should be compared in pairs. To find the differential between two currencies, subtract the (positive or negative) values along the y-axis corresponding to each currency.
The graph is drawn with the curve of the stronger currency above that of the weaker. It shows therefore the relative position of each currency vis-à-vis the other currencies. When two curves intersect or merge over a period of time there is no differential between the two currencies and their market exchange rate equals their bilateral central rate. The maximum fluctuation recorded between two currencies is shown within the band, symmetrical with the horizontal axis. The fluctuations of the other currencies in relation to either of the two currencies in question are shown within the maximum fluctuation.
The divergence indicator (Graph 2 on page 5)
The divergence indicator (DI) measures the degree of movement of a specific EMS currency against its maximum divergence spread. In effect, the DI is a mechanism which detects the EMS currencies that deviate upwards or downwards from the Community average as represented by the ECU.For a given currency the divergence indicator is obtained: (i) first by calculating the appreciation or depreciation of
the market rate of the ECU in terms of that currency against its ECU-related central rate;
(ii) and then by comparing the result obtained with the maximum divergence spread (MDS), which is the intervention limit, corrected by the weight of each currency in the basket in such a way that an increase in the weight of a currency reduces its maximum divergence spread.
In order to permit a comparison of movements in the divergence indicators for each of the EMS currencies, the MDS is expressed as an index number ranging between +/-100. At an absolute index number of 75, a currency reaches its divergence threshold. When a currency crosses its "threshold of divergence", this results in a presumption that the authorities concerned will correct this situation by taking adequate measures.
ECU exchange rates (Table II)
The exchange rates for the ECU against the national currencies of the member states of the Community, the
USD and yen are shown as annual averages, monthly averages (for the current year), and daily rates (for the latest available month).
in national currency
Consumer price indices
(Table III)
The consumer price indices in the national currency of each country measure changes in the purchasing power of one unit of national currency spent in the country concerned. Two composite indices are calculated, covering all the member states of the Community (EUR 15) and the 10 member states with currencies participating in the European Monetary System exchange rate mechanism (ERM). (Although the peseta has been participating in the exchange rate mechanism since 19/06/89 and has been included in the calculation of the ECU since 21/09/89, it is only taken into account in the indices relating to the ERM which are included in this bulletin for data after 30/09/89.)
These indices are calculated as weighted arithmetic means (chain indices) of the national indices, the weighting for each member state being its relative share in the final consumption of households of the group of countries in question (EUR 15, ERM), expressed in purchasing power standards, at current prices and purchasing power parities.
Consumer price indices in ECUs (Table IV)
For each country the index of consumer prices in ECUs is calculated by multiplying the national consumer price index by the average movement of the national currency in relation to the ECU during the month. It measures the change in the purchasing power of one ECU in the country concerned.
Three composite indices are calculated, the first covering all the member states of the Community (EUR 15), the second covering 10 member states participating in the European Monetary System exchange rate mechanism (ERM), and the third covering the 12 member countries whose currencies go to make up the ECU. (Although the peseta has been participating in the exchange rate
ECU-EMS Information and central bank interest rates
mechanism since 19/06/89 and has been included in the calculation of the ECU since 21/09/89, it is only taken into account in the indices relating to the ERM which are included in this bulletin for data after 30/09/89).
These three indices are calculated as weighted arithmetic means (chain indices). The weightings are defined as follows: for the EUR 15 and ERM indices, the relative share of each member state in the final consumption of households for the group of countries in question (EUR 15 or ERM), expressed in ECUs at current prices and exchange rates (annual weighting). For the ECU index, the relative share of each member state's currency in the calculation of the ECU (monthly weighting).
ECU bond issues (Tables V & VI)
In table V, issues are recorded as at the payment date. This bulletin covers ECU issues in the Eurobond market, which includes international and foreign issues and domestic issues which can be assimilated with Eurobond issues. More specifically, the domestic issues should be free of withholding tax in the hands of non-residents and subject to similar clearing and settlement procedures. This includes ECU issues offering the option of conversion into other currencies. Main source: International Financing Review.
Table V shows, under the headings:
- Business sector and Governments: national issuers, both private and public.
- Institutions: the European Investment Bank and the Commission of the European Communities (EEC, ECSC, Euratom).
- Organizations: the specialist institutions of the United Nations, the World Bank, the Council of Europe, etc... . Table VI shows detailed information on the latest known issues, irrespective of the payment date.
Outstanding amount of ECU bonds (Table VII)
This table shows the bonds in ECUs outstanding at the end of the last three months and at the end of the last three years. These statistics are taken from a particularly comprehensive database and measure the volume of ECU bonds in circulation. The overall figure is broken down in two ways - by residual maturity and by type of issuer.
Total of the secondary market turnover and % of market taken by ECU securities (Table VIII)
This table shows the volume of transactions on securities conducted by the international clearing houses Cedel and Euroclear. The market shares of the various types of instrument are calculated. These statistics do not cover all
transactions throughout the world, since internal movements are not included. They do, however, give a realistic idea of market developments.
Interest rates and yields on ECU investments
(Table IX)
The interest rates for 1, 3, 6 and 12 months deposits are calculated on the basis of the London market rates LIBID as follows:
- until October 1993: source: Financial Times, Friday rate.
- from November 1993: source : Bank of England, British Banker's Association, daily rates.
The yields of ECU bonds at 1 - 10 years are those provided by Eurostat's yield curve. These are redemption yields. Eurostat's yield curve, which portrays the interest rate structure of maturities ranging from 1 to 10 years, is based on highest quality issues with a triple-Α rating of at least ECU 500 million outstanding, with a very high liquidity (bid-offer spread less than 50 basis points). The curve is calculated daily by fitting a third order polynomial function by regression to the price/yield values of bonds provided by ISMA (International Securities Market Association, London). These values reflect the mean of bid and offer prices communicated by a comprehensive range of financial institutions. The monthly figures included in the table are the arithmetic average of daily figures and the yearly figures are the arithmetic average of daily figures.
Operation rates of the EMI (Table IX)
The interest rate for transactions of the EMI (European Monetary Institute) in ECUs is the weighted average of the most representative rates on the domestic money market of the countries whose currencies make up the ECU basket. It is based on the weighting of the currencies in the ECU basket as derived from the ECU central rates in force. The rate thus calculated for a given month applies to EMI transactions for the following month. In table VII, this rate relates to the month upon which the calculations are based and not to the (following) month during which it is used by the EMI.
ECU yield curve
These graphs show the trend in yields on ECU bonds. Graph 3 shows the ECU yield for bonds due at the end of the last month, at the end of the preceding month and one year previously. Graph 4 shows the development in yields for maturities of 2 and 10 years over the last 12 months. The difference between these two curves reflects the gradient of the rates curve.
Explanatory notes
Central Bank Interest Rates in the EEA countries,
in the US, Japan and Switzerland (Table X)
BELGIUM
Official intervention rates:
Discount rate (DR): rate at which credit institutions can discount commercial paper at the BNB within the ceilings fixed individually according to balance sheet items.
1-week credit granted by tender (AUCT): rate at which the BNB grants cash by tender to credit institutions. The duration of these loans is generally 1 week but can be longer under particular circumstances.
Advances to meet daily deficits (AR): rate at which credit institutions receive money from the BNB within quotas which vary between credit institutions according to balance sheet items and to turnover in the secondary market for government debt-securities.
Central Bank rate (CR): rate at which Primary dealers1 receive overnight money, up to a fixed maximum which is the same for each Primary dealer, from the BNB. This rate will be the next rate applied to the 1-week credit granted by tender.
DENMARK
Intervention rates:
Discount rate (DR): indicative rate which is not attached to any facility with the Danmarks Nationalbank. Within quotas based on the size of the individual bank, deposits on banks' current account with the Danmarks Nationalbank are remunerated by the folio rate. This rate has been equal to the discount rate since the introduction of the present liquidity instruments In April 1992.
Certificates of deposit (CD): rate on 14-day certificates of deposit issued on the last banking day of each week by the Nationalbank.
Repurchase agreements (REPO): rate at which the banks have access to enter into 14-day repurchase agreements in government paper with the Nationalbank. These transactions take place on the penultimate banking day of each week, affecting bank liquidity the following day. The interest rate on repos has equalled the rate on CDs since April 1992.
GERMANY
Intervention rates:
Discount rate (DR): rate at which the Bundesbank discounts eligible trade bills within the limits of the rediscount quotas.
Lombard rate (LR): rate at which the Bundesbank grants loans to banks against certain securities. These loans have
a maturity of up to 90 days and are granted against collateral of government and public sector securities. Rate on repurchase agreements (REPO): rate applied to the Bundesbank's repurchase facility. The Bundesbank buys bonds eligible as collateral for Lombard loans and short-term Treasury discount paper from those banks subject to minimum reserve requirements. These transactions are usually offered by fixed-rate tender or by variable-rate tender for a period of 14, 28 or 35 days.
Other rate:
3-day Treasury bills (3D TB): rate on bills that can be bought or sold by a specific list of banks. This establishes a floor for the cost of short-term money in addition to the fixed amount provided by the discount window.
GREECE
Intervention rates:
Rediscount rate (DR): rate at which the Bank of Greece rediscounts commercial bills. This facility is subject to overall quotas which are allocated among credit institutions according to criteria relating to the size of certain balance sheet items.
Lombard rate (LR): rate at which the Bank of Greece grants liquidity to banks against collateral of government paper. As for the discount window, this facility is subject to overall quotas which are allocated among credit institutions according to criteria relating to the size of certain balance sheet items.
Rate on overdrafts on banks' current accounts with the Bank of Greece (OR): rate at which credit institutions can cover unexpected liquidity shortages by overdrawing their current accounts with the Bank of Greece.
SPAIN
Intervention rates:
Short-term credit to banks (REPO): marginal auction rate of 10-day repo purchases of Banco de España certificates. The Bank of Spain purchases the certificates (with a resale agreement at the maturity of the operation) from banks and savings banks according to the requirements accepted in the auction.
Rate on overnight loans granted by the Banco de España (AR): this rate is considered as being an unofficial intervention rate, but is often used by the Banco de España as an instrument of its monetary policy. It is the rate at which the Banco de España intervenes in the money market. Market makers are asked to made bids in terms of amounts and rates, and the Bank of Spain decides at which point operations should be closed.
The rate published here is the average weighted rate resulting from the intervention.
Primary dealers are market makers for government linear bonds (OLO) and Treasury certificates.
ECU-EMS Information and central bank interest rates
FRANCE
Intervention rates:
Auction (AUCT): twice a week, the Central Bank invites tenders (against collateral) in order to assess credit institutions' demand for Central Bank money. After a centralisation of the requests, the Central Bank will only allocate a proportion of them. The rate is, in practice, known in advance and is intended as a floor for money market rates.
Sales with repurchase agreements (REPO): rate at which banks get liquidity from the Central Bank against Treasury bills or commercial paper. This emergency facility carries a penality rate that is designed as a ceiling for market rates.
IRELAND
Intervention rate:
Short-term facility rate (STF): rate at which the Central Bank grants short-term credits to banks for a period of between 1 day and 1 week.
ITALY
Intervention rates:
Discount rate (DR): rate at which the Banca d'Italia discounts commercial bills.
Fixed-maturity advances rate (LR): rate charged by the Banca d'Italia for advances with a maximum maturity of 32 days against eligible securities for special short-term needs.
Other rate:
Repurchase agreements (Repo) and Reverse Repurchase Agreements (R-Repo): marginal auction rate. The Bank of Italy intervenes when it perceives the need to add or drain liquidity. The choice between repos (Repo) and reverse repos (R-Repo) depends on the structural (debitor or creditor) position of the banking system vis-à-vis the central bank. Foreign currency repos are also conducted, in addition to the securities repos. NETHERLANDS
Intervention rates:
Discount rate (DR): rate at which the Central Bank discounts Treasury paper and approved bills of exchange with a remaining maturity not exceeding 3 months. From 1 January 1994, the Central Bank no longer accepts paper for discounting and thus this rate no longer exists. Data until 12/93 are available on request from Eurostat.
Rate on special advances (SPR): rate charged by the Central Bank to financial institutions for short-term advances.
Official advance rate (AR): rate at which advances on current account against collateral are mainly granted, within a certain limit, to registered credit institutions and a number of public and semi-public financial institutions. This rate establishes a floor for money market rates.
Rate on discount of promissory notes (PRNT): rate serving as a benchmark for commercial rates. From 1 January 1994, the discount rate on promissory notes is maintained as an interest rate, given its use as a reference rate for legal purposes, but it will no longer be published. It is equal to the prevailing rate on advances plus 0.5 percentage points. Data until 12/93 are available on request from Eurostat.
AUSTRIA
Intervention rates
Discount rate (DR): rate at which the Central Bank rediscounts bills of exchange. To qualify for discounting, the paper presented must fulfil certain eligibility requirements. Refinancing ceilings for individual banks are determined on the basis of specified balance sheet items. Lombard rate (LR): rate at which the Central Bank grants loans to banks against collateral. Since this rate is a penalty rate, it is higher than both the discount and the Gomex rate.
Gomex rate (REPO): rate applied to the Central Bank open market operations. Within each bank's refinancing quota, the Central Bank conducts open market transactions in fixed income securities issued by residents or supra-national organisations, denominated in Austrian shillings and listed on the Vienna stock exchange or in cash certificates issued by the central bank.
PORTUGAL
Intervention rates:
Regular rate for liquidity provision (PR R): rate at which the Banco de Portugal supplies liquidity to the money market. The regular operations take place on the first working day of each regular maintenance period (1 week) and mature in the first working day of the subsequent period. When the regular rate for liquidity provision is suspended, the Banco de Portugal can also conduct operations at a variable rate, which take place on the first working day of the regular maintenance period. These data are not given here but are available from Eurostat.
Standing facility rate (SFR): the standing facility refers to liquidity provision operations which mature on the next working day following the day on which transaction takes place, and which take place at the pre-announced rate. The institutions' access to this facility is limited by way of a quota, established on the beginning of each month as a percentage of the total amount of the facility (currently 100 billions of escudos).
Regular liquidity draining rate (DR R): rate at which the Banco de Portugal withdraws liquidity from the money market by selling Treasury bills with repurchase agreement or Central Banks monetary certificates. The regular operations take place on the first working day of each regular maintenance period (1 week) and mature in the first working day of the subsequent period.