This is a repository copy of Determining the parameters in a social welfare function using stated preference data: an application to health.
White Rose Research Online URL for this paper: http://eprints.whiterose.ac.uk/146524/
Version: Accepted Version
Article:
Dolan, P. and Tsuchiya, A. orcid.org/0000-0003-4245-5399 (2010) Determining the parameters in a social welfare function using stated preference data: an application to health. Applied Economics, 43 (18). pp. 2241-2250. ISSN 0003-6846
https://doi.org/10.1080/00036840903166244
This is an Accepted Manuscript of an article published by Taylor & Francis in Applied Economics on 11/03/2010, available online:
http://www.tandfonline.com/10.1080/00036840903166244
[email protected] https://eprints.whiterose.ac.uk/ Reuse
Items deposited in White Rose Research Online are protected by copyright, with all rights reserved unless indicated otherwise. They may be downloaded and/or printed for private study, or other acts as permitted by national copyright laws. The publisher or other rights holders may allow further reproduction and re-use of the full text version. This is indicated by the licence information on the White Rose Research Online record for the item.
Takedown
If you consider content in White Rose Research Online to be in breach of UK law, please notify us by
Resubmitted to Applied Economics Feb 09
Determining the parameters in a social welfare function using
stated preference data: an application to health
Paul Dolan
Professor of Economics, Imperial College Business School.
Aki Tsuchiya*
Reader in Economics and Health Economics, Department of Economics and
the School of Health and Related Research, University of Sheffield.
* Corresponding author: [email protected]. Department of Economics,
University of Sheffield, S1 4DT, UK
ABSTRACT
One way in which economists might determine how best to balance the competing
objectives of efficiency and equality is to specify a social welfare function (SWF).
This paper looks at how the stated preferences of a sample of the general public can
be used to estimate the shape of the SWF in the domain of health benefits. The
results suggest that people are willing to make trade-offs between efficiency and
equality and that these trade-offs are sensitive to what inequalities exist and to the
groups across which those inequalities exist. (90 words)
JEL Classification: I10
Key words: social welfare function, preference elicitation, equality -efficiency trade-off
Running title:
Social welfare function and stated preference data on health
Determining the parameters in social welfare functions using
expressed preference data: an application to health
I. INTRODUCTION
An important consideration when establishing priorities in the public sector is the
amount of benefit generated by alternative allocations. As a result, there has been
considerable research effort devoted to developing technologies that allow the
benefits from a range of public services to be measured and subsequently valued. If
benefits were the only consideration, then the objectives of public policy could be
defined in terms of the maximisation of these benefits. However, policy-makers, as
well as the general public, are also likely to be concerned with how benefits are
distributed.
Although standard economic models assume that people do not care about
inequalities, there is increasing interest in the economics literature in people’s
preferences regarding fairness (Rabin 1993; Fehr and Schmidt, 1999). These models
focus on self-centred inequality aversion in the sense that people care only about
their own outcomes relative to those of other people, but they do not care about
inequality amongst other people per se. This has important implications for how
social welfare functions (SWFs) are constructed and how preferences are aggregated
(for example, see Quesada, 2003). In this paper, we are concerned with an
individual’s distributional preferences as they relate to the treatment of other people.
Specifically, our inquiry is into whether a SWF can be constructed from people’s
other-regarding, or social, preferences (Menzel, 1999).
The SWF is, in principle, a powerful device for determining how best to balance
these competing objectives of efficiency and equality. However, in practice, there
has hitherto been only limited success in developing a SWF that is operationally
useful. There have been some attempts to estimate the parameters of SWFs from
the stated preferences of individuals. For example, Amiel and Cowell (1999) have
asked respondents to choose between different distributions of income across
Similar attempts have been made to estimate the SWF for health, using relatively
small samples of students (Dolan and Robinson, 2001). In this context, a policy
that maximises population health might be of relatively less benefit to less healthy
groups, or a policy that reduces inequalities might forego the opportunity to
improve the health of the relatively healthy. This paper demonstrates how the
stated preferences of a sample of the general public can be used to estimate the
parameters of a SWF in the domain of health. The issues addressed in this paper
are of real policy concern in many countries, such as the United Kingdom, Australia
and New Zealand, that have put into place policies that seek to improve overall
population health and reduce health inequalities (Department of Health, 1999; Rice
and Smith, 2001).
In order for the SWF approach to be operationally useful, two main questions need
to be answered: 1) what type of SWF is to be employed; and 2) how is the shape of
the SWF to be determined? Sections 2 and 3 deal with each of these questions in
turn and Section 4 presents the design of an empirical study that elicited the public’s
preferences over two health programmes, one that maximises health and one that
reduces inequalities in health between particular population subgroups. Section 5
shows how these data can be used to derive a set of relative weights to be given to a
unit health gain to people from different population subgroups and hence to
estimate the shape of the SWF. Section 6 discusses the implications of the results.
II. DEFINING THE SWF
The SWF in economics textbooks are welfarist in the sense that they rely on an
individual’s subjective assessment of her own well-being and, as such, they are
concerned with the distribution of individual utility. In the few empirical studies that
have sought to empirically estimate the parameters in a SWF, economists have used
more readily quantifiable proxies for utility, such as in income (Amiel and Cowell,
1999). Health economics have a tradition of expressing utility in health-related terms
e.g. in terms of quality-adjusted life years (QALYs), where the quality adjustment
weight – the ‘Q’ in the QALY – is typically defined in terms of dimensions of a health
state classification system (see for example Drummond et al, 2005). Whilst health (and
income for that matter) represents only a sub-set of the determinants of utility, it more
problems with comparisons of utility identified by Sen (1992). From a public policy
perspective, citizens and policy-makers may well prefer to focus on the distribution of
health across society rather than on the distribution of utility (see for example, Dolan
and Olsen, 2002; Tsuchiya and Miyamoto, 2009).
In short, there are good normative and practical reasons for defining a health-related
SWF in terms of the different levels of health experienced by different groups
(Dolan 1998). In this paper, differences in health are represented as differences in
average life. When the analytical objective is that of searching for a more equal
distribution of health (rather than utility or health-related utility), a SWF in terms of
health is potentially more useful in a policy context since life is more readily
interpersonally comparable than utilities (see Olsen 1997).
In this study, we assume that health–related social welfare is a function of: a) the
average levels of health of different groups within a given population; and b) the
inequalities in health that exist between those groups. Of course, differences in
health exist within any population sub-group, as well as between groups. In principle,
the SWF could be estimated across groups of any size, including across individuals,
but in practice it would be impossible to get reliable health data at such a micro
level.
There are a number of functional forms that this SWF can take. In order to deal
with varying degrees of inequality, an additive SWF with convexity to the origin to
allow for inequality aversion has been widely used in the literature (Atkinson, 1970;
Little and Mirrlees, 1974; Layard and Walters, 1994). Let us start with a SWF with a
constant elasticity of substitution (CES):
[ ]
[
]
,1
1 r
r b r
a H
H
W = α − +β − − Ha,Hb >0, α +β =1, r ≥−1, r ≠0, [1]
where W is the health-related social welfare and Ha and Hb are the average levels of
health of groups of equal size. (The function is, of course, generalisable to more
than two groups, and to groups of different sizes.) The nature of the SWF, and the
The parameter r measures the degree of aversion to inequality, as represented by the
convexity of the iso-welfare curves. If r = -1, social welfare is equal to the sum of
individual health and there is no aversion to inequality. This utilitarian-type SWF
results in iso-welfare contours that are straight lines with a gradient of -1. If r > -1,
there is aversion to inequality, or diminishing marginal rate of social substitution
(MRSS) between the health of the two groups: along a given iso-welfare curve, the
greater the inequalities in health between the two groups, the greater is the weight
given to the worse-off group relative to the better-off group. In the extreme, r
approaches ∞ and all that matters is the health of the worse-off group. This results
in a Rawlsian-type SWF with right-angled iso-welfare curves.
The parameters and determine the rate at which the welfare of subgroups a and
b enter the social welfare calculus. It might be argued, for example, that relatively
less weight should be given to those who considered more responsible for their
poor health (Le Grand, 1991; Schokkaeart and Devooght, 2003). In the literature
on SWFs, however, it is common to assume ‘anonymity’, which implies that both
individuals and groups are equally deserving of any given gain in well-being
(Musgrave, 1959; Harsanyi, 1982; Boadway and Bruce, 1984). In this paper, we will
also make this anonymity assumption i.e. that = = 0.5.
The objective of this study is to derive the implied weights to be given to a unit
health gain to one group relative to another. This is represented as the MRSS along
the relevant iso-welfare curve. As such, reference is made only to contours of the
SWF, and not to the level of social welfare implied by these contours. In this
respect, the CES SWF is equivalent to the Atkinson SWF (Atkinson, 1970) that was
first proposed to address income distributions and has been applied to the health
context (Wagstaff, 1994). The CES specification is chosen as the baseline
specification because it is individualistic, additive, non-decreasing (or monotonic),
strictly concave, exhibits constant relative inequality aversion (or scale independence
or homotheticity) and, with = , it also satisfies anonymity, and thus, satisfies all
the conventional requirements of a SWF.
We will also look at two alternative SWF specifications by way of sensitivity analysis.
[ ] Ha Hb κ cHa Hb λ
W2 =( + ) − − , where κ >0, ≥1
κ λ
, c≥0, [2]
which provides a family of SWFs that are increasing in total health and decreasing in
inequality in health (Abásolo and Tsuchiya, 2004).
When = = 2, the contours become hyperbolic and when = 1 and = 2, they
become parabolic. The parabolic and hyperbolic specifications are individualistic,
additive, inequality averse and symmetric. The parabolic specification satisfies
constant relative inequality aversion, while the hyperbolic specification satisfies
constant absolute inequality aversion instead. The main characteristic of these two
specifications is that beyond a given level of inequality, social welfare ceases to be
non-decreasing in composite health.
III. ESTIMATING THE MRSS GIVEN A SWF SPECIFICATION
The question now is how do we identify the MRS, given a SWF specification? One
way is to elicit the preferences of the general public over stylised questions
specifically designed to allow us to identify points on the same social welfare
contour. Williams (1997) suggests that respondents could be presented with the
current unequal distribution of health and then asked to think about an equal
distribution of health that makes them indifferent between the two distributions,
which corresponds to the concept of equally distributed equivalent income by
Atkinson (1970). In this way, the general format of the questions would be similar
to those used in empirical studies that have attempted to measure the degree of
inequality aversion in relation to income distributions (Amiel and Cowell, 1999;
Amiel et al, 1999). However, whilst it is possible to take income from one person
and transfer it to another, it is not possible to redistribute health in the same way.
Therefore, it seems more appropriate to design the empirical study in terms of the
distribution of gains in health from an initial position.
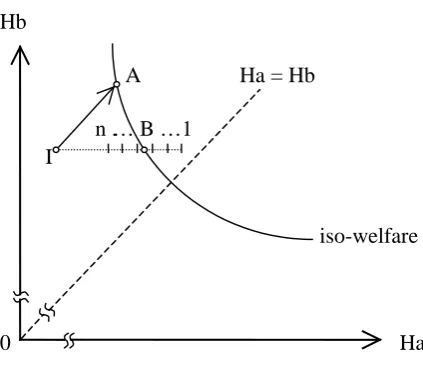
Figure 1 shows the basis of the questions. The initial situation (I) is presented to
respondents together with a programme (A) that will benefit both groups by the
same amount. They are then presented with an alternative programme (B) that
targets the benefit on the worse-off group. The aim then is to determine, in an
in order to be considered equally as valuable as Programme A. Once indifference
between Programmes A and B has been established, the MRSS of the SWF can be
calculated.
For the baseline CES specification, the value of r can be obtained by using standard
spreadsheet procedures (e.g. the “goal seek” tool in MS Excel), by looking for the
value of r that makes W[1] identical at two points, X and Y. Alternatively, for a
mathematical solution, see Abásolo and Tsuchiya (2004). The weight implied to the
less advantaged group a relative to group b is calculated from the MRSS:
) 1 ( r a b a b H H dH dH + = − .
Provided r > 1, MRSS increases exponentially with the extent of the equality
-efficiency trade-off (since the iso-welfare contour in Figure 1 is convex), and so the
mean of any group of values would give greater relative weight to the preferences of
those most concerned about equality. This makes it difficult to account for the
strength of each individual’s preferences in the overall preferences of a group. For
this reason, we will concentrate our analysis and interpretation on the median. Use
of the median is also consistent with the median voter rule, which has been used to
model public policy choices (Mueller 1979). Furthermore, the relationship between
the number of years traded off and the level of inequality aversion implies that the
mean of the former will not correspond to the mean of the latter, thus making the
median a more attractive summary measure to use.
For the hyperbolic and the parabolic specifications, suppose Ha(X), Hb(X) and
Ha(Y), Hb(Y) represent two points on the same indifference curve. By solving
W[2](X)=W[2](Y) for C:
[
] [
]
[
] [
β]
βα α ) ( ) ( ) ( ) ( ) ( ) ( ) ( ) ( Y H Y H X H X H Y H Y H X H X H C b a b a b a b a − − − + − + = ,
the relative weight for the less advantaged group at point (Ha,Hb) will be given by:
[
]
[
]
[
]
( 1)[
]
( 1)) 1 ( ) 1 ( − − − − − + + − − + =
− αα ββ
Any one respondent could be asked to adopt a number of different perspectives when
answering questions of the kind used in this study (see Dolan et al, 2003). In this
study, we asked respondents to adopt a citizen-type perspective, where they are not
explicitly asked to think about being in either group. This is the perspective
adopted by Amiel and Cowell (1999) in their empirical studies on income
inequalities. To us, and as famously emphasised by Rousseau (1762), there is a
legitimate distinction between a person’s self-regarding preferences based on her own
self-interest and her society-regarding preferences which reflect her views about what
society should look like. The distinction has more recently received attention – and
support – from a number of economists and political scientists, including Harsanyi
(1955) and Etzioni(1986). We therefore collected information on a range of
background characteristics in order to examine the extent to which self-interest
might be playing a part in responses.
IV. THE QUESTIONNAIRE DESIGN
Differences in health in this study, as noted in Section 2, have been defined in terms
of average life expectancy. The most obvious differences in mortality in the UK
exist between the social classes (Acheson 1998). Of the six social classes often used
in British surveys, we employ data concerning the top and the bottom classes, which
highlights the extent of the prevailing inequalities and has the advantage that the
fraction of the population in each of these classes is roughly the same (about 7% in
each case). On average, people in the highest social class (such as doctors and other
professionals) live five years longer than those in the lowest social class (unskilled
manual workers such as cleaners.
Scenarios with population subgroups other than social class are also used.
Differences of the same magnitude (five years) in average life expectancy exist
between women and men. This means that by presenting separate respondents with
identical questions regarding life expectancy, but relating them to differences by sex
instead of by social class, it is possible to test whether the degree of inequality
aversionis a function of the groups across which the inequalities exist. To further
test the sensitivity of inequality aversion, other respondents were presented with the
same life expectancy differences across groups that were simply defined as the
The questionnaire was administered during a face-to-face interview, which gave the
interviewer the opportunity to assess the respondent’s understanding of the task and
provided the respondent with the opportunity to ask any clarificatory questions.
The interview began with a brief description of the task and an explanation of the
population sub-group used. The questionnaire was developed through in-depth
interviews and extensive piloting, during which time it emerged that the clearest way
in which to represent the health of the two groups was in the form of graphical
representations, as shown in the Appendix. Respondents were first asked to make a
discrete choice between Programme A (that benefits both groups by the same
amount) and Programme B (that targets the same amount of overall benefit on the
worse-off group). They were told that the two groups were of approximately equal
size and that the two Programmes would cost the same.
For those respondents who chose Programme A, it was assumed that, since they
were unwilling to target the worse off group when overall benefits were the same,
they would also be unwilling to target the worse off group when overall benefits
were reduced, and so no further sub-questions were asked. Those respondents who
chose Programme B were presented with a series of pairwise choices in which the
benefits from choosing B were gradually reduced. This order was chosen to make
the trade-off between efficiency and equality as transparent as possible and because
it was felt that it would be cognitively less demanding for respondents than a
random order that would have required them to ‘jump around’ between different
trade-offs. Note that respondents were not provided with the opportunity to state
that they were indifferent between the two Programmes. This option was in the
pilot interviews but was never chosen and in fact caused confusion.
The interviews were carried out in two rounds using different respondents. In the
first round around half the respondents were given the social class scenario and the
other half were given the sex scenario. In the second round around half the
respondents were given the social class scenario and the other half were given the
quintiles scenario. The response categories presented in the two rounds
(independently of scenario) are shown in Table 1. Respondents in the first round
choices. The response categories in the second round of interviews were revised in
the light of the distribution of responses from the first round, resulting in only four
additional pairwise choices in the second round. In addition to some of the
response categories in the first round being largely redundant, this allowed us to test
whether respondents were following a particular pattern of responses e.g. choosing
the middle option.
For those respondents who initially chose to target on Programme B but then
switched at some point to Programme A, their point of indifference has been taken
to be half-way between the last point at which they chose B and the first point at
which they chose A. The first columns of Table 2 present the implied points of
indifference, their associated inequality aversion parameters depending on SWF
specification, and their corresponding implied relative weights to the worst off
group at the initial point, given the options in Table 1. The precise trade-offs made
by those who choose not to target and by those who always choose to target are
indeterminate, and so, strictly speaking, inequality aversion can only be calculated
for those respondents who switch from Programme B to Programme A at some
point. Having said this, for those who chose A in the initial pairwise comparison,
we have assumed that they are inequality neutral (although we cannot rule out the
possibility that some respondents may have favoured increased inequality). For
those who always chose B, we have assumed that they are indifferent at the implied
point presented on the last row, but again we cannot be sure.
As can be seen, the choice functional form for the SWF does not have much effect
on the relative weight given to the two groups except in the highly inequality averse
region. And even in this range, it is more important to identify the preferences
accurately than it is to identify the correct functional form to represent those
preferences. Under extreme inequality aversion, where a reduction in inequality is
preferred even when it entails loss in the health of the better off so that the
monotonicity principle is violated, the CES specification can no longer
accommodate such preferences. However, the hyperbolic and the parabolic
specifications can, and the relative weights across these two functional forms are
V. THE EMPIRICAL STUDY
In order to interview a broadly representative sample of the general population,
every 8th person on the electoral register in three wards in York, UK, was contacted
and invited to participate, for which they would receive £15. Out of a total of 1,500
letters of invitation, 467 people (31%) agreed to take part. To ensure
representativeness, 140 respondents were selected for interview based on
information on a broad range of characteristics obtained from their reply slips. In
total, 130 individuals were interviewed. The interviews took place at the University
of York and lasted for about an hour. The achieved sample was broadly
representative of the population of the Yorkshire and Humberside region: 48%
were male (compared to 47% for the region as a whole); 50% were aged under 45
(compared to 50%); 67% had children (compared to 66%); 54% were employed
(compared to 56%); and 60% had the minimum level of education (compared to
61%). This paper is based on the life expectancy question, which appeared at the
beginning of the interview and was answered by all 130 respondents.
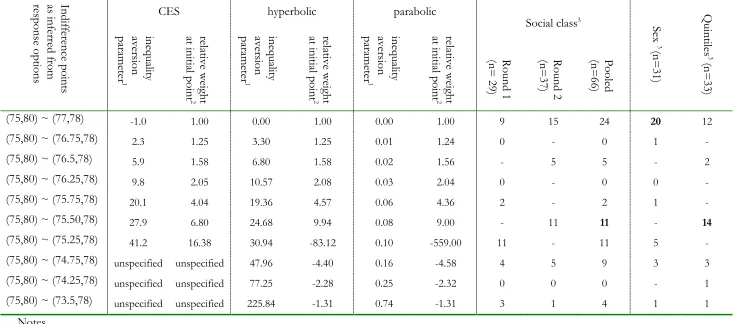
The results are summarised in Table 2 where the last five columns present the
distribution of responses. The numbers of respondents were 29 and 37 for the
social class scenario across the two rounds, 31 for the sex scenario (in round one)
and 33 for the quintiles scenario (in round two). Since the implied trade-offs that
respondents made between the social classes did not differ across the rounds (Mann
Whitney U Test, p>0.05), pooled responses are also reported. Using these pooled
results, the median respondent is indifferent between people in the highest and
lowest social classes living on average to be 80 and 75, respectively (i.e. the outcome
for choosing Programme A), and these groups living to be 78 and 75.5, respectively
(i.e. the outcome for Programme B from the median respondent). Depending on
the SWF specification, this implies that a marginal health gain to the lowest social
class is valued 6.8 to 9.9 times more than a marginal health gain to the highest social
class. This is also the median response when the sub-groups are defined in terms of
the healthiest and unhealthiest quintiles of the population. However, when identical
data are presented but the sub-groups are defined by sex, the median preference is
to favour no targeting of men at all, thus implying that a marginal health gain to
men and to women are equally valued. The responses were not related to any of the
VI. DISCUSSION
This study has sought to determine the shape of a health-related SWF from people’s
stated preferences over various equality -efficiency trade-offs. While a CES was
used as the baseline specification, similar results are derived from the hyperbolic and
the parabolic specifications.
Overall, the results seem plausible, suggesting that there is aversion to inequalities in
life expectancy, but its extent is sensitive to the groups across which the inequalities
exist. However, the study also raises a number of methodological issues that
warrant further discussion. In the first part of each question, the information
regarding the size of the health gains of the two Programmes was easy to
understand and, in the second part of each question, the implications of choices
were made clear through changes in the size of the bars on the graph. Nevertheless,
to facilitate this visual representation, the scales on the graphs did not start at zero
(see the Appendix), and this could have led some respondents to perceive that the
relative difference between the two groups was larger than it really was.
In general, it has been shown that very subtle changes in the framing of a question
can sometimes have a dramatic effect on responses (for an excellent review, see
Rabin 1998). This study was designed to minimise the effects of certain framing
effects but it is impossible to remove every potential bias. For example, we were
aware of the evidence from other studies that suggests that respondents might be
reluctant to give all the benefit to one individual or group (see, for example,
Cuadras-Morato et al 2001). We went further, though, and asked respondents who
chose not to target if they would have targeted if there had instead been a one-year
benefit to the better-off group (and hence a three-year benefit to the worse-off
group). None of these respondents chose to revise their answers.
It is now well established that respondents may give greater weight to the losses of
one group as compared to an equivalent gain to the other group (Schweitzer 1995).
Therefore, the questions were designed so that neither Programme in the two
questions involved any losses, and so that neither Programme was presented as
present when considering potential as well as actual losses from a particular reference
point (Dolan and Robinson 2001). Therefore, if some respondents adopted the
potential gains available to both groups in Programme A as their reference point,
then Programme B would involve a ‘loss’ to the better-off group. It would be
interesting, and policy relevant, to test with further research how sensitive the
degree of inequality aversion is to variation in the initial situation.
There is a status quo bias of a different kind that might have made respondents
more inclined to stick with Programme B if they chose it initially. This relates to the
fact that respondents were always presented with response categories in the same
order; that is, Programmes A and B start out being equally effective and then B
becomes incrementally less effective. This ordering was chosen to make the
equality -efficiency trade-off as transparent as possible and was informed by the
results from the pilot interviews which suggested that the trade-off questions would
have been cognitively too difficult if the ordering of the response categories was
randomised. However, there is the possibility of a status quo bias whereby some
respondents get ‘locked into’ choosing B throughout (see Samuelsen and
Zeckhauser 1988). On the other hand, there is some limited evidence that shows
there may be a ‘left hand side’ bias: when respondents are asked to choose between
two options laid out next to each other, the default choice is the option on the left
hand side, and the right hand side option will be chosen only when it is significantly
more preferable than the default option on the left hand side (see, for example,
McIntosh and Ryan, 2003). Thus, there are two potential biases working in
opposite directions.
Despite these concerns about the data, we believe that this study represents an
advance in terms of both the methodology used and the implications for future
research that seeks to enhance the policy usefulness of stated preference data. It
suggests that people are willing to forego overall health in order to reduce
differences in average life expectancy between the social classes. On the other
hand, differences in the average life expectancies of men and women did not seem
to matter much at all, with the median respondent unwilling to sacrifice any overall
to get behind some of the reasons for the very different attitudes towards health
inequalities by sex as compared to those by social class.
In conclusion, this study has demonstrated that, using carefully designed
questionnaire instruments, the SWF can develop from being a theoretical construct
to becoming a potentially powerful practical policy tool. A survey instrument can
be designed that elicits meaningful trade-off responses from the general population
that can then be used to determine the shape of the SWF. We therefore believe that
the study indicates a promising new avenue of economic enquiry that is relevant to
ACKNOWLEDGEMENTS
We are indebted to Rebecca Shaw who conducted the interviews. The Economic
and Social Research Council (Award No: L128251050) supported Rebecca Shaw
and the fieldwork. We would like to thank John Cairns, Angus Deaton, Atsushi
Higuchi, Daniel Kahneman, Peter Lambert, Chris McCabe, Jan Abel Olsen, and the
anonymous referee for Applied Economics for their helpful comments. The paper has
also benefited from the comments made by participants at a range of seminars,
including those held at Princeton, Toronto, East Anglia and Oslo. We are grateful
to all the respondents who agreed to take part. Last but not least, special thanks are
REFERENCES
Abásolo, I, and A. Tsuchiya, (2004), Exploring social welfare functions and
violation of monotonicity: an example fro inequalities in health. Journal of Health
Economics, 23(2), 313-329
Amiel, Y. and F.A. Cowell, (1999). Thinking about Inequality. Cambridge: Cambridge
University Press.
Amiel, Y., Y.J. Creedy and S. Hurn, (1999), Measuring attitudes towards inequality.
Scandinavian Journal of Economics, 101(1), 83-96.
Atkinson, A.B., (1970), On the measurement of inequality. Journal of Economic Theory,
2, 244-263.
Barry, B.M., (1989), A treatise on social justice, vol I: Theories of justice. University of
California Press.
Boadway, R. and Bruce, N., 1984, Welfare Economics. Basil Blackwell.
Cuadras-Morato, X., Pinto-Prades, J.L. and Abellan-Perpinan, J.M., (2001), Equity
considerations in health care: the relevance of claims, Health Economics,
10(3),187-205.
Department of Health, (1999), Saving lives: Our healthier nation, CM4386, July 1999.
Dolan, P., (1998), The measurement of individual utility and social welfare. Journal of
Health Economics, 17, 39-52.
Dolan, P. and Robinson, A. (2001), The measurement of preferences over the
distribution of benefits: the importance of reference points. European Economic
Review, 45(9), 1697-1709.
Dolan, P., Olsen, J.A., (2002) Distributing Health Care: Economics and Ethical Issues,
Oxford University Press
Dolan, P., Olsen, J.A., Menzel, P. and Richardson J., (2003) An inquiry into the
different perspectives that can be used to elicit preferences to inform
Drummond, M.F., Sculpher, M.J., Torrance, G.W., O’Brien, B.J., Stoddart, G.L.,
(2005), Methods for the Economic Evaluation of Health Care Programmes, 3rd ed, Oxford
University Press
Etzioni, A., (1986), The case for a multiple utility conception, Economics and Philosophy,
2, 159-183.
Fehr, E. and Schmidt, KM., (1999), A theory of fairness, competition and
cooperation, Quarterly Journal of Economics, 114(3) 817-868.
Harsanyi, J.C., (1955), Cardinal welfare, individualistic ethics and interpersonal
comparisons of utility, Journal of Political Economy, 63, 309-321.
Harsanyi, J.C., (1982), Morality and the theory of rational behaviour. In A. Sen and
B. Williams eds. Utilitarianism and Beyond, Cambridge University Press.
Independent Inquiry into Inequalities in Health, (1998), Independent Inquiry into
Inequalities in Health Report (The Acheson Report). London: The Stationary Office.
Layard, R. and A.A. Walters, (1994), Allowing for income distribution. In R. Layard
and S. Glasiter eds. Cost-Benefit Analysis, 2nd ed. Cambridge University Press
(reprinted from R. Layard and A.A. Walters, 1978, Microeconomic Theory,
McGraw-Hill)
Le Grand, J., (1991), Equity and choice, Harper Collins, London.
Little, I.M.D. and J.A. Mirrlees, (1974), Project appraisal and planning for developing
countries: Heinemann Educational Books.
Menzel, P., (1999), How should what economists call ‘social values’ be measured?,
The Journal of Ethics, 3, 249-273.
McIntosh, E. and Ryan, M. (2003) Eliciting preferences for hernia repair: A comparison of
strength of preference modelling and discrete choice experiments. In Health Economists' Study
Group Brunel.
Mueller, D., (1979), Public Choice, Cambridge University Press.
Olsen, J.A., (1997), Theories of justice and their implications for priority setting in
health care. Journal of Health Economics, 16, 625-639.
Quesada, A. (2003), Positional independence in preference aggregation, Social Choice
and Welfare, 20, 3, 363-370.
Rabin, M, (1993). Incorporating fairness into game theory and economics. American
Economic Review, 83, 1281-1302.
Rabin, M, (1998), Psychology and economics. Journal of Economic Literature, 36, 11-46.
Rice, N. and P. Smith, (2001), Capitation and Risk Adjustment in Health Care Financing:
An International Progress Report, Millbank Quarterly, 79, 1.
Rousseau, J.J., (1762), The Social Contract, (1998 translation) London:Wordsworth
Samuelson, W. and R. Zeckhauser, (1988), Status quo bias in decision-making,
Journal of Risk and Uncertainty, 1: 7-59
Sen, A., (1992), Inequality reexamined. Oxford University Press.
Schweitzer, M, (1995), Multiple reference points, framing, and the status-quo bias in
health-care financing decisions, Organizational Behavior and Human Decision Processes,
63, 69-72.
Schokkaert,E., Devooght, K. (2003), Responsibility-Sensitive Fair Compensation in
Different Cultures, Social Choice and Welfare 21, 2, 207-242.
Tsuchiya, A., Miyamoto, J. (2009), Chapter 20 Social choice in health and health
care, in Anand, P., Puppe, C., Pattanaik, P. eds, Handbook of Rational and Social Choice,
Oxford University Press
Tsuchiya, A., Williams, A. (2005), A "Fair Innings" Between the Sexes: Are Men
Being Treated Inequitably?, Social Science & Medicine, 60: 277-286
Wagstaff, A, (1994), QALYs and the equity-efficiency tradeoff, In Cost-Benefit
Analysis, Layard, A. and Glaister, S. eds, Cambridge University Press (reprinted from
Williams, A, 1997, Intergenerational equity: an exploration of the 'fair innings'
Ha: health of the less advantaged group
Hb: health of the more advantaged group
I: initial point
It is assumed that =
A: outcome offered by Programme A
the horizontal broken line: the set of options (1 to n) offered by the alternative
Programme B
B: the point at which the median respondent is indifferent between the two
Programmes, and thus the point through which the iso-welfare curve crosses the
[image:21.595.196.408.135.318.2]broken line
Figure 1: The SWF and the life expectancy questions
Hb
A Ha = Hb
n .… B…1 I
iso-welfare
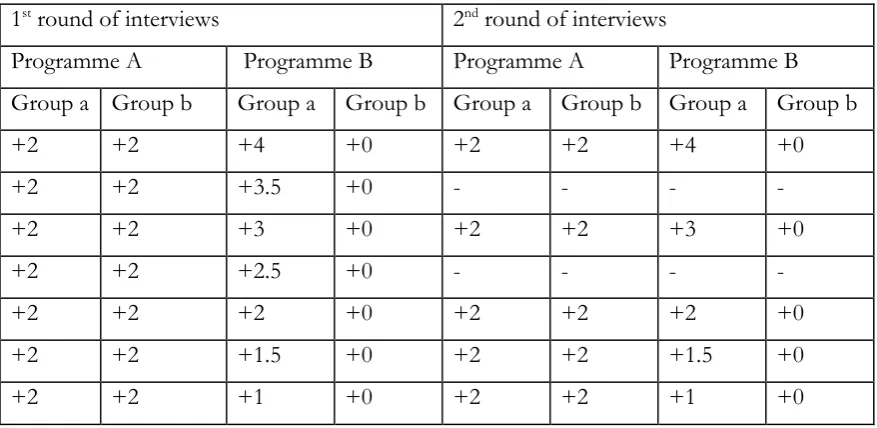
Table 1: The response options
The initial situation is one in which group a (the worst-off group) live to be 73 and
group b (the best-off group) live to be 78. The numbers in the Table show average
increases in life expectancy per group depending on the Programmes chosen for
each of the pairwise choices.
1st round of interviews 2nd round of interviews
Programme A Programme B Programme A Programme B
Group a Group b Group a Group b Group a Group b Group a Group b
+2 +2 +4 +0 +2 +2 +4 +0
+2 +2 +3.5 +0 - - - -
+2 +2 +3 +0 +2 +2 +3 +0
+2 +2 +2.5 +0 - - - -
+2 +2 +2 +0 +2 +2 +2 +0
+2 +2 +1.5 +0 +2 +2 +1.5 +0
+2 +2 +1 +0 +2 +2 +1 +0
“-” indicates where a response category was not offered to respondents
Table 2: The three SWF specifications and the results In di ff er en ce p o in ts as i n fe rr ed f ro m re sp o n se o p tio n s
CES hyperbolic parabolic
Social class3 Se x 3
(n = 31 ) Q u in tile s 3 (n = 33 ) in eq u ali ty av er sio n p ar am et er 1 re la tiv e w eig h t at in it ia l p o in t 2 in eq u ali ty av er sio n p ar am et er 1 re la tiv e w eig h t at in it ia l p o in t 2 in eq u ali ty av er sio n p ar am et er 1 re la tiv e w eig h t at in it ia l p o in t 2 R o u n d 1 (n = 2 9) R o u n d 2 (n = 37 ) P o o le d (n = 66 )
(75,80) ~ (77,78) -1.0 1.00 0.00 1.00 0.00 1.00 9 15 24 20 12
(75,80) ~ (76.75,78) 2.3 1.25 3.30 1.25 0.01 1.24 0 - 0 1 -
(75,80) ~ (76.5,78) 5.9 1.58 6.80 1.58 0.02 1.56 - 5 5 - 2
(75,80) ~ (76.25,78) 9.8 2.05 10.57 2.08 0.03 2.04 0 - 0 0 -
(75,80) ~ (75.75,78) 20.1 4.04 19.36 4.57 0.06 4.36 2 - 2 1 -
(75,80) ~ (75.50,78) 27.9 6.80 24.68 9.94 0.08 9.00 - 11 11 - 14
(75,80) ~ (75.25,78) 41.2 16.38 30.94 -83.12 0.10 -559.00 11 - 11 5 -
(75,80) ~ (74.75,78) unspecified unspecified 47.96 -4.40 0.16 -4.58 4 5 9 3 3
(75,80) ~ (74.25,78) unspecified unspecified 77.25 -2.28 0.25 -2.32 0 0 0 - 1
(75,80) ~ (73.5,78) unspecified unspecified 225.84 -1.31 0.74 -1.31 3 1 4 1 1
Notes
1. Inequality aversion parameter is r for the CES, C for the hyperbolic and the parabolic
2. Relative weight at initial point is the implied equality weight given to group b relative to group a at the initial point where life expectancy for groups
a and b are 73 and 78 respectively.
Appendix: Example of the questions across social class
As you might know, average life expectancy differs by social class.
Whilst actual life expectancy varies between individuals, on average, people in social class 1 live to be 78 and in social class 5 they live to be 73.
Imagine that you are asked to choose between two programmes which will increase average life expectancy. Both programmes cost the same.
In the two graphs below the light grey part shows average life expectancy, and the dark grey part shows the increase in life expectancy. There is a separate graph for each of the programmes.
As you can see, Programme A is aimed at both social classes equally and Programme B is aimed more at social class 5.
Please indicate whether you would choose A or B by ticking one box.
Programme A Programme B
Class I Class V Class I Class V
If the respondent chose A, that was the end of the question. If the respondent chose B, she was told:
“Choosing Programme B might mean that the increase in life expectancy is less overall. For each of the six [or four, depending on the round] choices below, please tick one box to indicate whether you would still choose B, or whether you would now choose A.”
The presentation of the choices was of the same kind as that illustrated above
68 68
70
2 years
74
72 76 78 80 82
2 years
70
0 years
74
72 76 78 80 82