promoting access to White Rose research papers
White Rose Research Online [email protected]
Universities of Leeds, Sheffield and York
http://eprints.whiterose.ac.uk/
This is an author produced version of a paper published in Cement and Concrete Research.
White Rose Research Online URL for this paper: http://eprints.whiterose.ac.uk/76061
Published paper
Kinoshita, H., Swift, P., Utton, C., Carro-Mateo, B., Marchand, G., Collier, N. and Milestone, N. (2013) Corrosion of aluminium metal in OPC- and CAC-based
cement matrices. Cement and Concrete Research, 50. pp. 11-18. ISSN
0008-8846
Corrosion of aluminium metal in OPC- and CAC-based cement matrices 1
2
Hajime Kinoshitaa, Paul Swifta, Claire Uttona, Beatriz Carro-Mateob, Geraldine
3
Marchandc, Nick Collierd and Neil Milestonee
4
5
a
Department of Materials Science and Engineering, The University of Sheffield,
6
Mappin Street, Sheffield, S1 3JD, UK
7
b
The Public University of Navarra, C/ Esquíroz, 30 trasera, Pamplona 31007, Spain
8
c
The National Institute of Applied Sciences (INSA) Lyon, 20 Avenue Albert Einstein
9
69621 Villeurbanne Cedex, France
10
d
National Nuclear Laboratory, Chadwick House, Birchwood Park, Warrington, WA3
11
6AE, UK
12
e
Industrial Research Ltd., 69 Gracefield Road, Lower Hutt, 5040, New Zealand
13
14
Corresponding author: Hajime Kinoshita
15
E-mail: [email protected]
16
Tel.: +44-114-222-5930
17
Fax.: +44-114-222-5943
18
19
Keywords: radioactive waste (E), corrosion (C), blended cement (D), calcium
20
aluminate cement (D)
21
Abstract 23
24
Corrosion of aluminium metal in ordinary Portland cement (OPC) based pastes
25
produces hydrogen gas and expansive reaction products causing problems for the
26
encapsulation of aluminium containing nuclear wastes. Although corrosion of
27
aluminium in cements has been long known, the extent of aluminium corrosion in the
28
cement matrices and effects of such reaction on the cement phases are not well
29
established. The present study investigates the corrosion reaction of aluminium in
30
OPC, OPC-blast furnace slag (BFS) and calcium aluminate cement (CAC) based
31
systems. The total amount of aluminium able to corrode in an OPC and 4:1 BFS:OPC
32
system was determined, and the correlation between the amount of calcium hydroxide
33
in the system and the reaction of aluminium obtained. It was also shown that a
CAC-34
based system could offer a potential matrix to incorporate aluminium metal with a
35
further reduction of pH by introduction of phosphate, producing a calcium phosphate
36
cement.
37
1 Introduction 39
40
1.1 Reaction of aluminium in cement 41
42
Cement can offer economical options for various applications within the nuclear
43
industry, from the structural members of the power plants to the matrices for nuclear
44
waste encapsulation. Cement based systems, typically containing high replacement
45
levels of blast furnace slag (BFS) or pulverised fly ash (PFA), are used to encapsulate
46
a variety of solid and liquid wastes from the nuclear industry [1]. One of the key
47
features of cement systems based on ordinary Portland cement (OPC) is the high
48
alkaline environment (high internal pH) produced in the hardened materials. This is
49
advantageous for the encapsulation of some wastes, such as heavy metals, promoting
50
precipitation [2,3]. OPC-based systems, however, may not be ideal for the
51
incorporation of reactive metals, in particular aluminium containing wastes, as
52
aluminium corrodes in alkaline solutions [4-6]. The process of corrosion above pH 8.5
53
is considered to be the oxidation of aluminium metal to aluminate ions Al(OH)4-,
54
through anodic dissolution of the oxide layer (Al2O3) formed on the surface of the
55
aluminium metal [5,6]. In the corrosion reaction of aluminium with OPC paste,
56
hydrogen gas is generated which can cause problems to the integrity of cemented
57
waste form and increase porosity, which is undesirable for waste encapsulation [7].
58
59
It is generally accepted that lowering the pH of the cementing system and/or reducing
60
available free water will reduce the reaction of aluminium in the cement matrix [7,8].
61
Setiadi et al. [7] reduced aluminium corrosion by using a 9:1 BFS-OPC system which
62
has a lower pH than neat OPC. Other studies have used alternative cement systems
such as calcium sulfoaluminate (CSA) cements [8] or BFS-OPC and PFA-OPC based
64
systems containing excess gypsum (CaSO4·2H2O) or anhydrite (CaSO4) [9].
65
Reduction in aluminium corrosion was observed with large amounts of ettringite
66
being formed in these cases, due to the availability of excess sulphate. The reduction
67
in corrosion was attributed to the reduced amount of free water available for corrosion
68
reactions, due to incorporation of excess water into ettringite, and the reduction of the
69
internal pH of the cement.
70
71
Calcium aluminate cement (CAC) is another alternative cement system. These
72
systems are of interest for aluminium waste encapsulation as they have a lower
73
internal pH (pH=10.5~11.5 [10]) compared with those of OPC-based systems. The
74
reaction between aluminium and CAC has been studied for refractory castables, and
75
some aspects of the reaction e.g. reaction kinetics, effect of temperature and
76
admixture have been reported [11,12]. However, in these studies only small quantities
77
of CAC (2 wt%) were used. With the application of CAC as a matrix for nuclear
78
waste encapsulation in mind, it is of interest to study the corrosion of aluminium in
79
systems with a much higher concentration of CAC. CAC will react with water alone
80
to form a binder of mixed calcium aluminate hydrates. It may also be mixed with a
81
polyphosphate to form a calcium aluminate phosphate cement, through an acid-base
82
reaction [13].
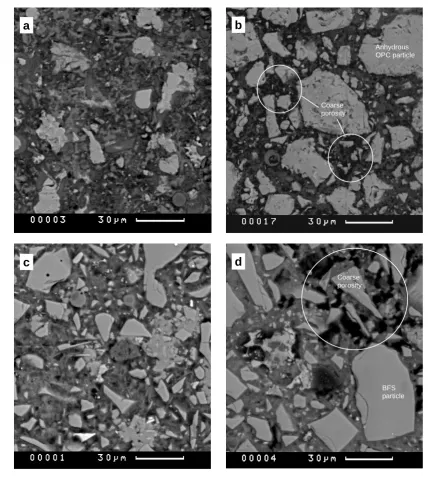
83
84
Although some studies have been performed in this area, key information on the
85
corrosion reaction of aluminium in different cement matrices still remains unclear. In
86
particular, to what extent the aluminium corrosion could occur has yet to be quantified,
87
and the effect of corrosion reactions on cement phases formed. These are particularly
important in the OPC-based systems conventionally used in the nuclear industry.
89
Establishing this information will enable the different cementing systems to be ranked
90
and the maximum amount of aluminium-containing waste that may be incorporated
91
estimated. Quantifying these reactions will, therefore, allow a better design of cement
92
matrices for aluminium encapsulation.
93
94
1.2 Scope of the work 95
96
In the present study, a series of experiments were undertaken to investigate the
97
corrosion reaction of aluminium powder in OPC-based systems to establish the
98
maximum extent of aluminium corrosion able to occur. In addition, the reaction
99
between small pieces of aluminium plate and CAC-based systems with/out
100
modification by sodium polyphosphate were assessed to establish the suitability of
101
this matrix for reactive metal encapsulation. The extent of aluminium corrosion
102
between the different cement systems is compared.
103
104
2 Experimental 105
106
2.1 OPC-based systems 107
108
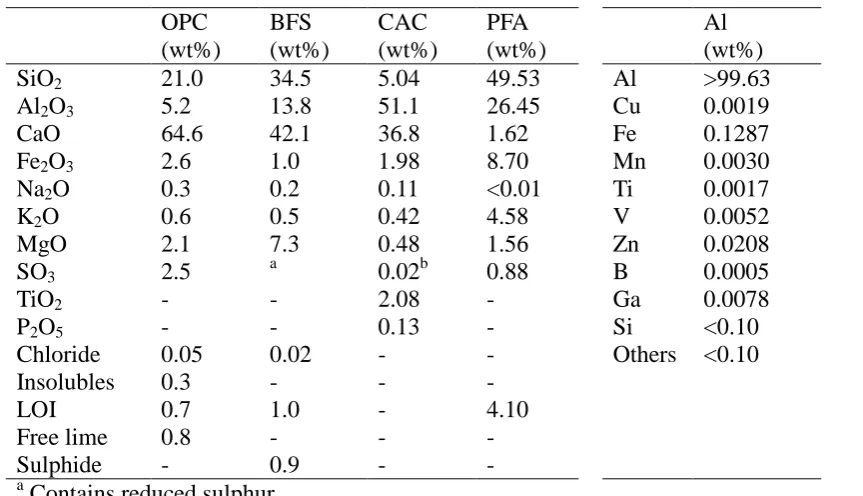
Chemical compositions of raw materials used in the present study are shown in Table
109
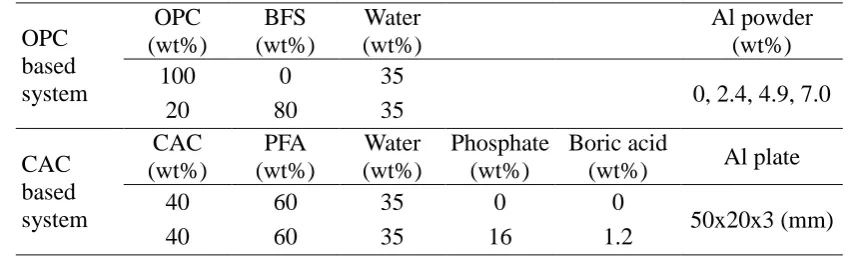
1. OPC-based systems containing aluminium powder were produced in the following
110
manner. Between 0 and 7 g of aluminium powder (< 1 mm Φ) was added to the
111
cement matrices, either a neat OPC or a 4:1 BFS-OPC blend as shown in Table 2. The
112
weighed powders were manually mixed in 50 ml plastic containers with water for 5
minutes, sealed and cured at room temperature for 21 days. A second set of grout
114
samples were prepared using the same procedure, and the pH of each grout was
115
measured in air using a pH probe (glass electrode) and meter WTW pH315i. Readings
116
were taken for approximately 10 minutes after mixing with water, up until the grout
117
set and the probe could not be inserted.
118
119
2.2 CAC-based system 120
121
CAC-based systems, containing small aluminium plates were produced in the
122
following manner. Two cement systems were used as shown in Table 2; a 6:4
PFA-123
CAC blend and a 6:4 PFA-CAC with polyphosphate system. Firstly CAC (Secar 51
124
from Kerneos UK) and PFA were slowly added into a mixing bowl containing either
125
distilled water or sodium polyphosphate ((NaPO3)n, Acros Organics) and boric acid
126
(H3BO3, 99.5+ %, Fisher Scientific) dissolved in distilled water. Boric acid was used
127
to counter the accelerated setting of CAC caused by sodium polyphosphate [13], and
128
to improve workability. A Kenwood bench-top planetary mixer was used at speed 1
129
(ca. 150 rpm) for the initial mixing of 5 minutes, followed by 10 minutes of mixing in
130
a Silverson high shear mixer at 6000 rpm. A portion of mixed cement pastes were
131
cured in a sealed container for 7 days at 20 °C and 95 % R.H. Another portion of
132
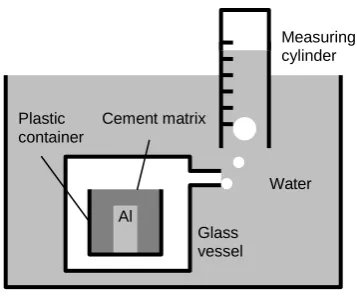
cement pastes was poured into a plastic container (50 ml) and an aluminium plate (50
133
mm x 20 mm x 3 mm) immersed in the grout, as shown in Figure 1. Using this set up,
134
the amount of hydrogen gas generated from the reaction of aluminium with the
135
cement matrix was measured by water displacement in a measuring cylinder.
136
Readings were taken at 7 and 28 days of reaction. The pH of the remaining cement
137
slurries was measured every 30 minutes up to 150 minutes, using the same procedure
previously outlined. In addition to the CAC-based system samples, a sample of 3:1
139
BFS-OPC system (W/S = 0.35) was also prepared containing aluminium plate for
140
comparison.
141
142
2.3 Analysis 143
144
Cured samples were crushed, then immersed into acetone for 7 days to arrest
145
hydration, and subsequently dried under vacuum. Samples were analysed using X-ray
146
diffraction (XRD, Siemens D500 with Cu-Kα radiation (λ = 1.54178 Å)), a
147
differential scanning calorimetry (DSC, Netzsch DSC404C) and scanning electron
148
microscopy (SEM, JEOL JSM 6400) in backscattered electron (BSE) imaging mode.
149
The XRD and DSC samples were ground and sieved to < 63 µm. DSC measurement
150
was run from room temperature to 800 °C at a heating rate of 10 °C/min under N2
151
flow. For SEM analysis, samples were prepared by mounting them in epoxy resin,
152
polishing the observation surface to 1/4 μm and carbon coating.
153
154
3 Results and discussion 155
156
3.1 OPC-based systems 157
158
3.1.1 Observations 159
160
Visual examination of the cement samples revealed an increase in volume of both
161
OPC and 4:1 BFS-OPC systems when the amount of aluminium powder was
162
increased. A clear increase in porosity was observed, believed to be due to the
generation of hydrogen gas which has been previously reported [8,9]. Backscattered
164
electron images of selected samples obtained during SEM observation are shown in
165
Figure 2. Porosity appeared to become coarser in both in OPC and 4:1 BFS-OPC
166
systems when more aluminium was introduced, indicated in Figure 2b and 2d. The
167
OPC system containing aluminium retained more anhydrous cement particles than the
168
neat OPC system, showing clearly that water was preferentially consumed by the
169
corrosion of aluminium over the hydration of OPC. This is likely to have contributed
170
to the increase in porosity.
171
172
3.1.2 Phase analysis 173
174
Figure 3 shows the XRD patterns for OPC with different amounts of aluminium
175
powder. The peaks associated with portlandite (Ca(OH)2), one of the main hydration
176
products of OPC, clearly decreased as the amount of the aluminium was increased.
177
Reflections for unhydrated alite (Ca3SiO5) and belite (Ca2SiO4) were identified.
178
Gibbsite (Al(OH)3) was identified in the systems containing aluminium and this
179
appears to be the main crystalline phase formed from the reaction of aluminium in
180
OPC. A weak peak observed around 9-12o(2θ) points to the existence of small
181
amount of sulphate related phases such as monosulphate (Ca4Al2(SO4)(OH)12.6H2O).
182
No aluminium was observed in these traces suggesting the majority has been
183
consumed, within the detection limits of the XRD (~5 wt%).
184
185
The XRD patterns for samples containing BFS are shown in Figure 4. The phases
186
identified were portlandite, strätlingite (Ca2Al2SiO7.8H2O), alite, belite and gehlenite
187
(Ca2Al2SiO7), a crystalline phase often present in unreacted BFS [7]. Gibbsite was not
observed. The XRD patterns for the 4:1 BFS-OPC system suggest that strätlingite is
189
the main crystalline corrosion product of aluminium in this system. Bayerite
190
(Al(OH)3), reported in a similar system after a much longer curing times (180 days)
191
[7], was not identified in the present investigation. The most remarkable feature of the
192
XRD results for the 4:1 BFS-OPC system was clear evidence that aluminium metal
193
was present in the samples with 4.9 and 7.0 wt% of aluminium loading. This suggests
194
that aluminium metal is much less reactive in the 4:1 BFS-OPC system and that the
195
maximum amount of aluminium powder that will corrode in this particular system is
196
less than 4.9 wt%.
197
198
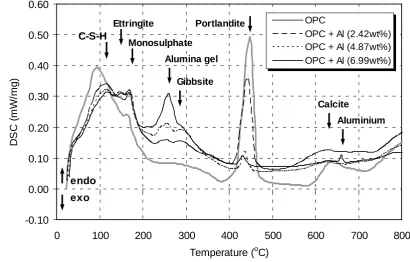
Figure 5 shows the DSC profiles for OPC containing different amounts of aluminium
199
powder. The endothermic peaks up to 200 oC are considered to indicate the
200
dehydration of calcium silicate hydrate gel (C-S-H) (95-120 oC), ettringite (125-135
201
o
C) and monosulphate (185-195 oC) [14]. Although ettringite was not identified by
202
XRD, it is known that its structure can be destroyed rather easily during preparation of
203
XRD samples [8], and hence may not be observed. In the presence of aluminium, the
204
amount of C-S-H appears to have decreased slightly whereas ettringite and
205
monosulphate have increased slightly. In the temperature range of 200-400 oC, there is
206
a clear endothermic peak around 260 oC for an amorphous alumina gel [15,16] along
207
with the main dehydroxylation peak of gibbsite at around 280-310 oC [17,18]. Both of
208
these peaks increase in intensity, with increasing Al content. The amorphous alumina
209
gel appears to be the main reaction product of aluminium corrosion under the
210
conditions used in the present study. As it is amorphous, it was not observed in XRD.
211
The distinctive peak attributed to the dehydroxylation of portlandite at around 450 oC
212
decreased as the amount of aluminium in the system increased. This is most likely
because hydroxide ion (OH-) was consumed by the corrosion reaction of aluminium
214
which forms Al(OH)4- and gibbsite, along with amorphous alumina gel. A small peak
215
was also observed at 660 oC, the melting temperature of aluminium metal, suggesting
216
that a small amount of aluminium metal remained unreacted in the system when 7.0
217
wt% of aluminium was added. Again this was not observed using XRD suggesting the
218
level was below the detection limit (~5 wt%) of XRD.
219
220
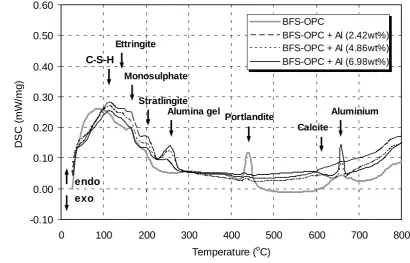
Figure 6 shows the DSC results for 4:1 BFS-OPC system. The profiles are more
221
moderate due to the smaller amount of OPC in the system. As in the OPC system
222
when aluminium was added, the peak area due to C-S-H slightly decreased with
223
increasing aluminium content, whereas those for ettringite and monosulphate
224
increased slightly. The peak for the dehydroxylation of portlandite decreased as the
225
amount of initial aluminium increased, similarly to the OPC system but on a smaller
226
scale. Endothermic peaks around 260 oC suggest that in the 4:1 BFS-OPC system,
227
amorphous alumina gel was again the main reaction product of aluminium corrosion
228
under the conditions of the present study. In contrast, the peak attributed to gibbsite
229
observed in the OPC system at around 280-310 oC was not observed. Instead, the
230
results indicate the existence of strätlingite, with a dehydration peak observed at
231
around 180-220 oC [19,20], which corresponds to the XRD results. These results
232
suggest that corrosion of aluminium tends to form strätlingite rather than gibbsite in
233
the BFS-OPC system, whilst amorphous alumina gel forms in both systems.
234
Formation of strätlingite in BFS cements with aluminium has been reported in another
235
study [7]. Significantly less Ca(OH)2 was available in the BFS-OPC system
236
(approximately 1/7 of that available in OPC system) based on the peak area of
237
Ca(OH)2 in Figures 5 and 6 with 0 wt% aluminium. It is evident that the extent of the
reaction between the cement system and aluminium metal was much less in the
BFS-239
OPC system. A distinct peak at 660 oC from the melting of aluminium metal was
240
observed and the peaks attributed to reaction products e.g. alumina gel were
241
significantly less intense.
242
243
3.1.3 Corrosion of aluminium 244
245
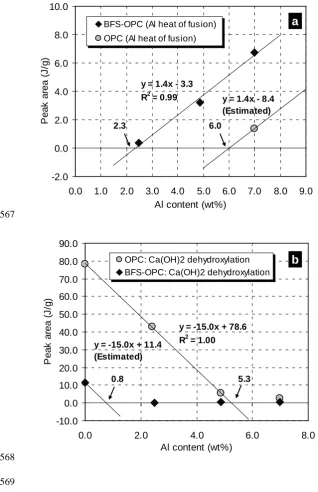
Using the DSC results, the corrosion reaction of aluminium in OPC and 4:1 BFS-OPC
246
systems was further analysed. Figure 7 (a) shows the peak area of the endothermic
247
reaction between 640-670 oC for each DSC curve, which is attributed to the fusion
248
(melting) of aluminium metal. Therefore, the peak area simply corresponds to the
249
amount of unreacted aluminium metal left in the system. For the 4:1 BFS-OPC system
250
a linear correlation between the peak area and the initial aluminium content added is
251
clearly observed. Linear fitting of the data suggests that unreacted aluminium metal
252
would be observed in a 4:1 BFS-OPC system when over 2.3 wt% powdered
253
aluminium was added. In other words, the amount of aluminium powder that is able to
254
corrode completely in 4:1 BFS-OPC system under these conditions is approximately
255
2.3 wt%. The gradient of the liner fit, 1.4 J/g, represents the energy required to melt 1
256
wt% of aluminium per unit sample. Thus, the same linear gradient can be applied to
257
the OPC system, where only one point for fusion of aluminium was obtained. This
258
estimates the amount of aluminium able to corrode in neat OPC as approximately 6.0
259
wt% under the conditions of the present study.
260
261
Figure 7 (b) shows similar analysis for the endothermic peak between 405-480 oC
262
attributed to the dehydroxylation of Ca(OH)2. The peak area is proportional to the
amount of Ca(OH)2 presented in the system. The data indicate that the amount of
264
Ca(OH)2 remaining in both systems decreased with increasing aluminium content,
265
more than would be expected from simple dilution due to aluminium additions alone.
266
This reduction of Ca(OH)2 continued and corresponded to the amount of aluminium
267
corroded in the system. Little Ca(OH)2 was observed in the systems where the
268
maximum corrosion of aluminium took place and excess aluminium metal was left
269
unreacted. This suggests that the corrosion of aluminium consumes OH- and water in
270
the system, and that the level of OH- becomes too low to sustain the sufficient
271
formation of Ca(OH)2 and further corrosion of aluminium. A significant effect of pH
272
in alkaline solution on the long-term aluminium corrosion (up to 80 days) has been
273
reported [21], and the results obtained in the present study show that this is also the
274
case for the aluminium corrosion in the cementitious matrices.
275
276
The availability of water in the system may also explain the drop in Ca(OH)2 content.
277
A greater amount of unhydrated cement clinker phases remained in the cements with
278
aluminium as observed in the SEM results due to consumption of water in corrosion
279
reactions at the expense of some cement hydration reactions. Consequently less
280
Ca(OH)2 may be expected to have formed. However, this cannot solely be the reason
281
for the suppression of Ca(OH)2 formation, as a significant amount of C-S-H existed in
282
aluminium containing systems as shown in Figures 5 and 6. Therefore, it is reasonable
283
to consider that the consumption of OH- ions due to the corrosion of aluminium was
284
the main reason for the reduction of Ca(OH)2 in the studied system. The reaction of
285
aluminium with the cement pore solution removes OH- from solution, reducing the pH.
286
This in turn causes any Ca(OH)2 in the system to dissolve. It is known that Ca(OH)2
287
releases OH- at pH < 12.4 whereas C-S-H is able to remain stable as low as pH = 11.0
~ 10.5 by changing the Ca/Si ratio through incongruent dissolution [3].
289
290
The gradient of the liner fit in Figure 7 (b), -15.0 J/g, represents the reduction in the
291
energy needed to dehydroxylate Ca(OH)2 in the system, thus the reduction in the
292
amount of Ca(OH)2 through reaction with 1 wt% of aluminium per unit sample. The
293
data for the OPC system suggests that little Ca(OH)2 should be observed in the system
294
when aluminium content exceeds 5.3 wt%. Since 6.0 wt% of aluminium is estimated
295
to corrode in this systems as discussed previously, there must be a small amount of
296
OH- provided from other phases. In the BFS-OPC system, little Ca(OH)2 would be
297
produced beyond 0.8 wt% of aluminium content when Ca(OH)2 is assumed to be the
298
only source of OH- as in the OPC system. However, the amount of aluminium
299
estimated to corrode in this systems is 2.3 wt% (Figure 7 (a)). This gap indicates that
300
the assumption is not correct and that a significant amount of OH- was provided also
301
from other phases. In the BFS:OPC system this is possibly from dissolution of C-S-H.
302
Further studies are required to understand the role of C-S-H in the corrosion of
303
aluminium. It is important to study the corrosion of aluminium over the longer-term
304
as different hydration products may provide OH- resulting in different corrosion
305
products at various stages of cement hydration. These results also explain why
306
bayerite (Al(OH)3) formation has been observed in the BFS-OPC system after 180
307
days [7], which was probably due to the slow formation of Ca(OH)2 in the BFS-OPC
308
system.
309
310
3.1.4 Initial pH of cement pastes 311
312
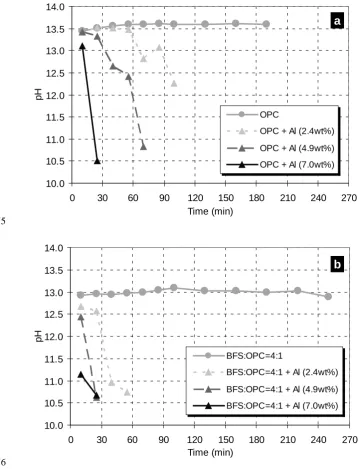
Fig. 8 (a) and (b) show the pH of samples at the initial stage of hydration for the OPC
and BFS-OPC systems, respectively, with different aluminium contents. As shown in
314
the figures, both for the OPC and 4:1 BFS-OPC systems, the pH of the
aluminium-315
containing samples decreased with time. The decrease occurred more rapidly the more
316
aluminium was added, indicating the increased consumption of hydroxide ions due to
317
aluminium corrosion, which is consistent with the DSC results. Because the
BFS-318
OPC system had a lower pH due to the less OPC and greater effective water volume,
319
the impact of incorporated aluminium on the pH appeared to be greater than in the
320
neat OPC system. The BFS:OPC samples lost their fluidity faster, and the pH
321
decreased more rapidly, however in the longer term the overall amount of corrosion
322
was less. The drop occurs more rapidly in the BFS:OPC samples, due to the overall
323
lower amount of OH- ions available compared to the neat OPC samples, where OH- is
324
more abundant and replenished during OPC hydration.
325
326
3.2 CAC-based system 327
328
3.2.1 Phase analysis 329
330
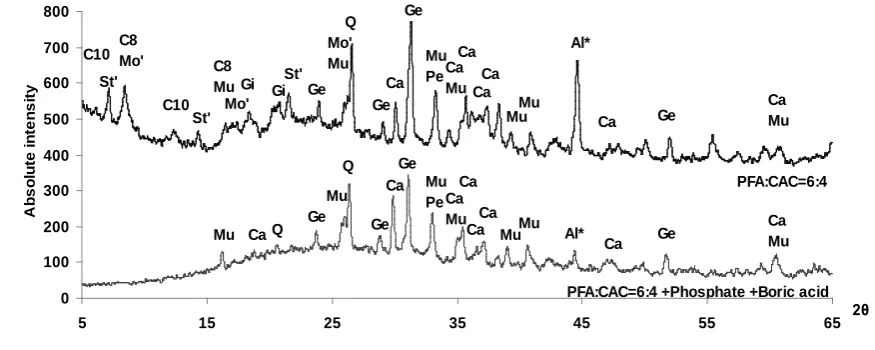
Figure 9 shows the XRD patterns of the PFA-CAC system after 7 days of curing at 20
331
o
C with and without the addition of sodium polyphosphate and boric acid. For the 6:4
332
PFA-CAC system, the peaks observed can be attributed to the crystalline phases
333
usually found in hydrated CAC systems i.e., Gibbsite, CAH10 (CaAl2O14H10), C2AH8
334
(Ca2Al2O13H16) along with the crystalline phases from the original unhydrated CAC
335
i.e., monocalcium aluminate (CaAl2O4), gehlenite (Ca2Al2SiO7) and perovskite
336
(CaTiO3) or PFA i.e., quartz (SiO2) and mullite (Al6Si2O13). Some of the peaks at
337
lower angles may be attributed to a strätlingite-related phase (Ca2Al2SiO7.7.25H2O) or
a monosulphate-related phase (Ca4Al2(SO4)(OH)12.10H2O). Formation of such phases
339
related to strätlingite and monosulphate has been reported in a similar system based
340
on PFA-CAC in presence of additional calcium sulphate [22] although this system
341
also formed additional phases ettringite and C3AH6 (Ca3Al2(OH)12). The difference
342
from the present study is probably due to the presence of calcium sulphate.
343
344
When sodium polyphosphate and boric acid were introduced to the 6:4 PFA-CAC
345
system, the XRD results changed significantly. No peaks for the crystalline hydrate
346
phases were observed, with only those from the raw materials were identified. This
347
lack of crystalline CAC hydration products was one of the key features of the sodium
348
polyphosphate modified CAC system in our previous studies [13]. It has been
349
reported that amorphous phases are obtained from CAC with sodium polyphosphate
350
addition [23-25]. Some suggests an amorphous calcium aluminate phosphate hydrate
351
(C-A-P-H) gel [23] while other suggests a mixture of calcium phosphate based gel
352
(NaCaPO4.xH2O) and alumina gel (Al2O3.xH2O) [24]. Because of the compositional
353
flexibility, a generic chemical formula of CaxHy(PO4)z.nH2O has been suggested more
354
recently [25].
355
356
3.2.2 Initial pH of cement pastes 357
358
Figure 10 shows the pH of CAC-based cement systems at the initial stages of
359
hydration along with that of the 3:1 BFS-OPC system. The pH of the 3:1 BFS-OPC
360
system (75 wt% BFS) was very similar to that for the 4:1 BFS:OPC (80 wt% BFS)
361
system shown in Figure 8 (b), approximately 13 throughout the measured period. The
362
difference in BFS content appears to have little effect on the pH of BFS-OPC system
at this early stage of hydration. On the other hand, the PFA-CAC system exhibited a
364
significantly lower pH level, starting from an initial pH 11.7 rising to 12.1 prior to
365
initial set. When sodium polyphosphate and boric acid were introduced into the
PFA-366
CAC system, there was a dramatic decrease in pH, indicating the effect of acid-base
367
reaction between polyphosphate (acid) and CAC (base) [24]. The pH for this system
368
remained lower (pH 10.3) during the measuring period of 150 minutes. This system
369
may have significantly reduced aluminium corrosion.
370
371
3.2.3 Corrosion of aluminium 372
373
In all systems, the generation of hydrogen gas was observed, although the aluminium
374
plates immersed in the cement matrix did not completely corrode after 28 days of
375
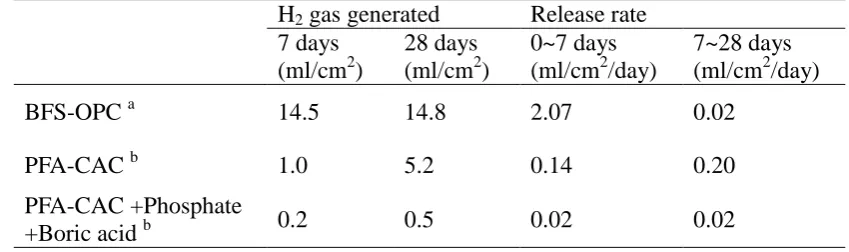
reaction. Table 3 shows the amount of the generated hydrogen gas measured after 7
376
and 28 days for each system. The 3:1 BFS-OPC system clearly produced a significant
377
amount of hydrogen gas with the majority generated within the first 7 days. The
378
hydrogen gas release rate was 2.07 ml/cm2/day in the initial 7 days, and the rate
379
reduced to 0.02 ml/cm2/day between 7 and 28 days. This reduction is most likely to be
380
caused by the OH- depletion in the local environment surrounding the aluminium
381
plate due to the initial intensive corrosion reaction of aluminium. As discussed in the
382
former sections, the reaction of aluminium in the OPC-based system will cause a
383
reduction of OH- and Ca(OH)2 in the system, to the level where no further reaction
384
can occur.
385
386
The PFA-CAC system produced much smaller amounts of hydrogen gas compared to
387
the 3:1 BFS-OPC system. Since the pH of the paste at initial set was lower in the
PFA-CAC system, it is expected to have a lower level of internal pH (a lower
389
concentration of OH-) in the hardened sample compared with the 3:1 BFS-OPC
390
system, which must have contributed to these results. In the PFA-CAC system,
391
however, the generation rate of hydrogen gas did not decrease after 7 days, but
392
slightly increased from 0.14 ml/cm2/day in the initial 7 days to 0.20 ml/cm2/day in the
393
following period. These results suggest that the reaction mechanism of aluminium in
394
the PFA-CAC system is different from that in the OPC-based system. It would appear
395
that the OH- in the PFA-CAC system remained sufficiently high for aluminium
396
corrosion, even after a certain amount of aluminium had reacted. This is most likely
397
due to the conversion reactions of the metastable phases CAH10 and C2AH8 which
398
inevitably convert to C3AH6 and Al(OH)3 as shown in Eqs. 1 and 2 [26].
399
400
2CAH10 C2AH8 + 2Al(OH)3 + 9H2O --- (1)
401
3C2AH8 2C3AH6 + 2Al(OH)3 + 9H2O --- (2)
402
403
Although the pH change during these conversion reactions is considered to be
404
minimal [26], they lead to a release of water, which is then available for further
405
reaction of the remaining anhydrous material. It has been suggested that the amount of
406
aluminium corrosion in a CAC-based system corresponds to the extent of the cement
407
hydration reaction [12].
408
409
When sodium polyphosphate and boric acid were introduced into the PFA-CAC
410
system, the generation of hydrogen gas was further reduced, with a release rate as
411
small as 0.02 ml/cm2/day which did not change throughout the measured period. This
412
must be attributed to the obvious fact that the CAH10 and C2AH8 phases did not form
in this system so the conversion reactions of these phases could not take place
414
releasing water for further hydration reaction of the system. The results also show
415
that aluminium corrosion in the PFA-CAC system can be effectively reduced by
416
adding polyphosphate and boric acid. Further longer term tests are required to
417
establish the extent of hydrogen generation since the present investigation concerns
418
the initial stage of hydration up to 7 days. As discussed in the previous sections,
419
different hydration products would provide OH- for the corrosion of aluminium
420
resulting in different corrosion products at different stages of cement hydration. This
421
is especially important for the PFA-CAC systems as the conversion of metastable
422
phases appeared to have significant effects on the aluminium corrosion.
423
424
4 Summary 425
426
A series of experiments have investigated the reaction of aluminium metal in OPC-
427
and CAC-based systems. The results show that the maximum amount of aluminium
428
powder able to corrode in the neat OPC system investigated in the present study was 6
429
wt%. The amount of hydroxide ion in the system appeared to determine the extent of
430
aluminium corrosion, mainly through Ca(OH)2 in the OPC system. It was found that
431
the corrosion of aluminium could cause the severe reduction of Ca(OH)2 in the system.
432
The corrosion of aluminium was reduced to 2.3 wt% in the 4:1 BFS-OPC system, due
433
to the reduced concentration of OH- by dilution of OPC and increased effective water
434
volume.
435
436
In the CAC-based system, less initial reaction occurred on the aluminium plate
437
compared with that in the OPC-based system due to the lower matrix pH. However,
aluminium continued to corrode slowly in the PFA-CAC system up to 28 days, the
439
maximum time period tested in the present work. Introducing sodium polyphosphate
440
and boric acid provided an effective way to reduce the reaction of aluminium in the
441
PFA-CAC system. The initial pH of the fluid paste at initial set was reduced, and the
442
formations of metastable calcium aluminate hydrates were avoided by forming an
443
amorphous binding phases. This system generated the lowest hydrogen gas release
444
compared with the CAC-PFA based systems and the 3:1 BFS:OPC system. Further
445
long term tests need to be conducted to establish whether calcium aluminate
446
phosphate cements are suitable for long term aluminium encapsulation.
447
448
Acknowledgement 449
450
Part of this work was supported by CASE award from the National Nuclear
451
Laboratory (NNL) and EPSRC. The authors wish to thank Hanson Heidelberg
452
cements for supplying BFS and OPC materials.
453
454
REFERENCES 455
456
[1] N. B. Milestone, Reactions in cement encapsulated nuclear wastes: need for
457
toolbox of different cement types, Advances in Applied Ceramics, 105 [1] (2006), pp.
458
13-20.
459
[2] F. P. Glasser, Chemistry of cement-solidified waste forms, in: R. D. Spence (Eds.),
460
Chemistry and Microstructure of Solidified Waste Forms, Lewis Publisher, USA
461
(1993) pp. 1-39.
462
[3] M. Atkins, F. P. Glasser, Application of Portland cement-based materials to
radioactive waste immobilisation, Waste Management, 12, (1992) pp. 105-131.
464
[4] M. R. Tabrizi, S. B. Lyon, G. E. Thompson, J. M. Ferguson, The long-term
465
corrosion of aluminium in alkaline media, Corrosion Science, 32 (1991) pp. 733-742.
466
[5] R. D. Armstrong, V. J. Braham, The mechanism of aluminium corrosion in
467
alkaline solutions, Corrosion Science, 38 [9] (1996) pp. 1463-1471.
468
[6] S. -M. Moon, S. -I. Pyun, The corrosion of pure aluminium during cathodic
469
polarization in aqueous solutions, Corrosion Science, 39 [2] (1997) pp. 399-408.
470
[7] A. Setiadi, N. B. Milestone, J. Hill, M Hayes, Corrosion of aluminium and
471
magnesium in BFS composite cements, Advances in Applied Ceramics, 105 [4]
472
(2006) pp.191-196.
473
[8] Q. Zhou, N. B. Milestone, M. Hayes, An alternative to Portland Cement for waste
474
encapsulation - The calcium sulfoaluminate cement system, J. Hazard. Mater., 136 [1]
475
(2006) pp. 120-129.
476
[9] N. C. Collier, N. B. Milestone, P. D. Swift, Immobilisation matrices for
477
intermediate level nuclear wastes using sulphate activated BFS/OPC and PFA/OPC
478
composite cements, Advances in Applied Ceramics, 109 [5] (2010) pp. 269-274.
479
[10] Safety data sheet, Secar Range, SDS-Secar-GB062009, Kerneos SA (2008).
480
[11] M. D. M. Innocentini, L. A. Nascimento, A. E. M. Paiva, V. C. Pandolfelli, B. A.
481
Menegazzo, L. R. M. Bittencourt, Aluminium-containing refractory castables, Part I,
482
Evaluation of hydrogen-gas generation, Am. Ceram. Soc. Bull., 82 [6] (2003) pp.
45-483
51.
484
[12] A. R. Studart, M. D. M. Innocentini, I. R. Oliveira, V. C. Pandolfelli, Reaction of
485
aluminium powder with water in cement containing refractory castables, J. Euro.
486
Ceram. Soc., 25 (2005) pp. 3135-3143.
487
[13] P. Swift, H. Kinoshita, N. C. Collier, C. A. Utton, Phosphate-modified calcium
aluminate cement for radioactive waste encapsulation, Advances in Applied Ceramics,
489
112 [1] (2013) pp. 1-8.
490
[14] P. R. Ellis, Analysis of mortars (to include historic mortars) by differential
491
thermal analysis, in: Historic Mortars, Characteristics and Tests, Proceedings, RILEM
492
Publications (2000) pp. 133-147.
493
[15] T. Meher, A.K. Basu, S. Ghatak, Physicochemical characteristics of alumina gel
494
in hydroxyhydrogel and normal form, Ceramics International, 31 (2005) pp. 831-838.
495
[16] J. L. Szetu, R. L. Frost, J. T. Kloprogge, S. C. Russell, W. Martens, Dehydration
496
and dehydroxylation of alumina gels prepared from tri-sec-butoxyaluminium
497
modified with short chain aliphatic acids, Thermochimica Acta, 362 (2000) pp. 37-48.
498
[17] J. T. Kloprogge, H. D. Ruan, R. L. Frost, Thermal decomposition of bauxite
499
minerals: infrared emission spectroscopy of gibbsite, boehmite and diaspore, J. Mater.
500
Sci., 37 (2002) pp. 1121-1129.
501
[18] B. Zhu, B. Fang, X. Li, Dehydration reactions and kinetic parameters of gibbsite,
502
Ceramics International, 36 (2010) pp. 2493-2498.
503
[19] A. Bakolas, E. Aggelakopoulou, A. Moropoulou S. Anagnostopoulou, Evaluation
504
of pozzolanic activity and physicomechanical characteristics in metakaolin-lime
505
pastes, Journal of Thermal Analysis and Calorimetry, 84 (2006) pp. 157–163.
506
[20] T. Matschei, B. Lothenbach, F. P. Glasser, Thermodynamic properties of Portland
507
cement hydrates in the system CaO–Al2O3–SiO2–CaSO4–CaCO3–H2O, Cement and
508
Concrete Research, 37 (2007) pp. 1379-1410.
509
[21] M. R. Tabrizi, S. B. Lyon, G. E. Thompson, J. M. Ferguson, The long-term
510
corrosion of aluminium in alkaline media, Corrosion Science, 32 [7] (1991) pp.
733-511
742.
512
[22] L. Fernández-Carrasco, E. Vázquez, Reactions of fly ash with calcium aluminate
cement and calcium sulphate, Fuel, 88 (2009) pp. 1533-1538.
514
[23] W. Ma, P. W. Brown, Hydration of sodium phosphate-modified high alumina
515
cement, J. Mater. Res., 9 [5] (1994) pp. 1291-1297.
516
[24] T. Sugama, N.R. Carciello, Sodium phosphate-derived calcium phosphate
517
cements, Cement and Concrete Research, 25 [1] (1995) pp. 91-10.
518
[25] S. V. Dorozhkin, Amorphous calcium (ortho)phosphates, Acta Biomaterialia, 6
519
(2010) pp. 4457-4475.
520
[26] K. L. Scrivener, J.-L. Cabiron, R. Letourneux, High-performance concretes from
521
calcium aluminate cements, Cement and Concrete Research, 29 (1999) pp. 1215-1223.
522
Table 1 Chemical composition of raw materials.
524
OPC BFS CAC PFA Al
(wt%) (wt%) (wt%) (wt%) (wt%)
SiO2 21.0 34.5 5.04 49.53 Al >99.63
Al2O3 5.2 13.8 51.1 26.45 Cu 0.0019
CaO 64.6 42.1 36.8 1.62 Fe 0.1287
Fe2O3 2.6 1.0 1.98 8.70 Mn 0.0030
Na2O 0.3 0.2 0.11 <0.01 Ti 0.0017
K2O 0.6 0.5 0.42 4.58 V 0.0052
MgO 2.1 7.3 0.48 1.56 Zn 0.0208
SO3 2.5 a 0.02b 0.88 B 0.0005
TiO2 - - 2.08 - Ga 0.0078
P2O5 - - 0.13 - Si <0.10
Chloride 0.05 0.02 - - Others <0.10
Insolubles 0.3 - - -
LOI 0.7 1.0 - 4.10
Free lime 0.8 - - -
Sulphide - 0.9 - -
a
Contains reduced sulphur b
Determined using Leco analysis
525
Table 2 Formulation of samples, normalised by the weight of base cement
527
(OPC+BFS=100, CAC+PFA=100).
528
OPC based system
OPC (wt%)
BFS (wt%)
Water (wt%)
Al powder (wt%)
100 0 35
0, 2.4, 4.9, 7.0
20 80 35
CAC based system
CAC (wt%)
PFA (wt%)
Water (wt%)
Phosphate (wt%)
Boric acid
(wt%) Al plate
40 60 35 0 0
50x20x3 (mm)
40 60 35 16 1.2
529
Table 3 Hydrogen gas generated from the reaction of aluminium.
531
H2 gas generated Release rate 7 days
(ml/cm2)
28 days (ml/cm2)
0~7 days (ml/cm2/day)
7~28 days (ml/cm2/day)
BFS-OPC a 14.5 14.8 2.07 0.02
PFA-CAC b 1.0 5.2 0.14 0.20
PFA-CAC +Phosphate
+Boric acid b 0.2 0.5 0.02 0.02
a
BFS:OPC=3:1, w/s=0.35, b See Table 2 for details of formulations
532
534
Fig. 1 Schematic diagram of experimental setup for hydrogen measurement.
535
536
Cement matrix
Water
Al
Glass vessel
Measuring cylinder
537
[image:28.595.76.505.76.561.2]538 539
Fig. 2 Backscattered electron images of samples: (a) pure OPC, (b) OPC with 7.0 wt%
540
of Al, (c) 4:1 BFS-OPC and (d) 4:1 BFS-OPC with 7.0 wt% of Al.
541
542
a b
c d
Anhydrous OPC particle
BFS particle Coarse
porosity
2θ
10 20 30 40 50 60
A bs o lut e i nt e n s it y 0 100 200 300 400 500 600 700 800 A B C A B A B A B A B A B A A A A P P P P P P G G G G
M
+ Al (2.42 wt%) + Al (4.87 wt%) + Al (6.99 wt%)
OPC B 2θ
10 20 30 40 50 60
A bs o lut e i nt e n s it y 0 100 200 300 400 500 600 700 800 2θ
10 20 30 40 50 60
A bs o lut e i nt e n s it y 0 100 200 300 400 500 600 700 800 A B C A B A B A B A B A B A A A A P P P P P P G G G G
M
+ Al (2.42 wt%) + Al (4.87 wt%) + Al (6.99 wt%)
OPC B
543
544
Fig. 3 XRD patterns of OPC system with different amount of aluminium contents
545
after 21 days of curing at room temperature. Reflection peaks are indexed as: A (Alite),
546
B (Belite), C (Calcite), G (Gibbsite), M (Monosulphate), P (Portlandite).
547
2θ
10 20 30 40 50 60
A bs o lut e i nt e n s it y 0 100 200 300 400 500 600 700 800 A B C ABA
B Al Al A B A Ge Ge P P P P S S S M
+ Al (2.42 wt%) + Al (4.86 wt%) + Al (6.98 wt%)
BFS:OPC=4:1 2θ
10 20 30 40 50 60
A bs o lut e i nt e n s it y 0 100 200 300 400 500 600 700 800 A B C ABA
B Al Al A B A Ge Ge P P P P S S S M
+ Al (2.42 wt%) + Al (4.86 wt%) + Al (6.98 wt%)
BFS:OPC=4:1
549
550
Fig. 4 XRD patterns of 4:1 BFS-OPC system with different amount of aluminium
551
contents after 21 days of curing at room temperature: Reflection peaks are indexed as:
552
A (Alite), Al (Aluminium), B (Belite), C (Calcite), Ge (Gehlenite), M (Monosulphate),
553
P (Portlandite), S (Strätlingite).
554
556
-0.10 0.00 0.10 0.20 0.30 0.40 0.50 0.60
0 100 200 300 400 500 600 700 800
Temperature (oC)
DS
C (
m
W
/m
g
)
OPC
OPC + Al (2.42wt%) OPC + Al (4.87wt%) OPC + Al (6.99wt%)
endo
exo
Calcite
Aluminium Portlandite
Gibbsite Alumina gel Monosulphate Ettringite
C-S-H
[image:31.595.89.500.104.366.2]557
Fig. 5 DSC profiles for OPC system with different amount of aluminium powder after
558
21 days of curing at room temperature.
559
561
-0.10 0.00 0.10 0.20 0.30 0.40 0.50 0.60
0 100 200 300 400 500 600 700 800
Temperature (oC)
DS
C (
m
W
/m
g
)
BFS-OPC
BFS-OPC + Al (2.42wt%) BFS-OPC + Al (4.86wt%) BFS-OPC + Al (6.98wt%)
endo
exo
Calcite
Aluminium Portlandite
Stratlingite Alumina gel Monosulphate Ettringite
C-S-H
[image:32.595.84.495.103.366.2]562
Fig. 6 DSC profiles for 4:1 BFS-OPC system with different amount of aluminium
563
contents after 21 days of curing at room temperature.
564
566
y = 1.4x - 3.3 R2 = 0.99
-2.0 0.0 2.0 4.0 6.0 8.0 10.0
0.0 1.0 2.0 3.0 4.0 5.0 6.0 7.0 8.0 9.0 Al content (wt%)
P
eak
ar
ea (
J
/g)
BFS-OPC (Al heat of fusion)
OPC (Al heat of fusion)
2.3 6.0
y = 1.4x - 8.4 (Estimated)
567
y = -15.0x + 78.6 R2 = 1.00
-10.0 0.0 10.0 20.0 30.0 40.0 50.0 60.0 70.0 80.0 90.0
0.0 2.0 4.0 6.0 8.0
Al content (wt%)
P
eak
ar
ea (
J
/g)
OPC: Ca(OH)2 dehydroxylation BFS-OPC: Ca(OH)2 dehydroxylation
y = -15.0x + 11.4 (Estimated)
0.8 5.3
568
[image:33.595.57.376.109.602.2]569
Fig. 7 Peak area in DSC data for OPC and 4:1 BFS-OPC systems with different
570
amount of aluminium content: (a) endothermic peaks of aluminium fusion in 640-670
571
o
C and (b) endothermic peaks of Ca(OH)2 dehydroxylation in 405-480 oC.
572
573
a
574
10.0 10.5 11.0 11.5 12.0 12.5 13.0 13.5 14.0
0 30 60 90 120 150 180 210 240 270
Time (min)
pH
OPC
OPC + Al (2.4wt%)
OPC + Al (4.9wt%)
OPC + Al (7.0wt%)
575
10.0 10.5 11.0 11.5 12.0 12.5 13.0 13.5 14.0
0 30 60 90 120 150 180 210 240 270
Time (min)
pH
BFS:OPC=4:1
BFS:OPC=4:1 + Al (2.4wt%)
BFS:OPC=4:1 + Al (4.9wt%)
BFS:OPC=4:1 + Al (7.0wt%)
[image:34.595.66.426.105.575.2]576 577
Fig. 8 Change in pH of samples at the initial stage of hydration: (a) for OPC system
578
and (b) for 4:1 BFS-OPC system with different amount of aluminium.
579
580
a
581 0 100 200 300 400 500 600 700 800
5 15 25 35 45 55 65 2θ
A b s o lu te i n te n s it y Q Ge Mu Ge Ca Ca Ca Ge Ge Mu Pe Ca Q Mu Mu
PFA:CAC=6:4 +Phosphate +Boric acid PFA:CAC=6:4 Ca Mu Al* Mu Ca Ca Ca Mu C8 Mu Ge Mo' Mu Ge Ca Ca C10 Ge Ge Mu Pe Ca Q
Mo' Mu Ca
[image:35.595.85.523.99.274.2]Mu Al* Mu Ca Ca Ca Mu St' Gi Gi St' C8 Mo' St' C10 582 583
Fig. 9 XRD pattern of PFA-CAC system with and without addition of sodium
584
polypohosphate and boric acid after 7 days of curing at 20 oC. Reflection peaks are
585
indexed as: Ca (Monocalcium aluminate), C8 (C2AH8), C10 (CAH10), Gi (Gibbsite),
586
Ge (Gehlenite), Mu (Mullite), Mo’ (Monosulphate related phase), Pe (Perovskite), Q
587
(Quartz), St’ (Strätlingite related phase). Al* is reflection from the Al sample holder.
588
590
9.0 9.5 10.0 10.5 11.0 11.5 12.0 12.5 13.0 13.5 14.0
0 30 60 90 120 150 180 210
Time (min)
pH
3:1 BFS:OPC 3:2 PFA:CAC
3:2 PFA:CAC +Pho +Bor pH level for Al corrosion
591
[image:36.595.83.416.102.366.2]592
Fig. 10 Change in pH of cement matrices at the initial stage of hydration: CAC-based
593
systems compared with 3:1 BFS-OPC system.
594